Historically, there have been only 4 such instances of two consecutive big gap-down sell-off days. Each of these instances marked a local low within the same week. Last Friday (March 27) concludes the 5th instance.
$SPX
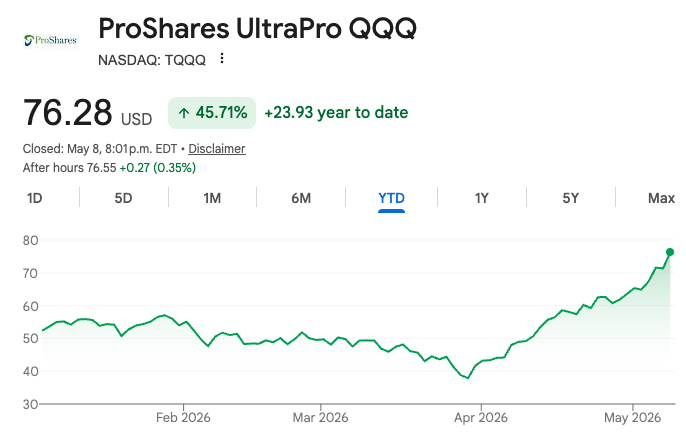
$TQQQ up more than 45% YTD.
When the ETF $TQQQ has a positive year,
• It has historically averaged +84.5%.
• The middle (median) outcome in positive years is +82.98%.
This is quite high because the historical positive returns are heavily skewed upward (many +50% to +198% years).
Of the 16 other cases, in 3 of them the April ATH first appeared after a prolonged wait — similar to what happened in 2026 — i.e., the previous ATH was at least 50 days earlier. These 3 cases occurred in 1965, 2013, and 2019. The full-year returns in those cases were +9.1% (1965), +29.6% (2013), and +28.9% (2019).
Can there be a better bullish sign?
S&P 500 has made two new all time highs in April.
Since 1950, $SPX has made 2+ April ATHs in only 16 years.
The index closed positive in all 16 years, with an average gain of 20.6%.
Even better? 14 of those 16 years had double digit gains.
Media is hyping the recent Iran war oil shock as the trigger for sustained higher inflation once again, with headlines claiming it already pushed US CPI to 3.3% and warning of worse to come.
But look at this chart I made of S&P 500 vs Oil relative performance (indexed since 2020):
Oil prices and the S&P 500 have been mostly decoupled for the majority of the time (shaded area since March 2020). When not decoupled, they’ve often been positively related rather than inverse. Only moderately inverse relatively since the end of the trade war last year.
This suggests equity markets aren’t pricing in a major stagflationary oil shock �� stocks have continued climbing overall despite oil volatility.
VP of the Federal Reserve Bank of Dallas, Lutz Kilian, reinforces the point in his EIA presentation:
• One-time oil price shocks cause only a temporary blip in headline CPI.
• Negligible effects on core inflation.
• Inflation expectations remain well-anchored. No wage-price spiral.
• The old 1970s narrative (oil shocks = sustained high inflation) has little support today.
Modern economies are far more resilient and less oil-intensive.
Don’t fall for the recycled fearmongering. Data and markets > media narrative.
You can view Kilian's slides here: https://t.co/BR33l3WNVu
$SPY $SPX
The #ExtremeFractalTrough signal just fired yesterday on $TSLA.
This is an extremely rare setup — it has only triggered 9 other times since Tesla went public.
I dug into every single one of those 9 prior occurrences.
After each signal:
• The median maximum run-up over the next 52 weeks was +101%.
• The median risk-reward ratio hit 7.47 (max gain vs max drawdown).
A few of these moves were absolutely nuclear — including one +952% runner from 2020.
When this rare signal has appeared in $TSLA, it has consistently delivered massive upside relative to the short-term risk.
Now we’re looking at the 10th occurrence.
#TSLA #ExtremeFractalTrough #Trading
Gaps like today (a >2% opening gap, at least 3 days away from the local low, and with the close before the gap-up day at least 3% above the local low) have only happened 7 times since 1962. The stats are as follows: in 3 cases the gap was filled within 2 days, in 1 case it took more than 2 months, and in 3 cases the gap was never filled. $SPX
@Bluekurtic If you only keep days that are at least 3 days away from the local low and the close before the gap-up day is at least 3% above the local low, you will have only 7 such instances.
Correction: last year $SPX bottomed on April 7th. April 9th rhythms today.
A similar candlestick pattern has only happened 4 times previously. Each time, the market made a local low within the same week. Every time except 2022, the market also made the low of the year. https://t.co/APb7adFfVR
Historically, there have been only 4 such instances of two consecutive big gap-down sell-off days. Each of these instances marked a local low within the same week. Last Friday (March 27) concludes the 5th instance.
$SPX