Is #Meta’s Alberta AI data center really a #GasToPower infrastructure story?
#Rextag helps teams see why the answer is yes.
Meta plans to invest more than US$9.1 billion to build its first AI data center in Canada and its largest outside the United States.
The project will be built in #Sturgeon County, Alberta, and tied to dedicated natural gas-fired power generation.
That matters because Alberta’s grid cannot support multiple large #AI data center projects without additional power supply.
This #Rextag map, powered by Energy DataLink, shows the planned Meta AI data center site and Greenlight Electricity Centre alongside operational natural gas transmission pipelines, transmission power lines, power plants and generation assets, and compressor stations across Alberta.
The infrastructure story is bigger than one campus.
The planned Greenlight Electricity Centre is a 932 MW natural gas-powered plant expected to begin operating in the second half of 2030.
#Pembina Pipeline Corporation is part of the consortium behind the power project, linking the data center directly to Alberta’s gas and power infrastructure.
For #DataCenters, power, natural gas, and investment teams, the key question is not only where AI campuses are being built.
It is how land, gas supply, power generation, transmission access, and local infrastructure come together around large-load demand.
Read more in our blog: https://t.co/wFZ9qNuJi8
Can AI data center growth in Alberta be understood without mapping the gas and power infrastructure behind it?
Are core U.S. shale basins still where upstream capital wants to be?
#Rextag helps map the infrastructure logic behind that trend.
U.S. upstream dealmaking reached a two-year high in Q1 2026, led by the merger of Devon Energy and #CoterraEnergy, while #Mitsubishi Corporation’s acquisition of #Aethon Energy reinforced continued interest in gas assets tied to Gulf Coast demand.
This Rextag map places the #PermianBasin, Haynesville/Bossier, Eagle Ford, and Greater Anadarko Basin against major oil and gas pipelines, processing plants, and #LNG export infrastructure.
That context matters because acreage value is not only about the rock.
It is also about access to gathering, processing, long-haul takeaway, and export markets.
For upstream, midstream, and investment teams, the story is not only who bought what.
It is why infrastructure-connected basins keep attracting capital.
For more information, please visit our Blog: https://t.co/7rP1GsXX2A
Can upstream M&A be understood without mapping the infrastructure behind the basin positions?
Is Northeast gas demand putting pipeline expansion back on the table?
#Rextag maps the infrastructure context behind the renewed conversation.
After years of limited pipeline development in the region, several proposed projects are aimed at moving more Marcellus and Utica gas into New England, New York, and broader Northeast markets.
This Energy DataLink map places those projects within the wider #NaturalGas network, including Tennessee Gas Pipeline, Transco, Millennium Pipeline, Iroquois Pipeline, and the Algonquin Gas Transmission system.
It also shows operational compressor stations and nearby #DataCenters, helping connect the supply-side story with growing demand centers.
Projects highlighted by RBN Energy include #Enbridge’s AGT Enhancement and Project Beacon, #Williams’ Northeast Supply Enhancement, and the proposed Constitution Pipeline.
Together, they show why the #Northeast gas story is becoming a capacity story.
Appalachian supply sits upstream of major population centers, power markets, and digital infrastructure growth, but transportation constraints still shape how efficiently that gas can reach demand.
For utility, midstream, and market analysis teams, the question is not only how much demand is growing.
It is whether the pipeline network can move the supply where it is needed.
For more information, please visit our Blog: https://t.co/eeWUiovlbL
Can Northeast power demand growth be evaluated without mapping the pipeline corridors behind it?
Is the San Juan Basin starting to look investable again?
#Rextag helps show why #SixthStreet’s reported $1 billion bet on #LOGOS Energy, LLC is also a basin infrastructure story.
This Rextag map places Logos’ Mancos position across more than 240,000 net acres against operational wells, horizontal laterals, and compressor infrastructure across New Mexico and Colorado.
That context matters.
The #MancosShale is not only an acreage story. Existing gathering, compression, processing, and transportation infrastructure help connect production to market and reduce the need for major new buildout.
Recent well results have also drawn attention back to the basin, while #MachNaturalResources’ San Juan entry added to the sense that investor interest is returning.
For #NaturalGas and upstream teams, the point is not only who bought the asset.
It is how acreage, well performance, and infrastructure come together inside the #SanJuanBasin.
For more information, please visit our Blog: https://t.co/HEth3dgNEu
Can renewed investor interest in the San Juan Basin be understood without mapping the infrastructure around the acreage?
Are #Enbridge’s latest projects really separate expansions?
#Rextag’s map shows why the answer is no.
The projects follow several major #EnergyInfrastructure demand corridors across North America.
On the Gulf Coast, Enbridge is advancing the Tres Palacios expansion, adding 25 Bcf of #NaturalGas storage capacity tied to LNG and regional demand growth.
Further north, the Vector Pipeline expansion would add 400 MMcf/d of westbound capacity between Joliet and Dawn.
The map also highlights Mainline Optimization Phase 2, supporting about 250 kbpd of additional crude oil egress capacity.
In West Texas, the 300 MW Cone Wind Project will supply power for #Meta data center operations, showing how #DataCenters are becoming another infrastructure demand driver.
For midstream and power teams, the story is not only about new projects.
It is about how LNG, utilities, crude transportation, and digital growth are shaping where infrastructure capital moves next.
Read more in our blog: https://t.co/06nLZpRbUu
Which demand corridor do you think will drive the next wave of infrastructure investment?
Is #Ovintiv’s portfolio now mainly a Permian-and-Montney story?
#Rextag helps teams see why the answer is yes.
#Ovintiv reported Q1 2026 production of 679 MBOE/d, with the Permian and Montney now defining the company’s core North American footprint.
In the #Permian, the #Rextag map shows Ovintiv’s operated oil wells alongside major crude oil infrastructure and large-diameter natural gas takeaway corridors.
In the #Montney, it shows operated gas wells and Ovintiv processing plants tied into major regional pipeline infrastructure.
The recent NuVista acquisition further expands Ovintiv’s Montney position, while the Anadarko sale reinforces the shift toward a more focused two-basin strategy.
For #Upstream, midstream, and investment teams, the story is not only where Ovintiv produces.
It is how those core basin positions connect to processing and transportation infrastructure.
Read more in our blog: https://t.co/ztFeDyj4yG
Can Ovintiv’s Permian and Montney strategy be understood without mapping the infrastructure around both basins?
Can #PermianResources’ oil growth be separated from its gas takeaway strategy?
#Rextag shows how the company’s operated wells sit inside one of North America’s densest energy infrastructure networks.
Permian Resources reported Q1 2026 production of 412.9 MBOE/d, including 192.3 MBbls/d of oil and 703.0 MMcf/d of natural gas, while raising the midpoint of its full-year oil guidance to 192.5 MBbls/d.
This Rextag map places the company’s operated wells near large-diameter crude and gas pipelines, processing plants, and the Waha hub area.
That infrastructure matters because Permian oil growth is closely tied to gas takeaway, processing access, and transportation flexibility.
The company has pointed to firm transportation capacity as a way to manage the volatile #Waha gas market, with more than 700 MMcf/d of gas exposure expected to reach Gulf Coast and DFW markets by 2027.
For #Upstream and midstream teams, the story is not only about wells.
It is about how #GasTakeaway and infrastructure access support oil development in a constrained basin.
For more information, please visit our Blog: https://t.co/lktESq9duS
Can Permian oil growth still be understood without mapping the gas infrastructure around it?
Is #EQT Corporation’s Appalachian gas footprint becoming part of the #DataCenters power story?
#Rextag helps teams see why the answer is yes.
EQT reported 618 Bcfe of sales volume in Q1 2026, above the high end of guidance.
But the larger story is not only production.
This #Rextag map shows EQT-owned and EQT JV wells, acreage, natural gas transmission pipelines, and compressor stations across the Marcellus and Utica region.
Nearby operational data centers show why #AppalachianGas is increasingly tied to power demand across Mid-Atlantic and Northeast markets.
For #NaturalGas, power, and infrastructure teams, the question is not only where gas is produced.
It is how close that supply sits to growing digital load.
Read more in our blog: https://t.co/iWSid0pae1
Can data center power growth in Appalachia be understood without mapping the gas infrastructure around it?
Is Alberta turning #NaturalGas into a competitive edge for #AIInfrastructure?
#Rextag helps teams visualize why the province is drawing attention from hyperscale developers.
This #Rextag map shows how major gas transmission pipelines, processing plants, gas-fired power generation, and existing data centers already overlap across Alberta.
That infrastructure base helps explain the pitch: faster power availability, existing fuel supply, and a system already built for large-scale industrial demand.
The strategy is moving beyond theory. Provincial officials are targeting major data center investment, and #Pembina Pipeline Corporation and #Kineticor are advancing a proposed 900 MW gas-fired project tied to large-scale data center development.
For energy, telecom, and investment teams, the point is not only where data centers may be built.
It is whether Alberta’s gas, power, and digital infrastructure can create a real siting advantage.
For more information, please visit our Blog: https://t.co/SekeaCihP6
Can hyperscale growth in Alberta be understood without mapping the gas and power system behind it?
Could #Geothermal become a real part of the #DataCenters power stack?
#Rextag helps teams visualize why the U.S. Southwest is getting attention.
This Rextag map shows operational geothermal power plants, 230 kV+ transmission lines, and operational data centers across #California, # Nevada, #Utah, #Arizona, and #New Mexico.
In Energy DataLink, these five Southwest states contain 56 operational geothermal power plants. That regional concentration matters because it sits near major power and digital infrastructure growth areas, giving Big Tech a clearer path to evaluate geothermal as part of the data center power stack.
Recent deals make the trend harder to ignore. Google signed a 3 GW framework agreement with #FervoEnergy, and a separate 150 MW Nevada geothermal arrangement involving #OrmatTechnologies, Inc. and #NVEnergy. Meta also signed a 150 MW geothermal agreement with XGS Energy in New Mexico.
The infrastructure story is bigger than any one project.
Geothermal offers firm clean power, and that matters for AI and cloud infrastructure that cannot rely only on intermittent generation. The map helps show where geothermal resources, transmission access, and digital load are beginning to line up across the Southwest.
For more information, please visit our Blog: https://t.co/aY8rrsD5F8
Can the next phase of AI power planning be understood without mapping geothermal, transmission, and data center overlap?
Is Texas’ AI infrastructure advantage really an accident?
#Rextag helps teams see why the answer may be no.
Texas built major transmission corridors to move West Texas wind power toward population centers. Today, those same high-voltage routes are becoming part of the #AIInfrastructure siting story.
#ERCOT data shows more than 480 proposed large data centers seeking grid connection through 2032, representing more than 418 GW of requested capacity. Not all of that proposed load will be built, but the queue shows where developers are testing the grid for future AI infrastructure growth.
This #Rextag map, powered by Energy DataLink, shows existing and proposed #DataCenters alongside operational 345 kV+ transmission lines and simplified #CREZ corridor overlays.
Dallas-Fort Worth remains the strongest existing market, but Ellis County, Mitchell County, Scurry County, and Harris County show how future growth is increasingly tied to remaining pockets of grid and transmission capacity.
The #TexasPower story is no longer only about generation. It is about where large loads can realistically connect.
For more information, please visit our Blog: https://t.co/pIdBKJl8qC
Can AI data center growth still be planned without mapping the transmission corridors behind it?
Is #Shell’s ARC deal really about more than upstream scale?
#Rextag helps teams see how Montney acreage, gas processing, transmission corridors, and LNG export infrastructure are starting to align.
Shell’s proposed acquisition of #ARCResources would expand Shell’s natural gas position across the #Montney Basin and strengthen its supply connection to #LNGCanada.
This Rextag map shows how ARC and Shell acreage positions sit near Shell-linked processing assets, major Western Canadian gas transmission systems, and the Coastal GasLink corridor feeding Kitimat.
The infrastructure story is clear: #LNG export demand is making connected upstream acreage more strategic than isolated production alone.
For #Midstream, upstream, and M&A teams, the deal is not only about who owns the gas.
It is about how that gas connects to processing, pipelines, and Pacific export demand.
For more information, please visit our Blog: https://t.co/895DoBrXAs
Can Montney consolidation still be understood without mapping the LNG corridor behind it?
Can investors still afford to ignore Appalachian gas takeaway corridors?
#Rextag’s Energy DataLink map shows why Rover remains more than a standalone pipeline.
Ares Management has acquired a 32.4% stake in Rover from #Blackstone, adding to renewed investor interest in large-scale U.S. natural gas infrastructure.
The #Rover system sits between the Marcellus and Utica shale plays and Midwest demand markets, supported by compressor stations, gas storage, and nearby gas-fired power generation.
That infrastructure context helps explain why investors continue buying into large U.S. #NaturalGas corridors.
The deal also follows another Rover-related transaction involving Traverse Midstream, reinforcing how Appalachian takeaway systems remain important #Midstream assets.
This #Rextag map shows why Rover matters: it connects supply from Appalachia to downstream markets where storage and power infrastructure help anchor demand.
For more information, please visit our Blog: https://t.co/C56N0hDbEB
Can Appalachian gas takeaway still be understood without mapping the full supply-to-market corridor?
Is #ConocoPhillips’ Q1 Lower 48 story really a #PermianBasin infrastructure story?
#Rextag helps teams see how production concentration connects to the oil, gas, and processing networks around it.
ConocoPhillips reported 1,453 MBOED of Lower 48 production in Q1 2026, led by the Delaware Basin, Eagle Ford, Midland Basin, and Bakken.
The #Rextag map shows the company’s acreage positions across those core shale regions, together with crude oil pipelines, large-diameter gas transmission systems, and processing plants.
The Permian leads the production story, but the infrastructure context is broader.
The #EagleFord ties into South Texas and Gulf Coast market corridors. The #Bakken connects into regional processing and long-haul transportation systems.
For #Upstream, midstream, and investment teams, the question is not only where production comes from.
It is how those shale positions connect into the networks that move production downstream.
For more information, please visit our Blog: https://t.co/X6n7TGPukj
Can Lower 48 production scale still be understood without mapping the infrastructure around the acreage?
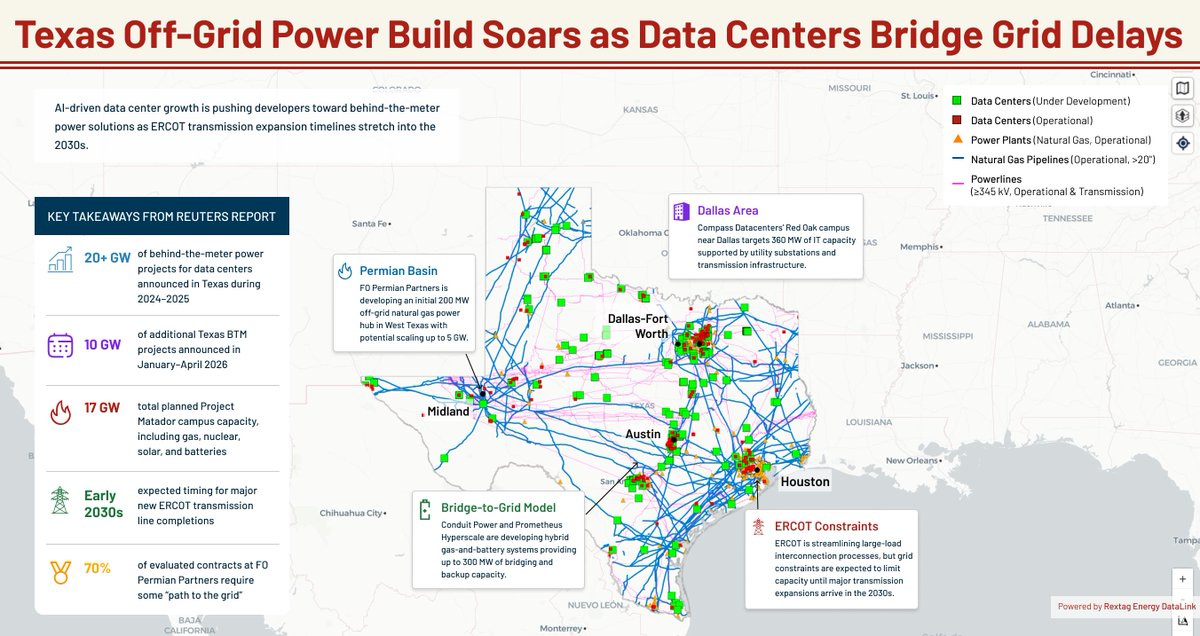
Can Texas #AI Infrastructure afford to wait for the grid to catch up?
#Rextag’s Energy DataLink map shows why many developers are looking for answers closer to the fuel, generation, and transmission network.
Across Texas, new #DataCenters are increasingly appearing near gas-fired power plants, large-diameter gas pipelines, and major transmission corridors. That overlap helps explain why private power and #BridgeToGrid strategies are becoming central to the Texas buildout.
#FO Permian Partners is developing a natural gas-powered West Texas hub that could eventually reach 5 GW. #Fermi America’s Project Matador points to a larger #PowerGeneration campus concept combining natural gas, nuclear, solar, and battery storage.
The #Rextag map shows the infrastructure logic behind the trend: growth is moving toward places where fuel, generation, transmission, and land can come together.
For more information, please visit our Blog: https://t.co/Vgmp0eYrT5
Where does Canada’s new #LNG export milestone actually start?
#Rextag helps teams see the corridor behind #LNGCanada’s April export record, from Montney gas supply to the Kitimat terminal.
In April 2026, LNG Canada exported more than 1 million metric tons of LNG for the first time in a single month.
This #Rextag map connects the Kitimat export terminal with the Coastal GasLink corridor, the #Montney Basin, natural gas pipelines, compressor stations, and processing plants across northeast British Columbia and Alberta.
For #Midstream and gas market teams, the milestone shows how upstream supply, pipeline takeaway, and export capacity now connect Western Canadian gas more directly to Asian demand.
For more information, please visit our Blog: https://t.co/GWfzLeFPqN
Can Canada’s LNG export growth still be understood without mapping the Montney-to-Kitimat corridor?
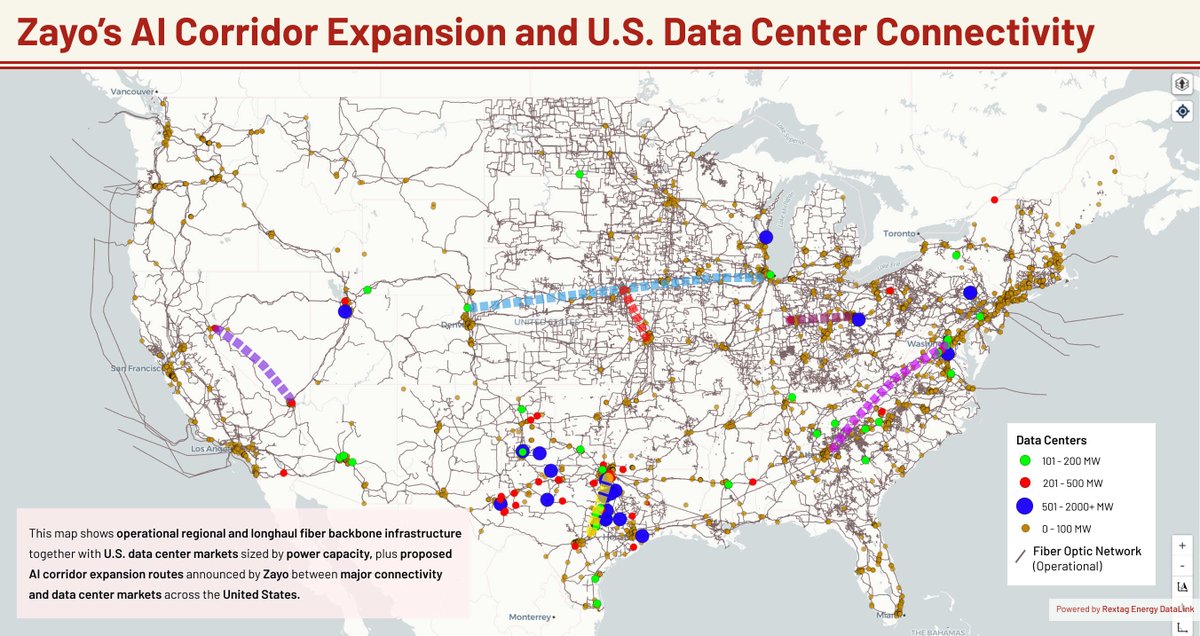
Is AI demand making longhaul fiber planning harder to separate from data center growth?
#Rextag can help teams visualize how new #fiber investment aligns with existing #DataCenters, #cloud regions, and #DigitalInfrastructure corridors.
#Zayo’s latest expansion announcement shows how #AI and #hyperscale demand are reshaping longhaul fiber planning across the United States. The company said it secured an anchor customer agreement supporting more than 5,000 new route miles and overbuilds across major U.S. connectivity corridors.
This #Rextag map shows operational regional and longhaul backbone fiber infrastructure, U.S. data centers sized by power capacity, and the proposed AI-related corridor expansion routes discussed by #Zayo. It gives a clear view of how new fiber investment is clustering around established hyperscale, cloud, and backbone infrastructure markets.
For more information, please visit our Blog:
https://t.co/yQ3MjYVYDp
Can longhaul fiber planning still be separated from where data centers are growing?
Where Williams Is Adding Gas Capacity Across the Northeast
Williams has officially broken ground on the Northeast Supply Enhancement (NESE) project, an expansion of its existing Transco natural gas pipeline system serving the Northeast U.S. The company says the project will add approximately 400,000 dekatherms per day of transportation capacity into one of the country’s most constrained energy markets.
This map shows the broader infrastructure context behind that expansion, including the Transco corridor, nearby compressor stations, and gas-fired power plants across Pennsylvania, New Jersey, and New York. It is a simple way to visualize how the NESE project fits into the larger Northeast supply-to-demand system.
For more information, please visit our Blog: https://t.co/5aSfG7P8a2
Ready to see Rextag’s Energy DataLink in action? Book a live demo with our team and discover how easy it is to turn complex energy data into clear insights: https://t.co/w4aav2u9hQ
#Williams #Transco #NaturalGas #Pipelines #Midstream #Northeast #Infrastructure #Rextag
How T-Mobile Is Expanding Its Fiber Broadband Presence
T-Mobile’s latest broadband expansion move is centered on fiber infrastructure growth through new joint ventures tied to i3 Broadband, GoNetspeed, and Greenlight Networks. Reuters reports the deals are expected to add more than one million additional homes passed across the U.S. fiber market.
This map shows regional fiber routes and nearby data center infrastructure across selected markets tied to that expansion story, especially Illinois, Missouri, and Rhode Island. It is a simple way to visualize the broader digital infrastructure context behind T-Mobile’s growing fiber footprint.
For more information, please visit our Blog: https://t.co/J7ZIAbyS9J
Ready to see Rextag’s Energy DataLink in action? Book a live demo with our team and discover how easy it is to turn complex energy data into clear insights: https://t.co/gwvEFH0PV2
#Telecom #Fiber #Broadband #DataCenters #DigitalInfrastructure #TMobile #Rextag
Why Utah’s 9 GW AI Campus Is Triggering Environmental Pushback
Utah’s proposed Stratos AI data center project is quickly becoming more than just a local development story.
According to The Guardian, the proposed facility near Hansel Valley could require roughly 9 GW of power, more than Utah’s current statewide electricity consumption. Developers said new gas-fired generation connected directly to pipeline infrastructure would help supply the project.
This map places the proposed site inside the broader regional energy network across Utah, Idaho, Wyoming, and Nevada, showing operational natural gas transmission pipelines, compressor stations, gas-fired power plants, and electricity transmission lines surrounding the proposed development area.
It is a useful reminder that hyperscale AI infrastructure increasingly depends on large-scale physical energy infrastructure, not just land availability or fiber connectivity.
For more information, please visit our Blog: https://t.co/yq64sjKVTH
Ready to see Rextag’s Energy DataLink in action? Book a live demo with our team and discover how easy it is to turn complex energy data into clear insights: https://t.co/kSjnh23381
#DataCenters #AIInfrastructure #NaturalGas #PowerInfrastructure #Utah #EnergyInfrastructure #Rextag