Sui just shipped confidential transfers.
Amounts hidden at the protocol level.
Range proofs mask what you send. Supply stays verifiable on-chain. No middleman. No compromise.
Private payments. Zero fees. Tens of billions of transactions.
The build is real.
⚡️SUI LAUNCHES USDsui STABLECOIN TODAY
Sui’s newly launched USDsui stablecoin uses yield from backed assets to buy back and burn SUI tokens or fund DeFi incentives through AMM liquidity.
LATEST: 📈 Two spot Sui ETFs have debuted in the US, with Canary Capital listing SUIS on Nasdaq and Grayscale listing GSUI on NYSE Arca, and both offering staking rewards.
WE HAVE A REGIME SHIFT AT Nowcast IQ
Our nowcast data is now turning decisively pro cyclical, especially in the US, and it rhymes with the thesis we have laid forward on the CapEx cycle getting an extremely large artificial boost from the one big beautiful bill. The CBO estimates a 0.8% impact on GDP this year, but we dare to say already that it is WAAAY too conservative. At the same time, we are seeing inflation through the floor. We are ranging around 0.15% a month in our nowcasts, which is roughly half of what economists pencil in, so even if some people try to claim that softer inflation is priced in, we beg to differ on that view.
So we have gone from a QE like regime with weakish cyclical growth to strong cyclical growth, and liquidity remains very decent, while inflation is moving down. That is what we call a gung ho regime, and it could not get more textbook upbeat. Many of the rotations seen early this year will likely pause given this, and we should see Tech make a comeback.
Here is the text from our trade scanner, and a few charts to support the thesis. ISM Manufacturing is likely heading to 57 to 60 already before summer.
Best data in the world in my opinion!
Free stablecoin movement and invisible private txns are going to be the 2 big pillars driving @SuiNetwork's adoption.
This is how we make crypto consumer ready!
I posted this earlier in the week on @RealVision, but thought it was worth sharing here as well, just to give everyone something to think about.
If you step back and look at the data, something interesting is happening in markets right now…
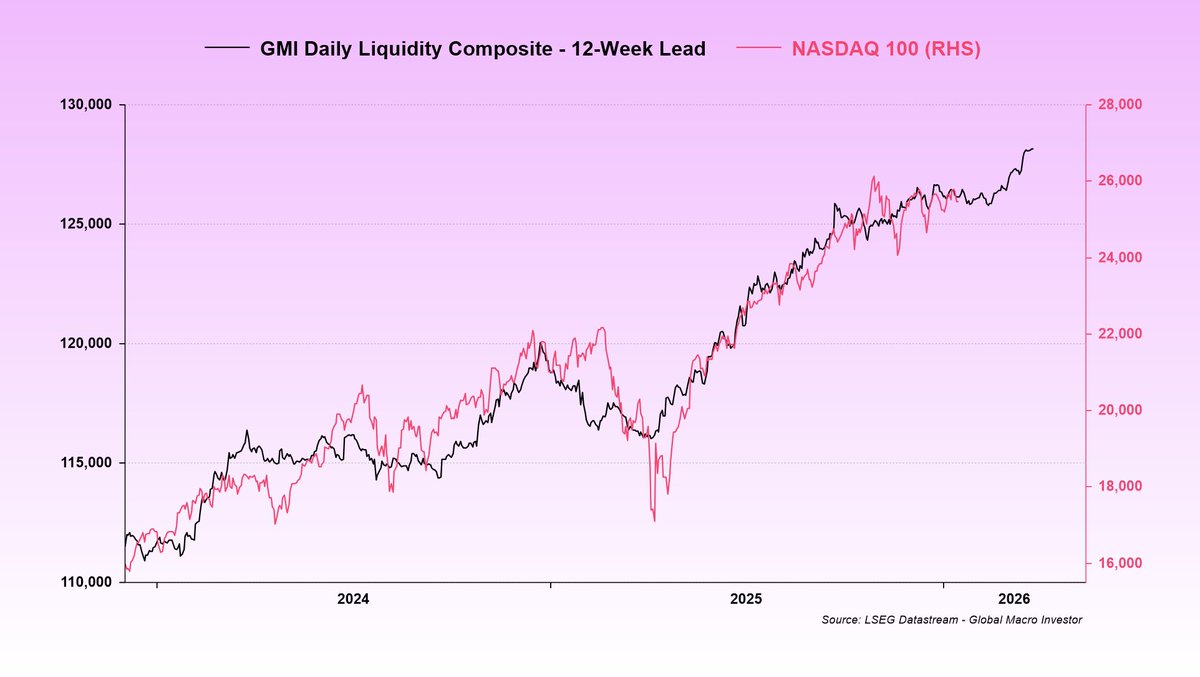
When you line up liquidity with equities, you get this (chart 1).
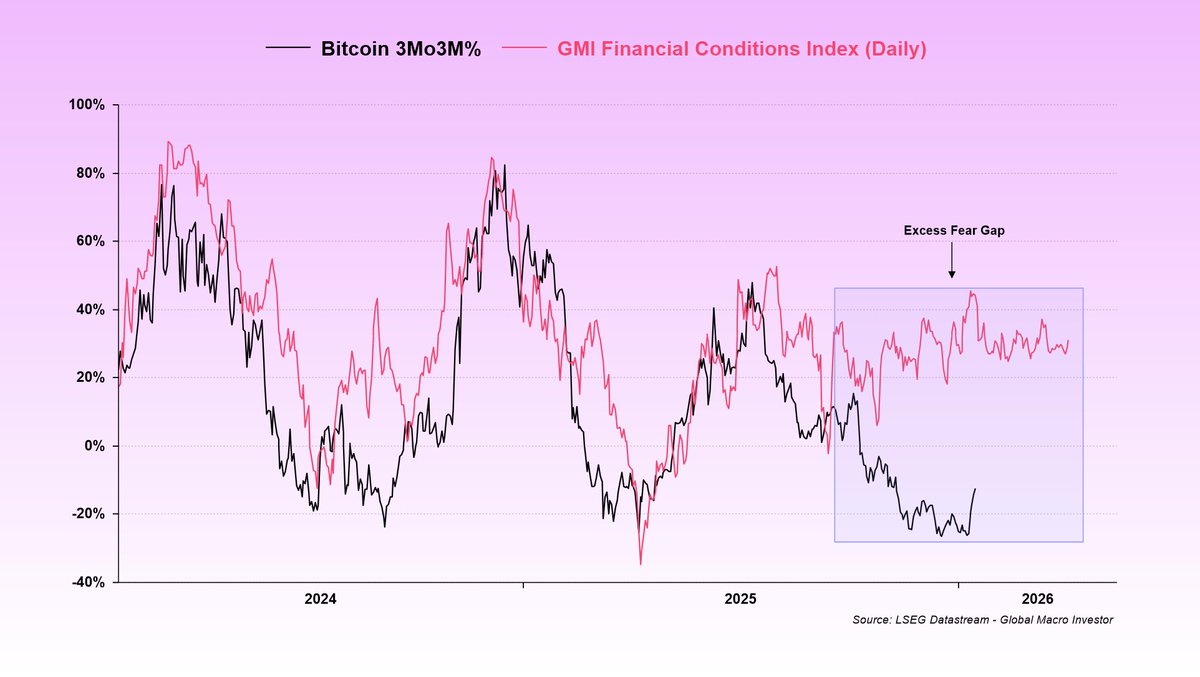
And then compare that with the same liquidity measure versus Bitcoin (chart 2), a simple truth emerges:
Both cannot be right...
Either equities are fundamentally mispricing liquidity despite trading near record highs, or Bitcoin is correctly signaling that the liquidity cycle has already peaked and that risk assets are about to roll over. Only one of these outcomes can ultimately be correct.
Now let’s separate data from opinion for a moment...
The data is clear:
Global liquidity has not yet peaked.
Now to my subjective view…
I think Bitcoin remains the outlier here, and that the events around 10/10 temporarily distorted price discovery, for reasons I’ve discussed at length previously.
Equities, credit, and broader risk assets are behaving exactly as you would expect in a rising liquidity regime. They’re hovering near all-time highs...
Bitcoin, by contrast, is pricing a liquidity peak that the data simply does not support at this stage.
At some point you have to step back and ask:
Is it more likely that one asset is right, or that every other BTC-correlated risk asset is wrong (chart 3)?
If you then layer in broader financial conditions, it stops being about opinion and becomes more about probabilities (chart 4).
What really stands out to me is the sheer magnitude of the “Excess Fear Gaps” that have opened up relative to the macro and liquidity fundamentals.
Right now, the weight of the evidence suggests liquidity is still rising and, in our view, will continue to rise, and that is what risk assets are reflecting.
That means Bitcoin is the anomaly.
What I’ve done here is present the data objectively and my view subjectively.
This is the battlefield for 2026.
The bull versus bear debate comes down to one thing and one thing only:
The direction of global liquidity...