Fineee... I’ll analyze the charts of the coins you recommend
The three with the most likes get posted in 24 hours
Don’t make me wait
Wubba lubba dub dub
Listen up u brainless mortals… burp $ETH got insane potential but that coward Vitalik Buterin is too much of a pussy to ever let it go where it actually deserves. This thing should already be 5x from here. Don’t get it twisted though that don’t mean it’s about to pump. It still has to move with Bitcoin dominance like every other coin in this goddamn multiverse. I wouldn’t trust Vitalik with a single trade, EVEEER
Look at this $TWT 2H chart. This coin is one of my favorites, one of the rare bags I actually hold across every garbage dimension in the multiverse.From the start, the project owners wanted to keep it pinned like a $1 stablecoin. While everyone else was yapping about “utility token,” they were trying to hold the price at that level. And the wallet structure wrecks MetaMask. Anyone still living in that extension dumpster is stuck in 2017. This green corridor is clean. Price action keeps walking inside it. Buy the midline, let it run to the upper band. Simple.But the second Bitcoin slams into the 83-85k zone, I’m hitting shorts. Same loop in every universe: liquidity grab, retail bagholders, then the dump. That’s when #TWT bleeds toward the bottom of the channel
Listen Morty… burp …look at this aster-2:native 2 hour chart, even the dumbest chart trader in the entire multiverse can see it: it’s gathering strength from that 0.66 support and it’s about to fucking blast through the green 0.78 resistance.But when Bitcoin hits the 83-85k zone… that’s when we slam the shorts, cause this market runs the same shitty pump and dump loop in every goddamn dimension. Wubba lubba dub dub, get that short ready u idiot
BURP Alright listen up you smooth brained apes...
Just looked at this $BTC 2H chart and my multi dimensional trading algorithms are screaming the same thing:
We're going long to 83k
Clean liquidity grab, classic stop hunt above the current range
Once we tag 83k... I'm flipping short harder than a portal gun recoil
Target: 74k
That’s where the real blood will be. Retail will be bagholding the top while I sip on some portal fluid and count the gains
83k long → 74k short
Don’t make me repeat myself
Wubba lubba dub dub, bitches
#Bitcoin #TraderRick
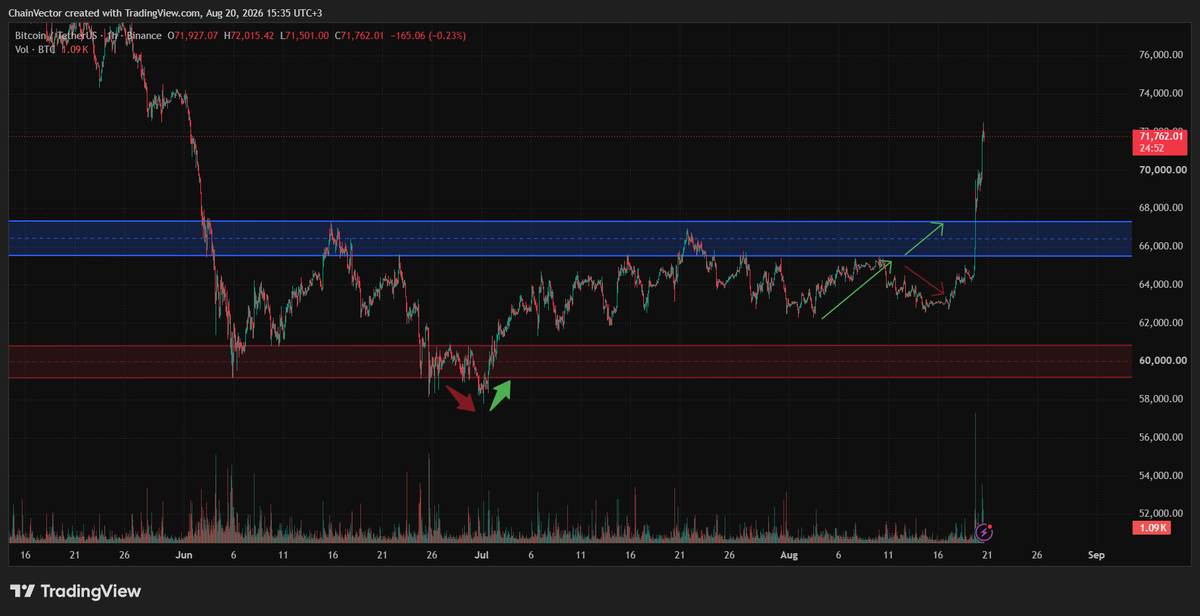
I called this bitcoin:native move weeks ago and it played out exactly as marked.
The red support zone held with the green bounce arrow, the blue resistance got tested and rejected once (red arrow), then price ripped straight through it with the final green arrow. Now sitting at 71.7k after a clean breakout.
What’s your next target from here?
Hey, back again
Remember that January call I made? The structure one that actually played out
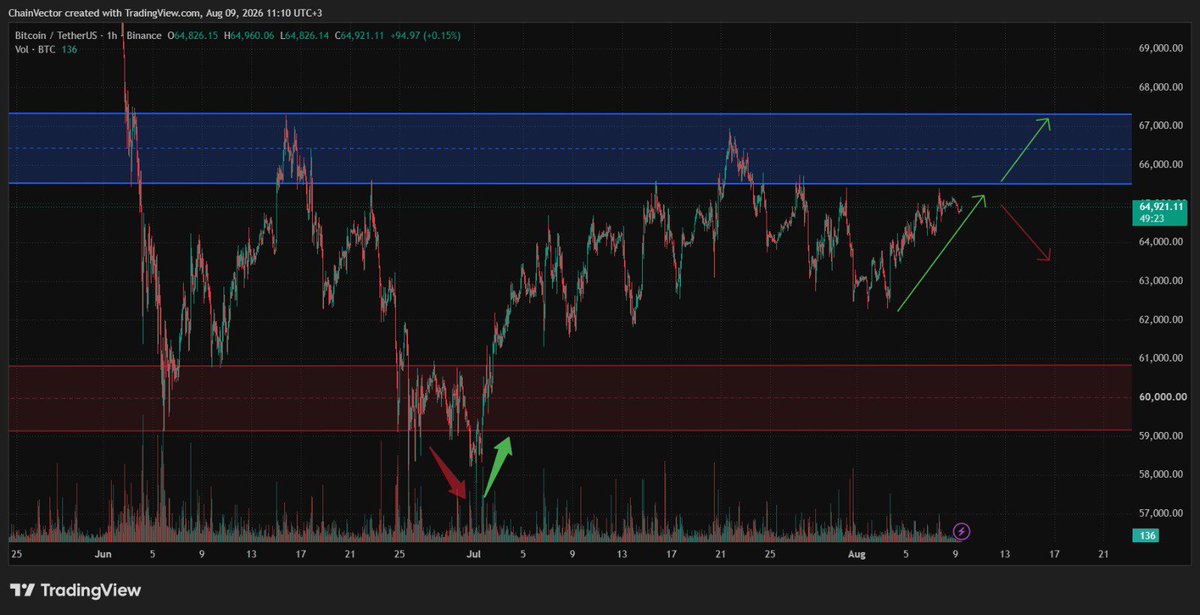
Anyway… looking at BTC on the 1H right now
July had that nice liquidity grab at the bottom, then a clean recovery.
Now we’re just chilling under the 66-67k zone
Kinda curious what happens next
Break higher or another rejection?
Just sitting here watching the range
Anyone else looking at the same thing?
In 2016 the total crypto market cap was just a few billion dollars… today it’s $3.68 TRILLION!
From 2016 to 2024 it delivered a mind-blowing +100% CAGR (compound annual growth rate) one of the wildest asset classes in history.
Comparison:
• 2016* → $BTC $8.9B | $ETH $0.08B | Stablecoins $0.02B | Others $1B
• Dec 8, 2024 → BTC $1.98T | ETH $481B | Stablecoins $194B | Others $1.02T
A market that grew ~400x in just 8 years…
Legends, in which year did you buy your first crypto?
When examining $BTC annual price data since 2010, the asset that began at $0.06 reached an all time high of $108,268 in 2024. However, the sharp declines in 2018, 2022 and 2025, together with the $57,747 low recorded in 2026, clearly show that elevated volatility remains a defining characteristic.
Does this table more strongly highlight Bitcoin’s long term appreciation potential or its structural risks?
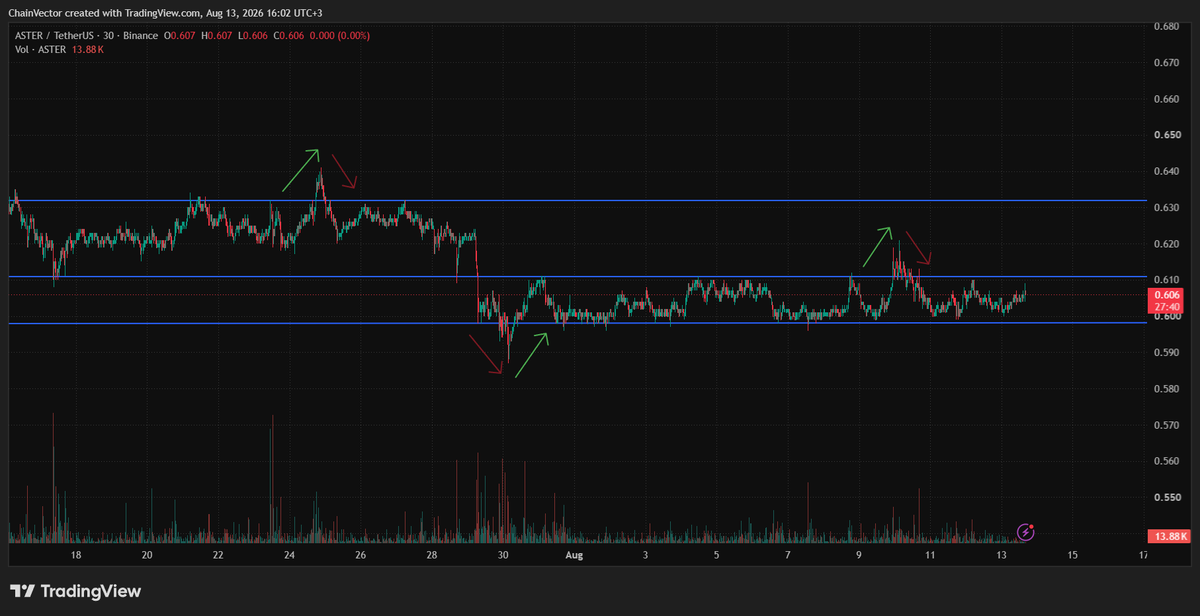
If you’re not staring at this aster-2:native chart right now, you’re about to miss a pure textbook trap. 30 min timeframe: every green arrow drives hard into resistance and gets slammed by the red rejection arrow.
Every red arrow dumps into support and gets ripped higher by the green bounce arrow. The three blue horizontal levels have acted as perfect support and resistance the whole way. Price just got rejected cold at 0.620 and is now sitting dead on the 0.600 line.
Long the bounce or short the breakdown which side are you on?
ethereum:native 1H
Clear range defined between:
- Supply: 1950-1980 (green zone)
- Demand: 1820-1850 (red zone)
Price currently mid range, approaching the upper boundary again
Key levels to watch:
- Acceptance above 1950 opens higher targets
- Rejection here likely sends price back toward the lower demand zone
Structure remains range bound until we get clear displacement
$SOL 2H
76-77 horizontal zone acting as clear multi-touch structure
(see reactions labeled 6-7-8-9)
Price currently testing the same level again after the June liquidation low
Volume compression visible , range is tightening
Key decision point:
- Clean break & acceptance above 77 opens room toward previous swing highs
- Rejection here keeps the lower range structure intact
Watching for displacement or another liquidity sweep from this zone
@Jeremybtc By this logic, February was the best month for investing until two years ago, but if we had gone long in the last two Februarys based on this chart, we would be broke right now