On the BTC 10:00 Suppression Claim: What the Data Shows — and What It Cannot
There's a claim circulating that recurring 10:00 a.m. ET Bitcoin sell-offs prove deliberate price suppression by an ETF participant. The clustering is real. What it means is another matter.
Observable timing patterns don't reveal who initiated selling or whether flows were directional or hedging-related. Structural fragility and incentive-aligned behavior can generate identical charts.
The relevant test is whether clustering persists when leverage, funding, and liquidity conditions are neutral. Without transparency around positioning, price patterns alone cannot resolve intent.
Full analysis: https://t.co/em2pemzl94
📊 $KAS/USD im Fokus – Chart-Analyse mit TPM, LPPLCP, Pill & SCO (@complextrad)
Aktuell erscheinen wieder viele $KAS Tweets mit zweifelhaften Prognosen. Ich will hier auch mal meine Gedanken zur Situation darlegen.
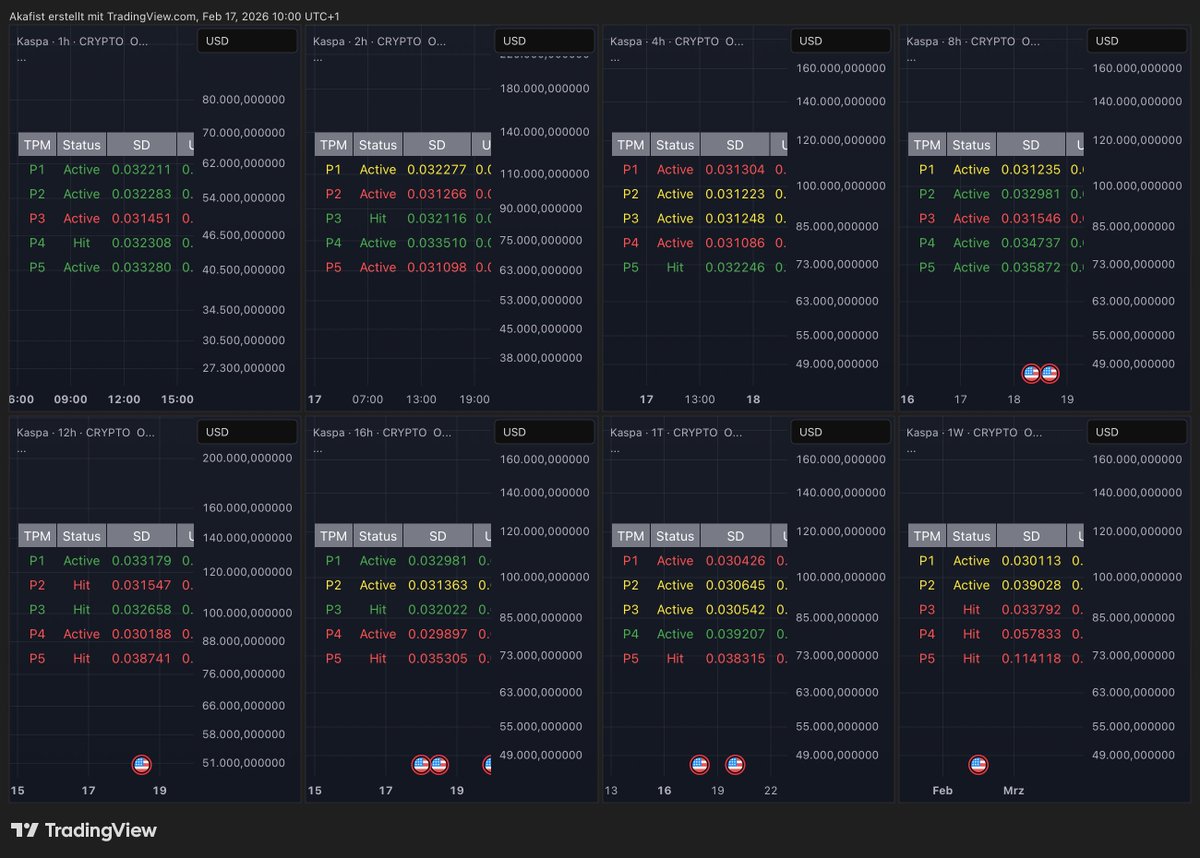
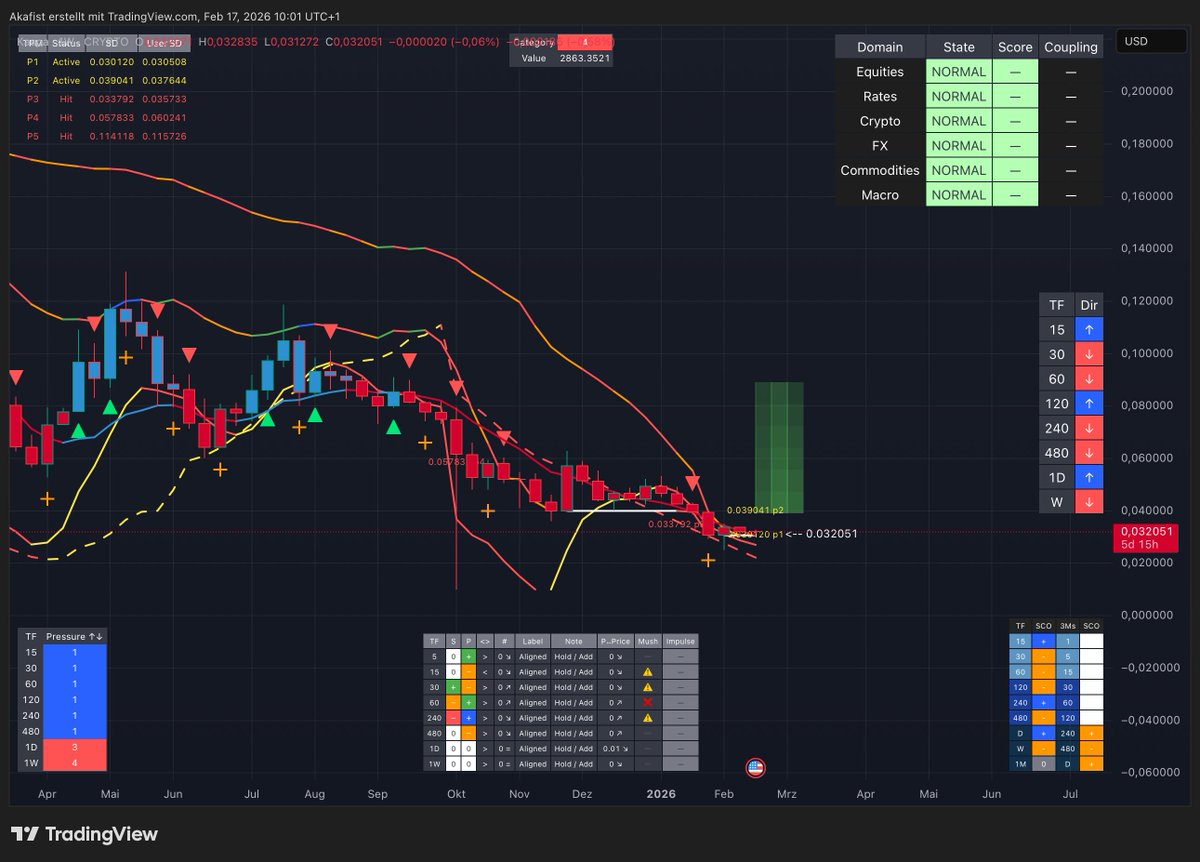
Es etabliert sich bei $KAS eine Seitwärtsrange zwischen ungefähr 0,029–0,039 USD. TPM (rechter Screenshot) identifiziert in diesem Korridor ausgeprägte strukturelle Anziehungszonen – Preisbereiche mit erhöhter Aufenthaltswahrscheinlichkeit. Technisch betrachtet entsteht hier ein potenzielles Cluster mit noch anhaltender kurz-/mittelfristiger Volatilität.
LPPLCP (unten mittig, linker/mittlerer Screenshot) signalisiert im Tageschart eine Erschöpfungsphase (weiß). Das spricht für eine mögliche Transition. Im Wochenchart verliert der Abwärtstrend an Impuls: Die dynamische Komponente flacht ab, während die statische Struktur noch bärische Tendenzen zeigt. Diese hat sich noch nicht vollständig in die Phase der Erschöpfung aufgelöst. In niedrigeren Timeframes dominiert hingegen immer wieder Unentschlossenheit – was zu den TPM Cluster passt. Der Markt ist aktuell noch unentschlossen, aber erschöpft sich auf dem Wochenchart. Nach der Erschöpfungsphase können neue Impulse beobachtet werden, wohin die Reise noch gehen wird. TPM gibt aber einen Ausblick, indem es langfristig wieder Richtung 4 Cent gehen könnte.
PILL (rot-blaue Linie) zeigt an, dass der Preis aktuell wie die zugrundeliegende Struktur noch keine eindeutige Richtung aufweist. Sobald sich der Markt aber strukturell bereinigt und für eine neue Richtung entschieden hat, wird der PILL und letztlich auch der Preis folgen.
SCO (gelb-orange Linie) hat eine Phase erhöhter struktureller Einstimmigkeit abgeschlossen und wechselt die Phasen, was die situative Unentschlossenheit im Markt unterstreicht; die geglättete Ableitung (gestrichelte Linie) deutet jedoch auf beginnendes zart-positive Momentum hin.
Der Pressure Cooker (unten links) bleibt negativ – Restspannung ist vorhanden. Dennoch konvergieren die Modelle zunehmend. Das erhöht die Wahrscheinlichkeit, dass die laufende Kompression in eine nach oben gerichtete Expansion übergeht.
Im relativen Vergleich zu $BTC – das sich weiterhin in einer mehrmonatigen Korrekturstruktur mit tieferliegenden TPM Zonen bewegt – zeigt $KAS aktuell eine bemerkenswerte Robustheit nach einer rund zweijährigen Korrekturphase. Insgesamt schwächen sich die bärischen Signale auf den höheren Zeitebenen ab.
Manche schreiben, dass es weiter runter Richtung 1 Cent gehen wird. Das lässt sich aktuell strukturell nicht erkennen. Zumal ein ultra langfristiger TPM Attraktor (3 Monatschart) bei 1,5 Cent angezeigt und am 10.10.25 auch abgeholt wurde. #KAS
Here is a preview of my current Macro analysis (that I will post as an article in few days).
Gold bottomed in mid-2000 at around $280. From that trough to today’s price near $4,800, gold is up roughly 17–18× over about 25 years. That corresponds to an annualized growth rate of ~12%.
My thesis is that gold has largely been catching up to inflation over this period. In other words, the “real” long-term inflation rate embedded in the gold price has been closer to ~12% annually, far above the official CPI numbers.
If that’s correct, then gold is not entering some new super-cycle of real growth — it is mostly repricing past monetary debasement. Either inflation has been massively understated for decades, or gold is now significantly overvalued relative to its historical role as an inflation hedge.
In both cases, the upside for gold from here is structurally limited. A further 2–3× move would already imply an extreme inflation regime; a 10× move would require something close to a breakdown of the monetary system. That’s not a base-case scenario.
Once the current “safe haven” enthusiasm for gold fades, capital is likely to rotate back toward assets with genuine long-term real growth potential. Bitcoin, as a provably scarce, reflexive, and adoption-driven network asset, offers a far superior asymmetric upside than gold or any traditional store-of-value asset.
Read this excellent post below.
We are in a long-term currency crisis moving inexorably toward an historical resolution, over decades, especially next two.
Why next two?
Because 2 trillion * (37/17)^5.74 ~ $174 trillion, > current global M2
Demographic collapse, debt burdens, asset holders grow >> wage, debt slaves
Fortunately there is Bitcoin. Embrace the volatility.
The BTC narrative that “the 4-year cycle is dead” misunderstands structure. Bitcoin still tracks a long-term power-law trend. What’s changed is internal: LPPL dynamics, gamma flows, macro reflexivity. Not collapse, just complexity. No Lévy rupture. Same system, more dimensions.
⚪ 🟢 🔵 🟢 🔵 🔴 🟢 🟢 🔵 🔴 🟢 🟢 🔵 🔴 🟢 🟢 🔴 🟢 🔵
⚪ Network value grew prior to price discovery
🟢 Up
🔵 Major bubble years (first 3 fundamental mode, 4th was harmonic)
🔴 Down
Projecting only for 2026, 2027.
https://t.co/uP66rIOmNZ
🪙Weekend Cash Machine Low To High Volatility Harvested 💸
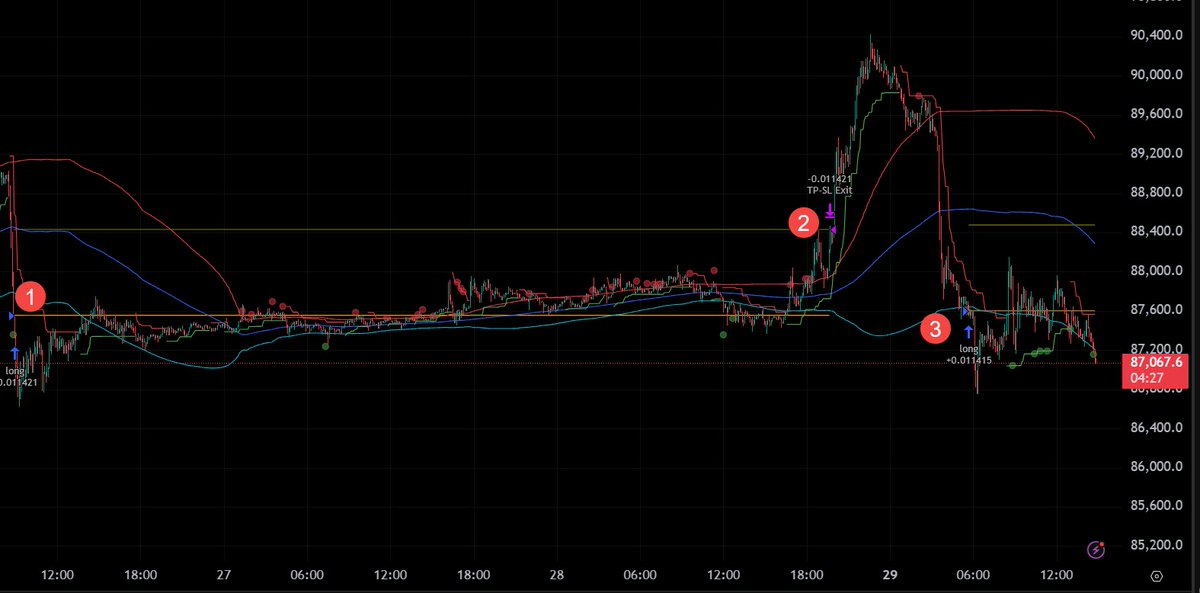
Last Friday at the U.S. Open, the Market erased a low-volume Asia rally, liquidating trapped long trader positions. The Alog opened long positions buying from the Long Traders who were forced to sell low at a loss due to liquidation. The Algo's long position was held over the weekend as Market Makers and low trading volume kept the market in a low volatility, tight range, building up exit liquidity. Late Sunday, the market moved higher on the Asia session, and the Alog took profits, selling to forced buyer Shorts who were liquidated. This morning on the US session like last week, Market Makers reversed the market, erasing all the gains and liquidating the weekend-long liquidity in the process (The Algo opened up a new long position from the forced long sellers).
1. Long Position Entry Over The Weekend - Longs Liquidated Forced To Sell Low, The Algo Entered
2. Long Position Exit - Shorts Liquidated Force To Buy High, The ALog Exited Took Profit
3. Long Position ReEntry on Market Reversal - Alog Entered
📈The Tight Range Liquidity Is a Bomb Waiting To Explode!💣
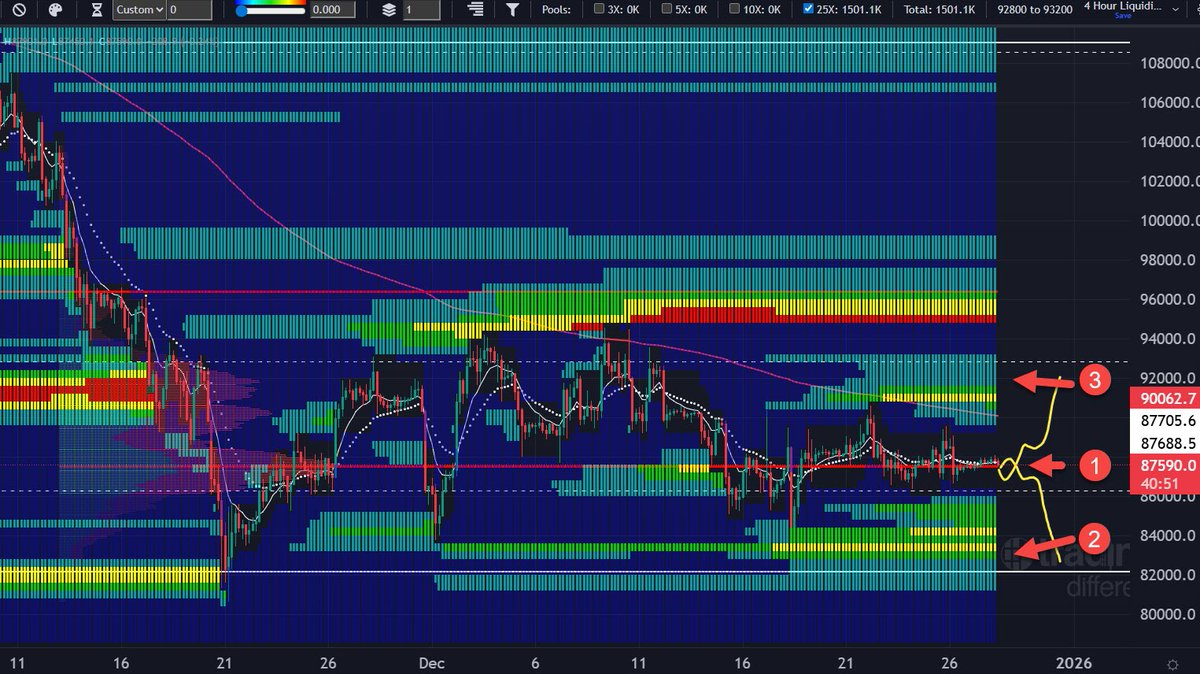
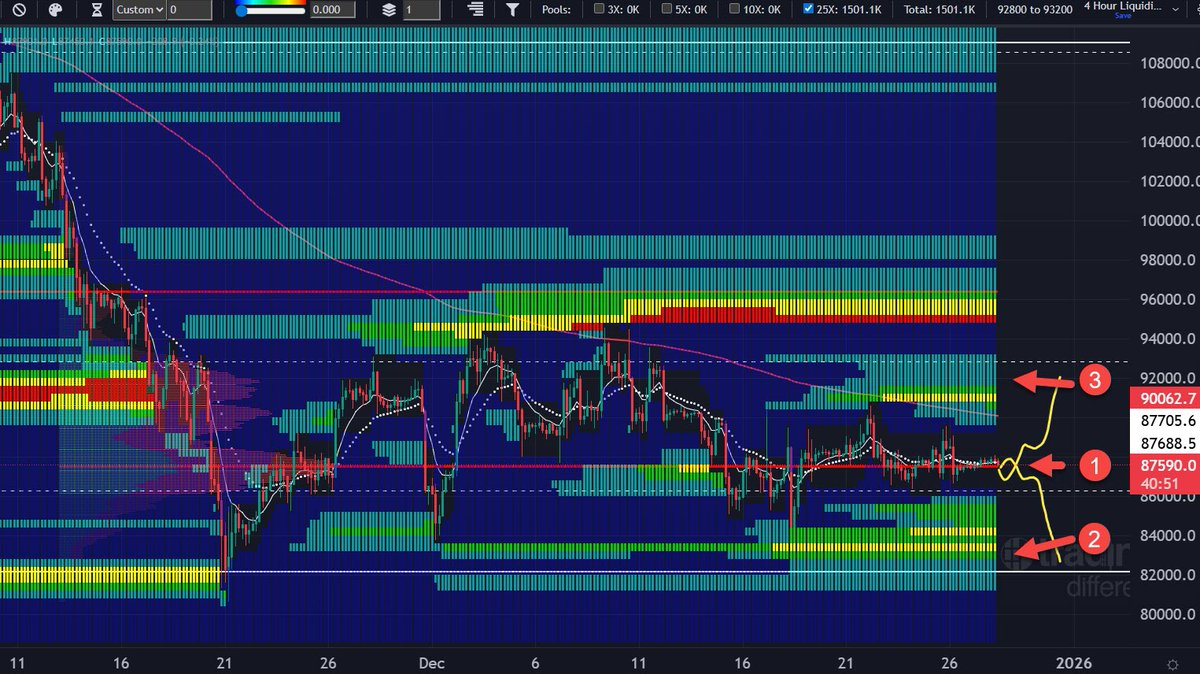
Price has been consolidating all Holiday and is firmly attached to the POC of the Local Value Area at 88k. As you can see there is literally a ton of liquidity tightly packed above and below the POC, poised like gunpowder waiting for a spark to ignite it. I'm expecting a big move incoming and volatility to increase considerably in the next 24-48 hours. The long side 25x liquidity is External and the Short side 25x liquidity is Internal to the local Value Area. This means the probabilities are more in favor of liquidating the Shorts first but we will have to wait and see.
1. Price Tight And Condensed on the POC at 88k
2. Massive External 25x Long Liquidity Pool
3. Massive Internal 25x Short Liquidity Pool
As for trading this opportunity, my MR bots will eat well in either scenario, and I have Limit orders at the bottom of the 25x long at 81.5 and a plethora of Hedge OTM options strangle contracts at the VAH and VAL of the range that I will roll out in profit in either scenario.
📈Big Move Incoming? Volatility Expected To Increase💥
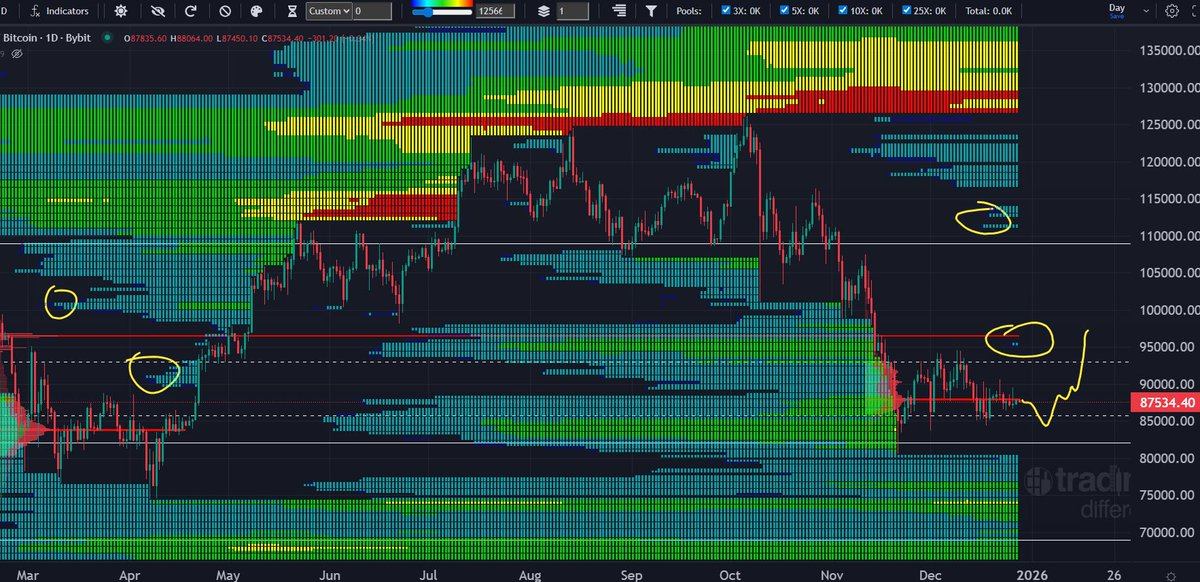
After trading sideways for most of the holidays he market is in an extreme level of consolidation and low volatility compression. The current price is anchored to the POC at 88k os the local Value Range and is building up energy for a big expected move early next week. One key observation is the internal liquidity starting to build up, and price action volatility will is necessary to build that liquidity.
📈Tight Range Liquidity Is a Bomb Waiting To Explode!💣
Price has been consolidating all Holiday and is firmly attached to the POC of the Local Value Area at 88k As you can see, there is literally a ton of liquidity tightly packed above and below the POC poised like gunpowder waiting for a spark to ignite it. I'm expecting a big move incoming and volatility to increase considerably in the next 24-48 hours. The long side 25x liquidity is external, and the Short side 25x liquidity is Internal to the local Value Area. This means the probabilities are more in favor of liquidating the Shorts first but we will have to wait and see.
Price Tight And Condensed on the POC at 88k
Massive External 25x Long Liquidity Pool
Massive Internal 25x Short Liquidity Pool
As for trading this opportunity, my MR bots will eat well in either scenario, and I have Limit orders at the bottom of the 25x long at 81.5 and a plethora of Hedge OTM options strangle contracts at the VAH and VAL of the range that I will roll out in profit in either scenario.
📈Big Move Incoming? Volatility Expected To Increase 💥
After trading sideways for most of the holidays, the market is in an extreme level of consolidation and low volatility compression. The current price is anchored to the POC at 88k os the local Value Range and is building up energy for a big expected move early next week. One key observation is that the internal liquidity is starting to build up, and price action volatility will be necessary to build that liquidity.