Hurricane Patricia Reanalysis — Was the Historic Peak Even Stronger?
This continues the Category 5 series (Eastern Pacific in this case) with a very thorough analysis of all available data to determine the best single intensity estimate.
Official NHC (TCR) — 23 October 2015
Winds: 185 kt (215 mph)
Pressure: 872 mb
Location: Eastern Pacific (southwest of Manzanillo, Mexico)
WxProbe Reanalysis:
MSW: 190 kt
MSLP: 872 mb
Reconnaissance
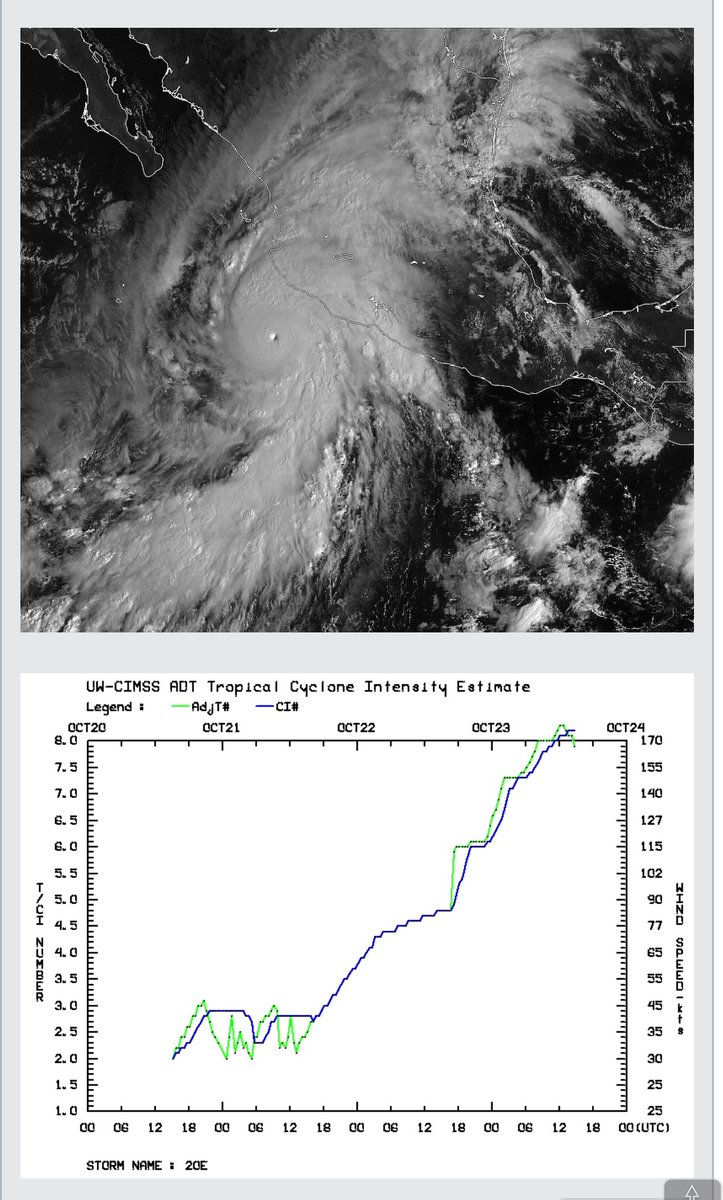
Patricia’s absolute peak intensity occurred during an 11-hour reconnaissance gap. During that interval, the satellite presentation (ADT CI) continued to improve through 1200Z. Here’s the pertinent data:
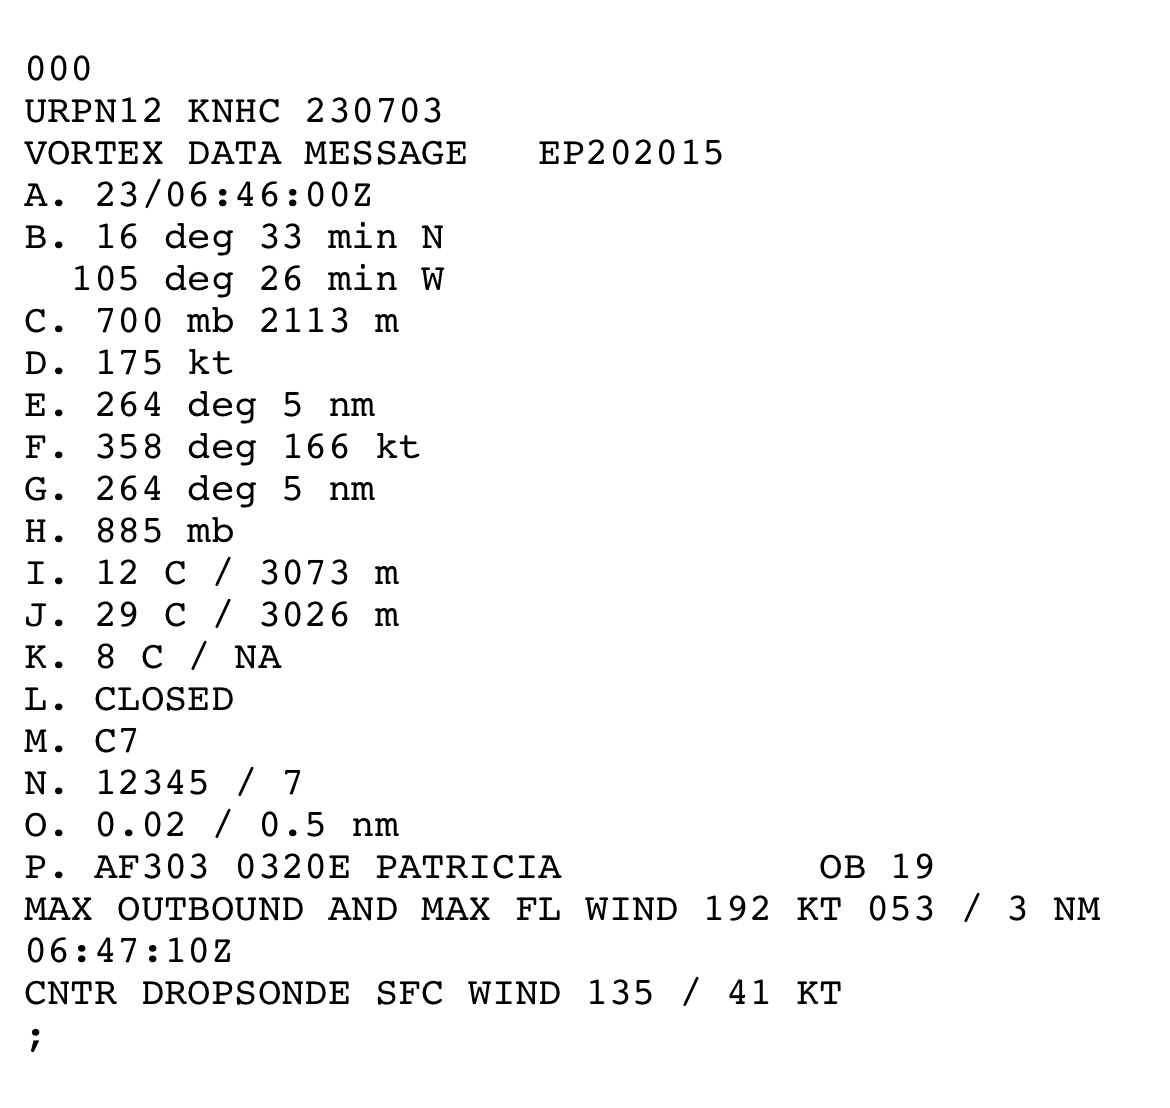
0446Z AF303: 894 mb raw (center sonde 25 kt → adjusted to 891 mb), max flight-level wind of 179 kt at 4 n mi.
0646Z AF303: 885 mb raw (center sonde treated as 57 kt in TCR → adjusted 879 mb), max flight-level wind of 192 kt at 3 n mi (including 1-second spike of 201 kt). Real-time SFMR of 182 kt; post-processed SFMR peaks to 187 kt (Henning et al. 2016; Klotz reanalysis). RMW contracted to 3 n mi.
The aircraft departed while the storm was still deepening. These are the respective observations when recon next sampled the core:
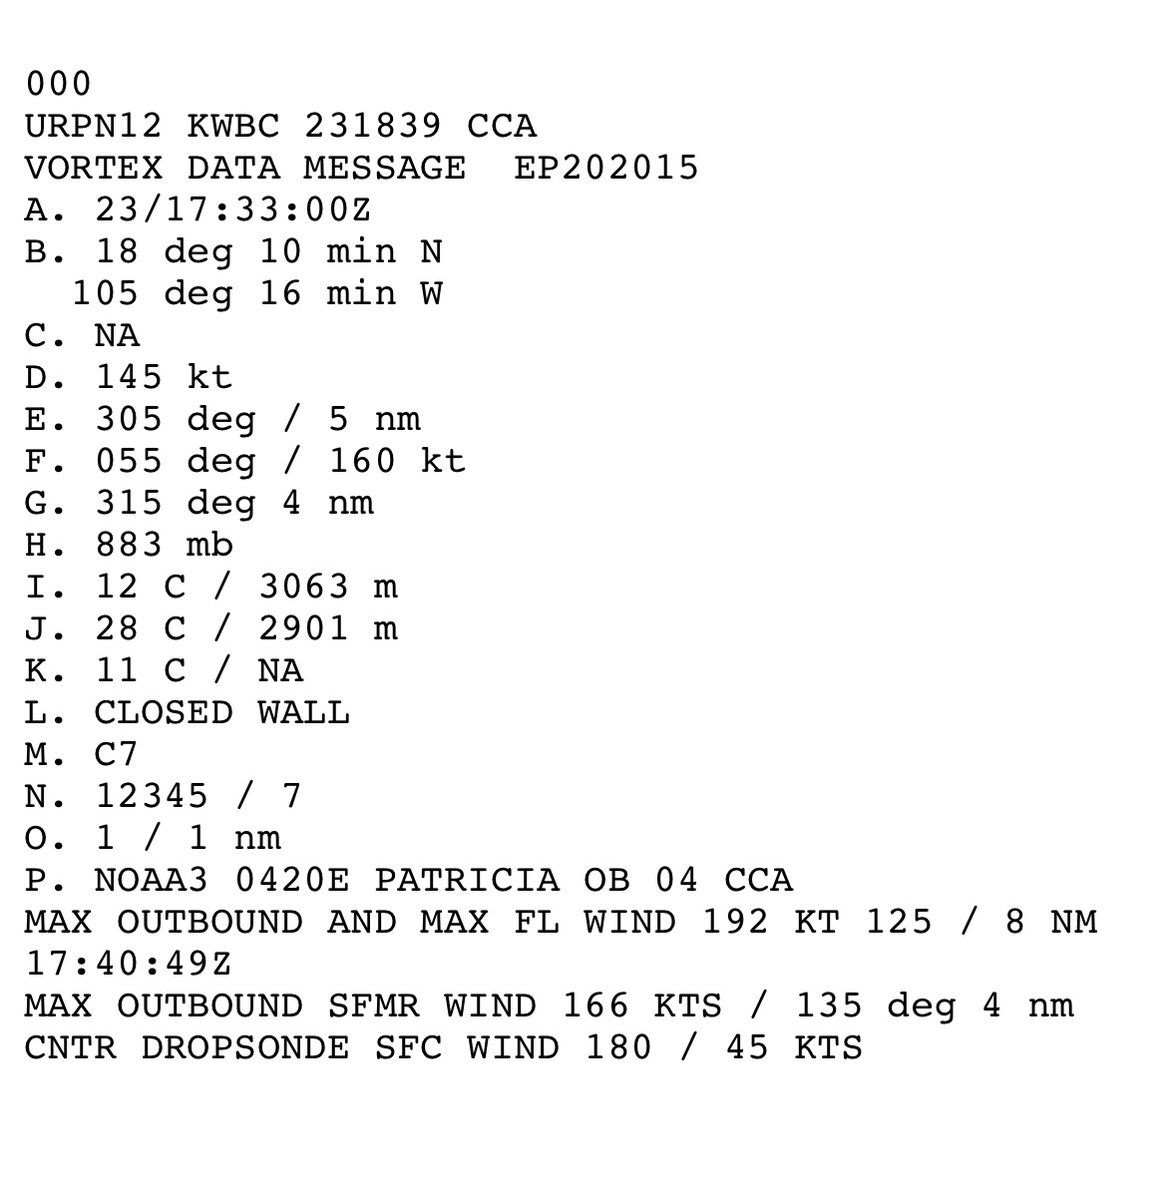
1733Z NOAA3: max flight-level wind was still 192 kt at 8 n mi (VDM; secondary summaries list 191 kt), operational SFMR 166 kt revised to 180 kt after HRD brightness-temperature reprocessing, pressure already higher (VDM at 883 mb with 45 kt → adjusted to 878 mb). Early ERC signatures present.
2044Z: 910 mb with 68 kt → adjusted to 903 mb; flight-level wind of 160 kt. Rapid filling well underway.
The observed rates while aircraft were present taking into consideration the estimated lowest pressure of 872 mb at 1200Z:
* 0446Z–0646Z (2 h): pressure −6 mb/hr, flight-level wind +6.5 kt/hr, RMW 4 to 3 n mi.
* 1200Z–1733Z (5.55 h): pressure +1.1 mb/hr (872 → 878 mb).
* 1733Z–2044Z (3.2 h): 8 mb/hr filling rate once ERC matured.
Pressure
Adjusted pressure at the 192 kt pass was 879 mb. The satellite organization continued to improve until 1200Z. A moderated continuation of the pre-gap −6 mb/hr rate (1.3 mb/hr, which is 22% of the observed rate) across the 5.2 hour gap produces 872 mb at 1200Z. This connects directly to the next observation: 872 mb → 878 mb at 1733Z = +1.1 mb/hr, matching the precisely calculated slow initial filling rate. Anything deeper than 872 mb is possible, but not assured.
Structure
As shown above, the RMW contracted to an astoundingly small 3 n mi at the 192 kt maximum (pinhole). In addition,
mean of the nonzero R34 was compact at 110 n mi, with hurricane-force winds only to 15–16 n mi from the center.
Single wall at peak. No size veto required.
Reduction Factor
A radius of maximum wind of ≤ 5 n mi and pressure below 900 mb support the 0.95 bin (Powell et al. 2009; Patricia SFMR-to-flight-level ratios of 0.95). Patricia’s values were obviously well-below those thresholds.
Flight-level interpolation (single undersample step):
Pre-gap rate was +6.5 kt/hr. A continuation of *only* +1.2 kt/hr (18% of the observed rate) for 5.2 hours = +6 kt. This translates as
192 kt → 198 kt at 1200Z.
Return leg: 198 kt → 192 kt at 1733Z = −1.1 k/hr, consistent with the +1.1 mb/h slow filling while the flight-level wind remained at 192 kt.
These equate to 198 kt × 0.95 = 188 kt → 190 kt, constrained by the measured SFMR values already in the 180–187 kt range. The undersample step is counted once via the interpolation, and 198 kt is the conservative end of that single step. I’ll add that the 192 kt /187 kt pair (ratio of 0.97) and other observed SFMR-to-flight-level ratios near 0.94–0.95 indicate that a higher combination — 202 kt flight-level with a 0.96 factor — would yield 195 kt. This remains a possible high-end, but is not assured. Without direct sampling in the peak window, it isn’t an advisable choice under the methodology, which caps the factor at 0.95 and publishes the conservative single-step result.
Pressure Check
KCZ on 872 mb and the compact R34 is consistent with the upper end of the observed range.
Final Estimate:
MSW: 190 kt (220 mph)
MSLP: 872 mb
RMW: 3 n mi
Time: 1200 UTC 23 October 2015
That is a 5 kt revision of the official wind, while pressure remains unchanged. This further solidifies Patricia’s place as containing the most extreme intensity ever reliably measured in a tropical cyclone, worldwide.
Framework Notes
The flight-level-to-surface factor is selected by the radius of the sampled wind maximum, with pressure and outer size able to veto that first guess. In the most compact cores (RMW ≤ 5 n mi and pressure under 900 mb), the factor can reach 0.95. This ceiling is supported by Powell et al. (2009) and by the Patricia 2015 observations themselves (Rogers et al. 2017; Henning et al. 2016; NHC TCR), where SFMR-to-flight-level ratios reached 0.95. The operational mean remains at 0.90 (Franklin et al. 2003). A small RMW does not justify the highest factors if the mean of the nonzero R34 quadrants is on the order of 140 n mi, or an outer eyewall is active. An undersample of peak intensity is counted once only. Knaff–Zehr–Courtney (KZC) is used as a consistency check. The hour is assigned to the locked apex pair.
Sources: NHC TCR (Kimberlain et al. 2016); Henning et al. (2016) AMS preprint; Rogers et al. (2017) BAMS; HRD SFMR reprocessing (Klotz); vortex data messages 0446Z, 0646Z, 1733Z, 2033Z.
Typhoon Nora (1973)
Peak intensity: 185kts/873mb
Early NOAA reports re-updated intensity, one common recon point was 877mb was observed not even in the centre of the eye. The storm was about as perfect MPI as it gets, one of 5 185kts TCs.
Wild to see #Champi's eyewall evolve from a high-wavenumber state during its RI phase to something more steady in the last hour as it passes Guam to the south.
Figured I'd back this up more:
Empirical dropsonde studies (such as: https://t.co/k8NCa6WLZM) show that in extreme wind environments (>120 knots), the boundary layer becomes heavily mixed by severe mechanical turbulence. Consequently, the reduction factor can dynamically shift closer to 0.90, meaning a greater fraction of the mid-level momentum is actively transported down to the surface. Granted the reading would be close, both dropsondes show a rather steep mixing from mid level to surface, meaning that standard extrapolation may underestimate winds in this specific scenario- especially considering downward vertical advection of horizontal momentum as it scrapes a rather topographically elevated coastline.
Built a hurricane recon game! Fly a WP-3D or WC-130J into Hurricane Isaias, Katrina, and more.
Punch the eyewall, drop sondes, score points. Real recon data and real Skew-Ts on the drops, plus a leaderboard.
Link below:👇
Look! The ash plume from Taal Volcano’s eruption this evening was momentarily streaked with volcanic lightning, as recorded by the Buco (VTBC) and Calauit (VTCT) observation stations of Taal Volcano Network.
#TaalVolcano
https://t.co/qMxzqIYL9f
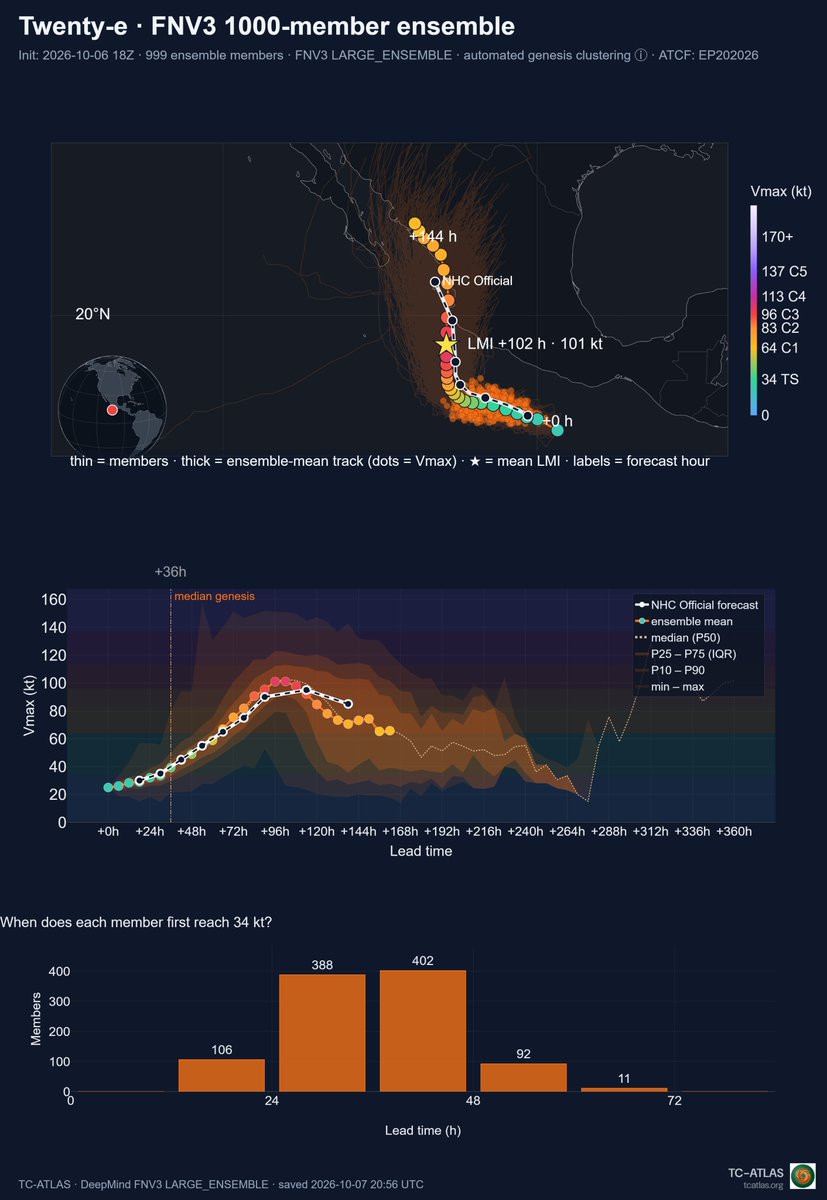
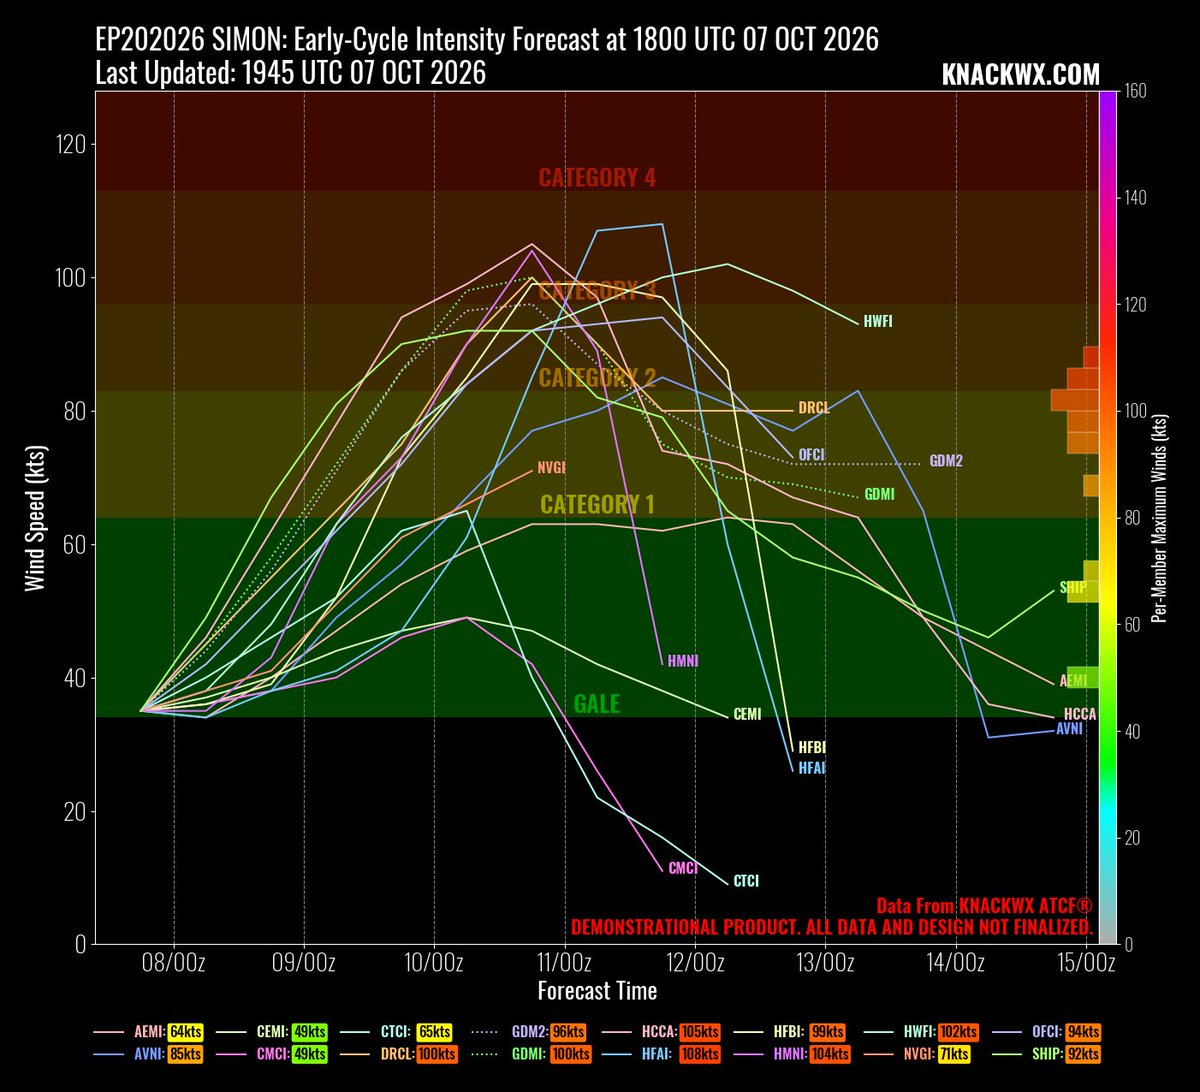
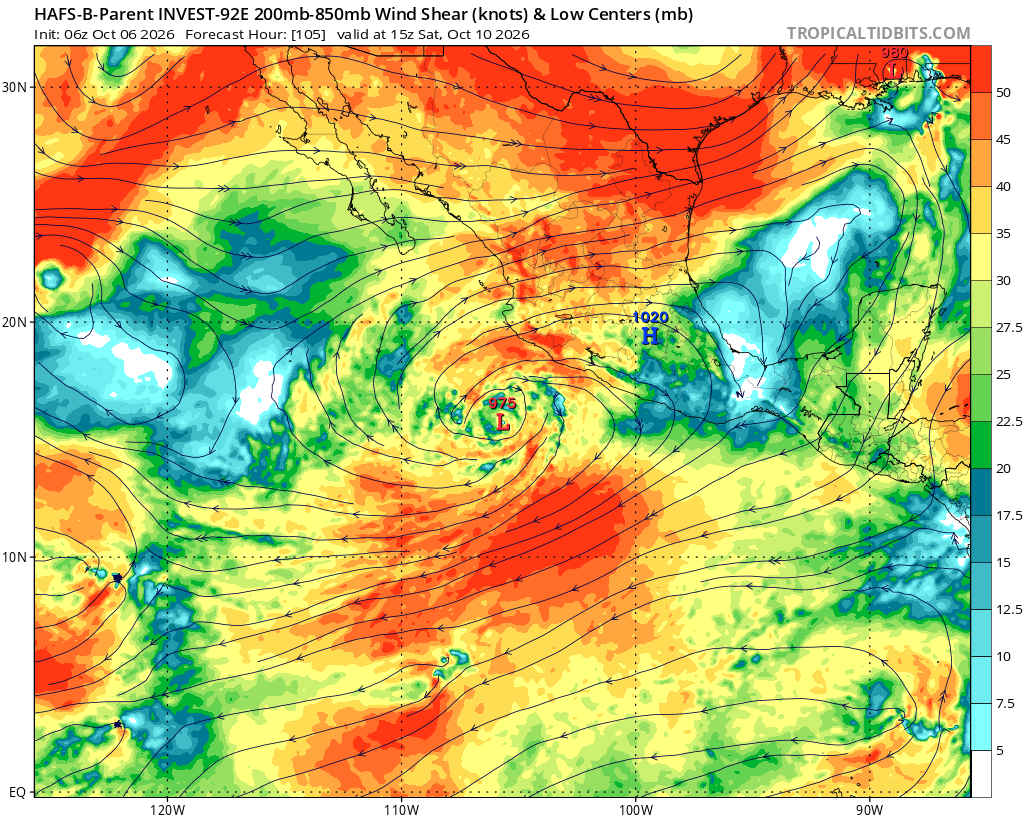
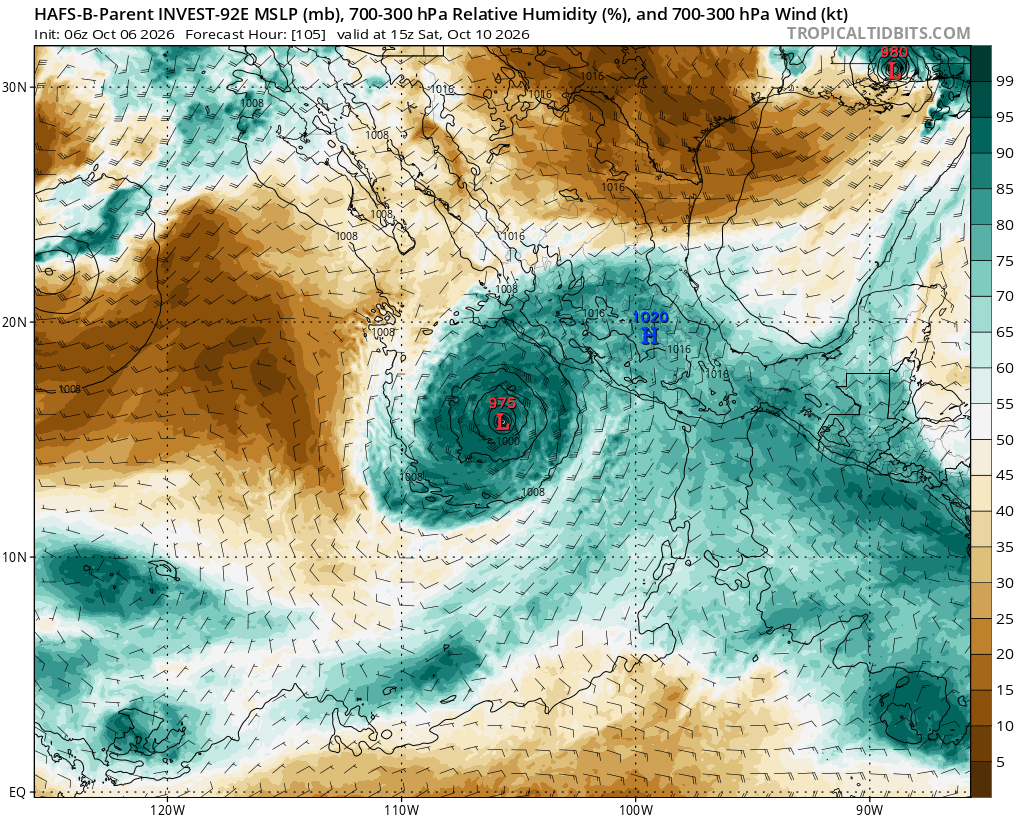
Confidence continues to increase that Simon should become a major hurricane. Most skillfull physics based guides and nearly all GDM ensemble members show this. A major landfall also seems incraesingly likely but there continues to be quite a large spraed in depicted locations
Simon's ceiling will be very high
couldn't ask for a more perfect shear/outflow setup and dry air doesn't look like an issue
Very similar to what happened with Polo but the SSTs are a bit lower (30/31C with Polo, 28/29C now) so that will likely limit the intensity
@BigJoeBastardi Been tracking storms for possible Impacts in California (and ignoring the real implications outside) might be the most nonsense job to do.
@JaydonShawwx Google deep mind shows something after future Simon, so possibly another system could form, after that maybe is over and by then at least 300 ACE is sure.