In 2023, Bitcoin needed just under 7 days from the first major breakout above the red TEM zone to the first touch of the light-yellow TEM line.
16 hours after that first touch of the yellow line, there was one last, very tight pump into the orange TEM zone, just barely above it.
From the touch of the yellow line to the next low, 3 days and 8 hours passed.
The same scenario is repeating now.
From the large wick outside the red TEM zone to the touch of the yellow TEM line, exactly 7 days passed.
If the pattern repeats on the LTF, we could expect at most one more wick above the orange zone, roughly between $84,600 and $85,600.
Measured from the yellow-line touch, Bitcoin should find its next low within 3 days and 8 hours.
That date falls on October 1 and therefore still fits my view as well as the 3D timeframe outlook.
bitcoin:native
The last two giveaways are done!
Time for a third one and this time it’s different.
When I hit 35,000 followers, I’ll give away $3,500 to 35 people ($100 each).
To enter, you need to comment, like, and share this post, and Grok will select the winners!
Thank you for the incredible support!
EDUCATION ONLY, NFA!
Welcome to XAPA's World!
https://t.co/6atyr1dSg7
I’ve shown this pattern many times from different angles. Today, for the first time, it really hit me how insanely precise the percentage moves repeat on a weekly basis.
This time without any indicators, purely from the UTXO Cross perspective.
Measured from the TEM wick, Bitcoin put in a 36% pump between day 210 and 224.
November $100,000+ if Bitcoin keeps repeating it the same way it has until now.
holy bull.. 🐂
In June 2022, Bitcoin found its first low, only to form almost its final low 147 days later (on the weekly chart). At that time we were still in the Corona pandemic. Bitcoin fell by a maximum of 0.68% within two weeks to reach its "final" bottom.
On November 9, 2022, the UTXO age bands cross occurred, a signal that has historically always predicted Bitcoin’s final bottom.
After the final bottom we could observe Bitcoin moving sideways to the upside for three weeks, followed by three weeks of sideways movement to the downside. However, the bottom had already been formed.
After these three weeks the Bitcoin bull run began.
bitcoin:native
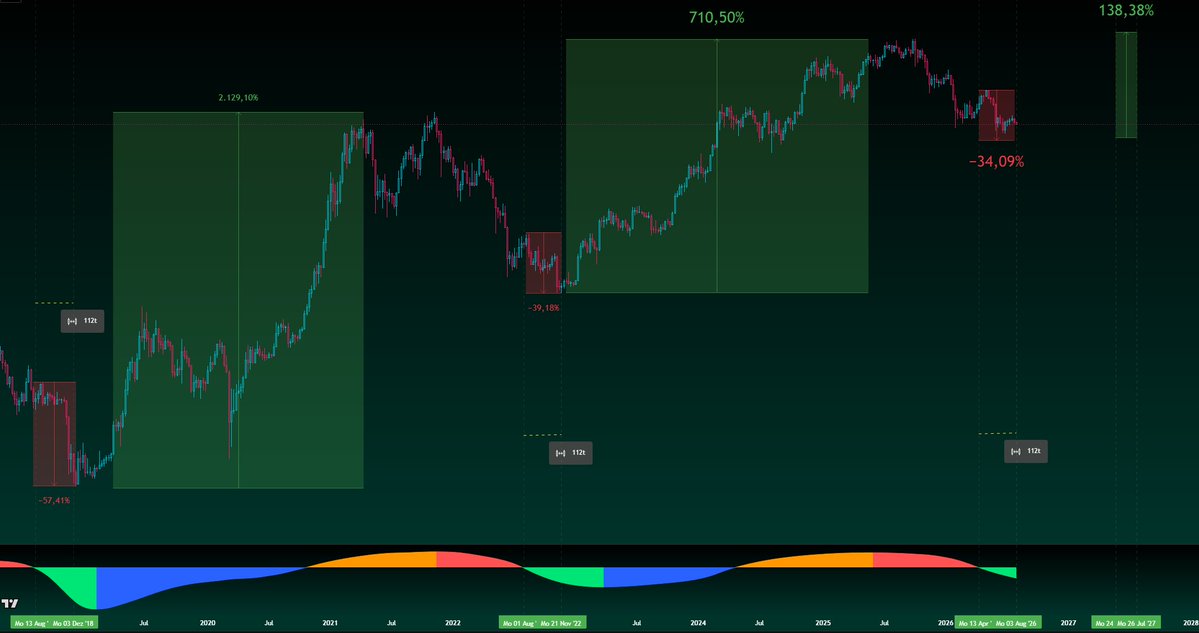
According to this outstanding setup, we could see the final bottom anytime between 3.8.2026 and a one-week delay.
My analysis claims that 112 days after we turned from red to green on the Bitcoin Journey Map, the absolute cycle bottom was formed.
This has happened in every cycle.
The bear journey is over soon.
We are about to see a bull run that will melt faces.
Many people will get front-run while they wait for sub $40k!
I’m not ruling out that it could happen, but a drop below $40k would need something similar to the COVID & FTX crash.
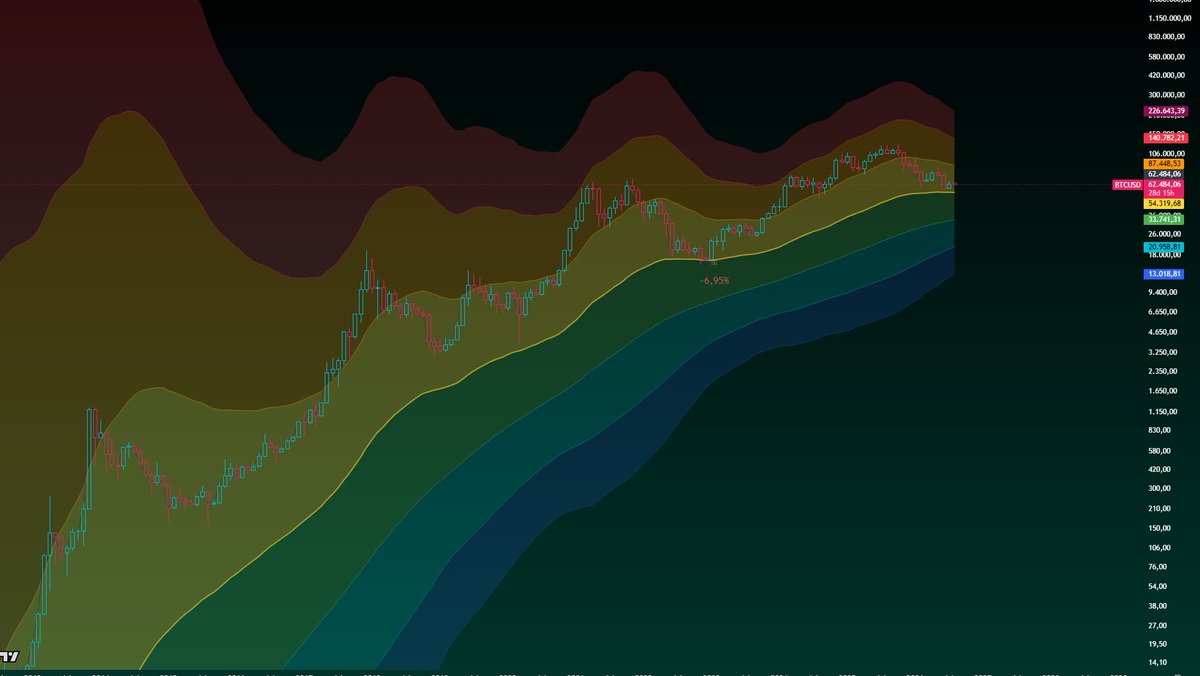
Check out the second picture!
“In the entire history of Bitcoin, the price has fallen below the yellow zone only once, and that was due to a historic event, the coronavirus pandemic & FTX crash.”
See you in 2027, when we hit a new all-time high.
Lava has hinted at a novel approach for their mainnet and token launch.
Claiming my LAVA to join the community and see how the launch unfolds 👀.
The floor is Lava @lavanetxyz 🌋
🚀 Exciting news from @MANTRA_Chain! The recent DAO proposal has been unanimously approved, paving the way for the creation of the $OM liquidity pool on Base Chain!
👏 Huge shoutout to the incredible #MANTRA community for their active participation and support!
Check out the full proposal here: https://t.co/HgYe3izT7A
#RWA
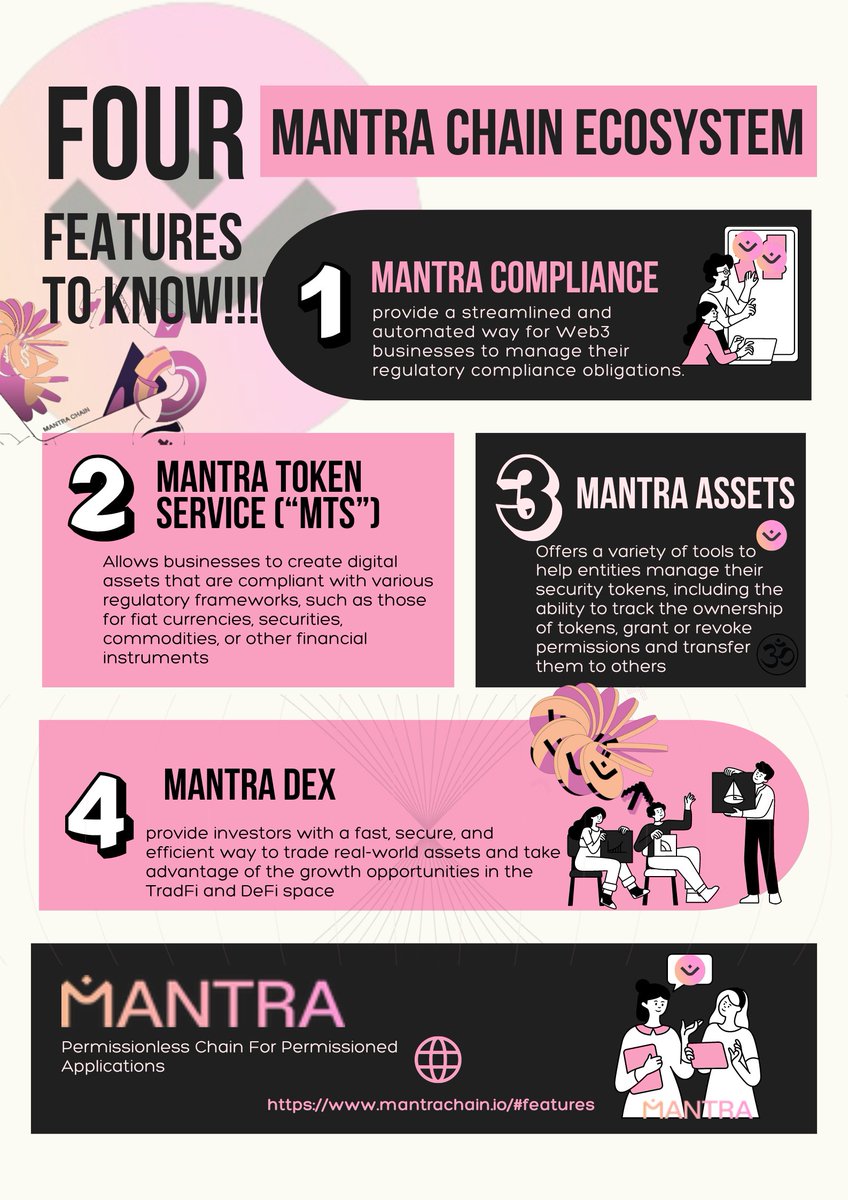
Great utilities around @MANTRA_Chain can not be overemphasized as its chain is known to be permissionless for Permissioned Applications.
The key 4 Chain features are highlighted which shows an amazing future for the #RWAs ecosystem in its tokenization https://t.co/Twkg1witrQ
$OM