SMA vs EMA – What’s the real difference?
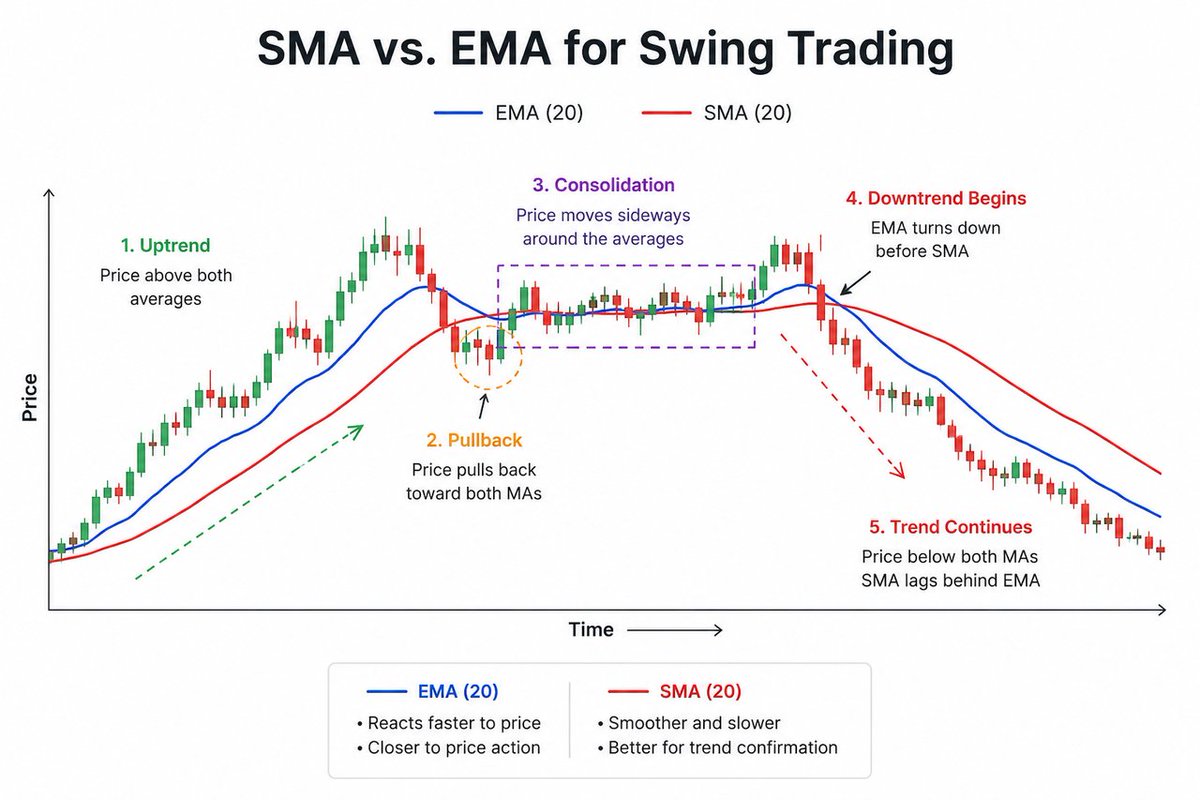
This chart shows it clearly:
🔵 Blue = EMA (20) 🔴 Red = SMA (20)
Key takeaways:
Uptrend → Price stays above both
Pullback → Price comes back to the MAs
Consolidation → Both flatten
Downtrend starts → EMA turns first
Trend continues → SMA lags behind
Simple rule: • EMA reacts faster (good for earlier signals) • SMA is smoother (better for staying in trends longer)
This is why Qullamaggie prefers 10/20 SMA, while many short-term traders use 8/21 EMA.
Which one do you use and why?
@NickDrendel With growth stocks weakening, healthcare and financials acting as safe havens makes sense given their defensive earnings and steady cash flows. Are you seeing any signs of rotation back into tech soon?
@BigWaveChartist over-analyzing can paralyze decision-making. Sticking to key timeframes like daily and weekly charts often gives clearer signals for actionable trades.
@Venu_7_ That smooth curve really shows patient accumulation over time. It’s impressive to see such clear volume support building quietly beneath the surface.