A look back at the stocks that traded above 10x sales at the dot-com peak.
What happened next:
– Cisco: ~25x sales, P/E above 200. Crashed -90%. Finally broke its 2000 peak in December 2025. 25 years and 8 months later.
– Intel: ~13x sales. Crashed -82%. Finally broke its 2000 peak in May 2026. Almost exactly 26 years later.
– Microsoft: ~25x sales. Crashed -65%. Took 16 years and 8 months to make a new high (October 2016).
– Qualcomm: ~30x sales. Crashed -88%. Took roughly 20 years to break even.
– Sun Microsystems: ~10x sales. Crashed -97%. Acquired by Oracle in 2009.
– JDSU: ~50x sales. Crashed -99%. Broken into pieces.
– Yahoo: ~50x sales. Crashed -97%. Sold to Verizon for a fraction.
– Lucent: ~10x sales. Crashed -99%. Eventually absorbed by Nokia.
– Nortel: ~15x sales. Bankrupt in 2009.
Then there's the famous mega survivor.
Amazon traded at ~30x sales at the peak. It still crashed -97%. The investor who bought at the top held through a 97% drawdown before eventually making money roughly a decade later.
The lesson isn't that every 10x sales stock ends in zero.
It's that even the eventual winners crash 90%+ first, and break even only after a generation.
Cisco. Intel. Microsoft. Amazon. The four greatest tech survivors of the dot-com era. Average time to break even on price alone: roughly 19 years. Inflation-adjusted, the math is uglier.
You have to be very right, very early, and willing to hold through unimaginable pain.
Most people aren't.
The Iranian navy, which has been destroyed eight times, has apparently closed the Strait of Hormuz again, because the United States, for the seventh time, won the war that wasn’t a war, so now the United States has to open the Strait of Hormuz that was already open before the not-war began.
The not-war began because Iran had uranium that was totally, completely, beautifully obliterated, so they can’t build the nuclear bomb they weren’t building, which is why the United States had to start the not-war it definitely didn’t start.
Now the United States, which has nuclear weapons, is threatening to use nuclear weapons to stop Iran from getting nuclear weapons, because nuclear weapons are far too dangerous for countries with nuclear weapons to allow other countries to have.
If the United States saw the United States doing what the United States does in other countries, the United States would invade the United States to liberate the United States from the tyranny of the United States.
Margin debt as a % of GDP just hit an all-time high.
4.0%. Higher than August 2021. Higher than March 2000. Higher than July 2007.
Every previous peak on this chart preceded a major drawdown:
– June 1968: end of the Nifty Fifty bull
– Aug 1987: Black Monday
– March 2000: dotcom crash
– July 2007: GFC
– Aug 2021: the 2022 bear market
The chart doesn't predict the future. It predicts who can't sit through it.
Leverage doesn't kill you when you're right.
It kills you when you have to sell at the wrong time.
People keep saying “this isn’t like 2000.” They’re right... it’s bigger.
In the dot‑com boom you had:
- 2,821 IPOs
- totaling 334B USD in value
In the AI boom you have three flagship deals:
- SpaceX
- Anthropic
- OpenAI
All are valued north of 1T. Inflation‑adjusted, one of them is almost 2× the size of every dot‑com IPO combined.
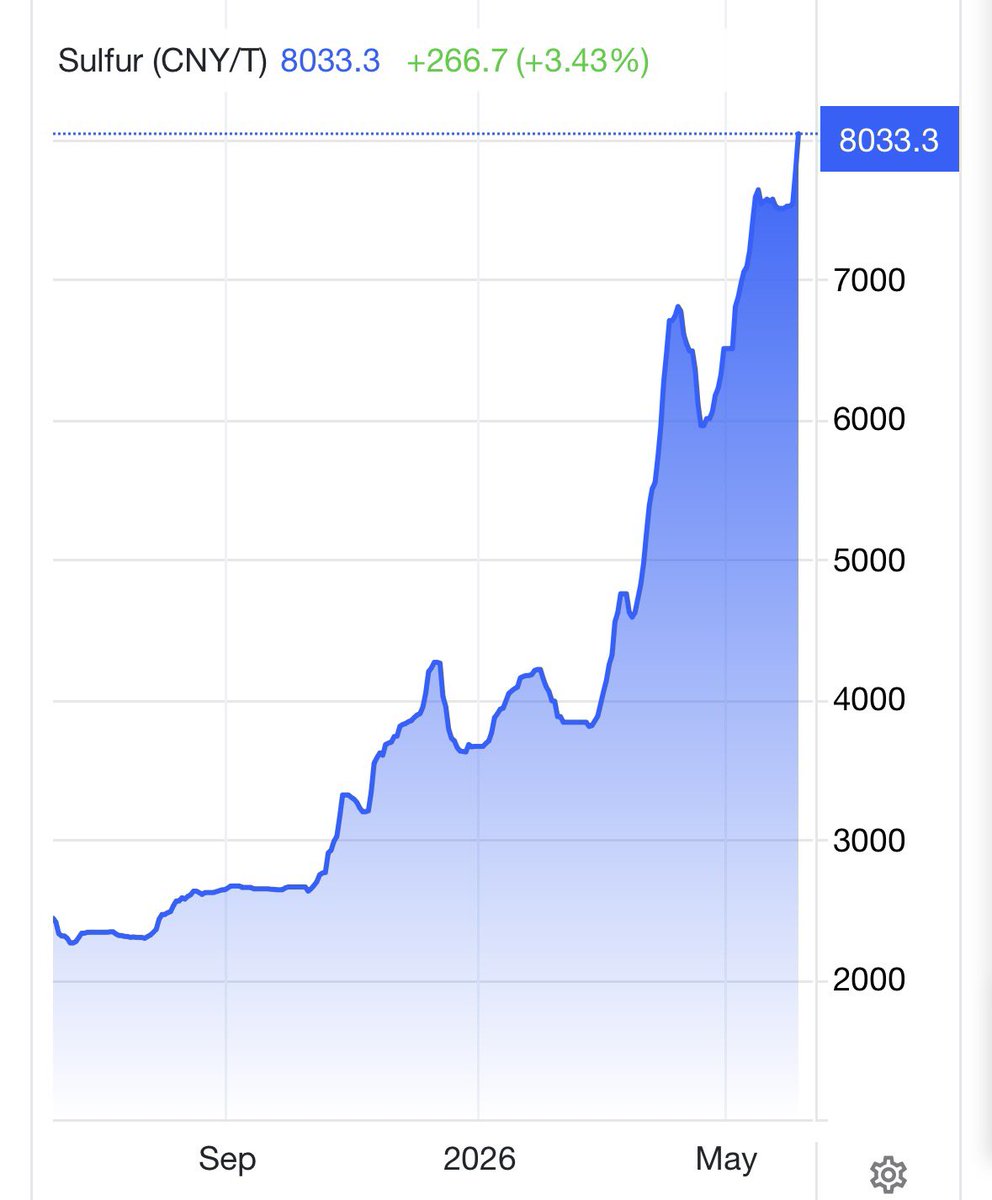
TRAFIGURA'S MARKETPLACE REVIEW: THE SUPPLY DEFICIT THAT WILL DRIVE OIL HIGHER FOR MONTHS
Trafigura, one of the world’s largest independent commodity traders with a global network moving oil and energy from producers to consumers, has released its newest Marketplace Review. The assessment carries real weight after the outbreak of hostilities between the US and Iran. What looked like a sedate year with supply overhang has turned into the largest energy crisis in history, and every buffer that contained prices has now been exhausted.
THE MASSIVE SUPPLY SHOCK
➡️ Trafigura estimates that daily losses amount to approximately 14 million barrels per day compared to pre-conflict levels.
➡️ Shipping volumes through the Strait of Hormuz remain close to zero due to the threat of attacks on vessels.
➡️ Oil production, both crude and refined products, remains significantly curtailed.
➡️ The world has already lost more than 1.1 billion barrels of oil.
➡️ Gas production has also been impacted to a similar degree as Qatar has been unable to produce or export at normal levels.
THE BUFFERS THAT CONTAINED PRICES HAVE BEEN SPENT
➡️ Elevated inventories at record highs for the time of year created an initial cushion.
➡️ The largest coordinated release of strategic petroleum reserves in history added approximately 400 million barrels.
➡️ Floating cargoes on the water for months and a shoulder season between peak demand periods bought extra time.
➡️ Demand reductions across Asia, Australia and Africa temporarily freed up molecules for Western markets.
➡️ Trafigura concludes these factors have bought the market time but are not a solution.
THE INVENTORY DRAW ACCELERATES
➡️ OECD commercial inventories are now starting to draw rapidly and most are breaking well below their five-year ranges.
➡️ US gasoline stocks have already reached the levels they normally hit at the end of the year before driving season has even started.
➡️ Inventories are drawing at a record pace in the United States with more to come.
THE SUPPLY DEFICIT THAT LOCKS IN HIGHER PRICES
➡️ Restoring production and shipping flows to pre-conflict levels will take months, not weeks, even if a peace deal is announced soon.
➡️ There are simply not enough molecules to meet demand without major demand destruction.
➡️ Refined product prices well above 200 dollars per barrel show the real physical tightness building.
➡️ If the conflict persists alongside restrictions to shipping flows, these challenges will become truly historic.
THE BOTTOM LINE
Trafigura’s Marketplace Review makes it clear that the buffers which contained the largest energy crisis in history are now largely spent and a persistent supply deficit has taken control.
This is the moment oil prices transition from contained moves to a sustained and powerful rally driven by physical shortage.
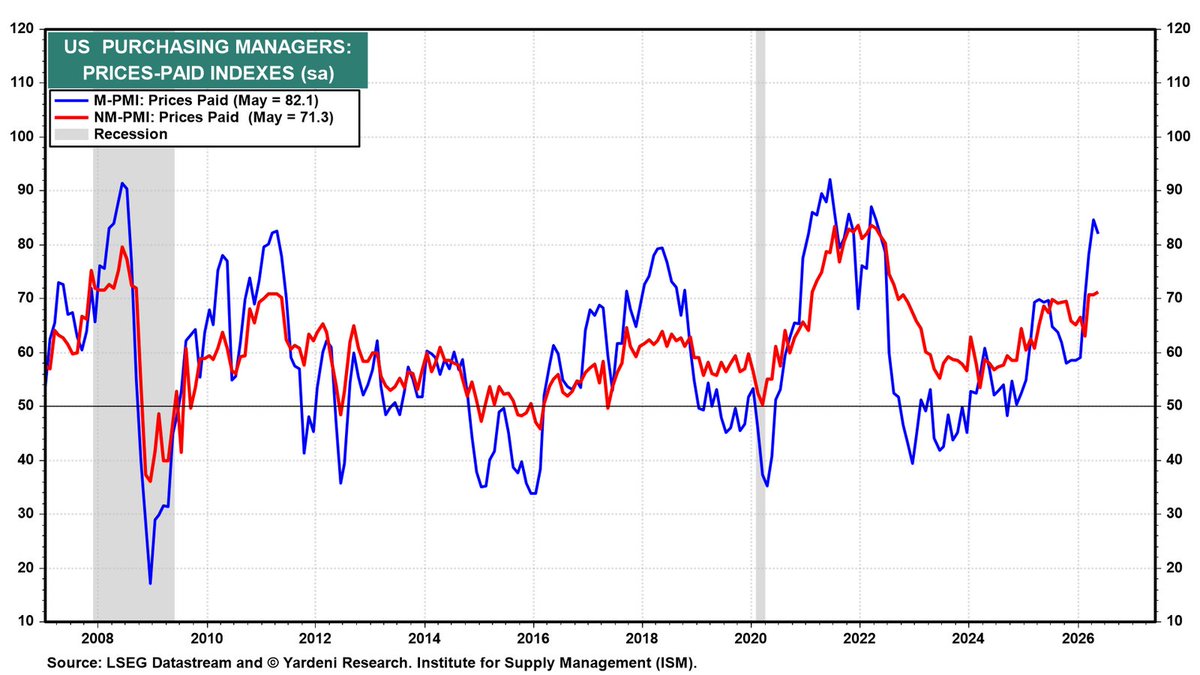
Yardeni Research Chart of the Day (June 4, 2026)
The manufacturing prices-paid index hit 82.1 last month while services reached 71.3, a nearly three-year high. Tariffs, energy costs, and supply disruptions are all pushing in the same direction. How much of this filters into CPI?
US tech sector employment is down 43k over the last year in data released this morning—that's nearly as bad as the worst of the 2024 tech-cession, and significantly worse than either the 2008 or 2020 recessions