#IBD#CANSLIM & Mark Minervini follower. US & ASX stocks Swing Trader. Tweets are my opinions only. Do not take any trades of my tweets. Manage Your Risk first.
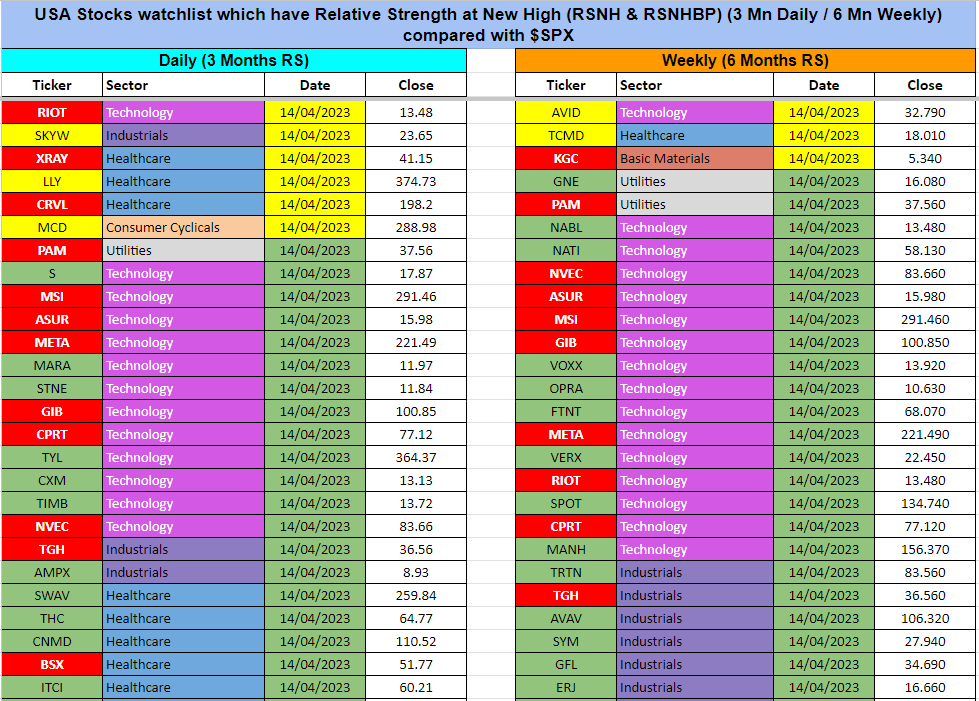
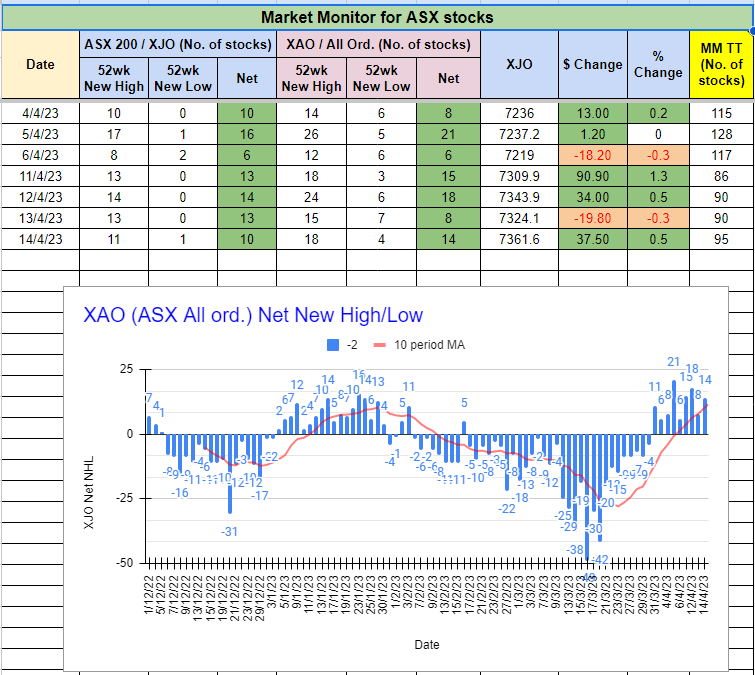
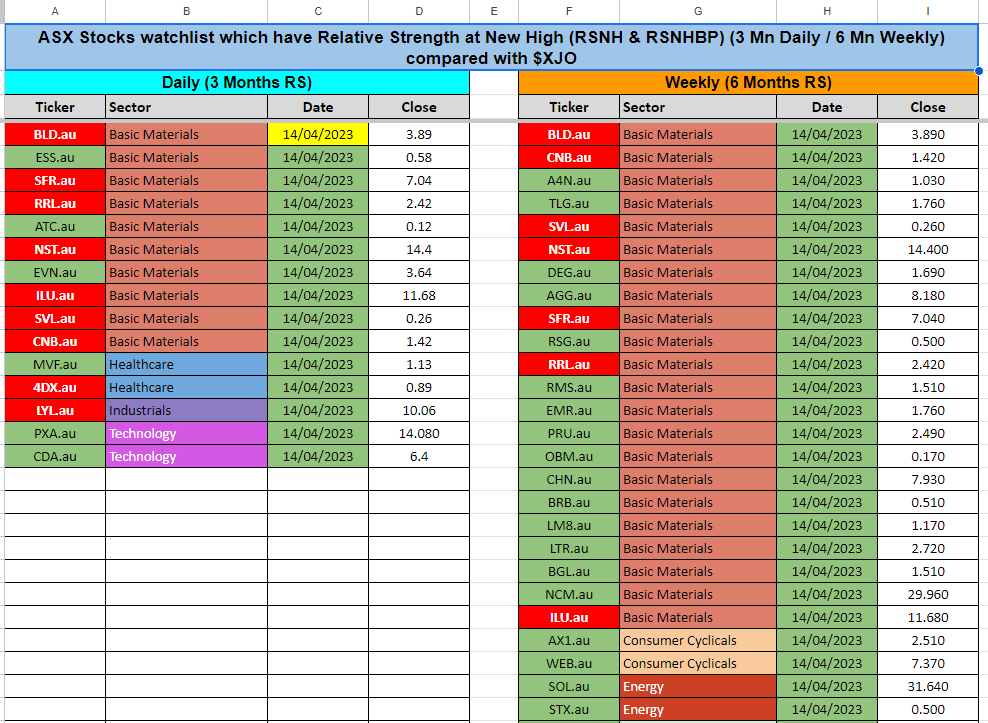
It's easier to spot the stocks in different sectors making RS New High & RSNHBP in Daily & Wkly timeframes for both #ASX & #US#stocks
Get the complete list https://t.co/FPUbuWqwmU
Please like, share, follow & use this to get the general market direction and stocks watchlist.
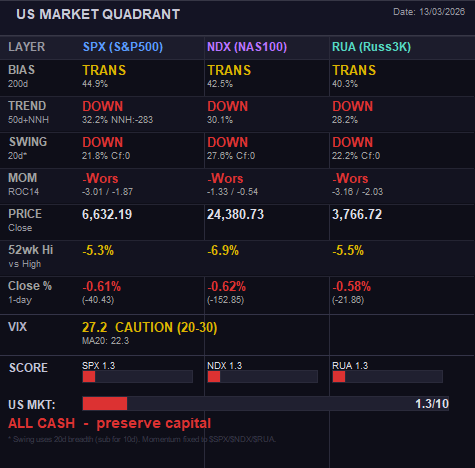
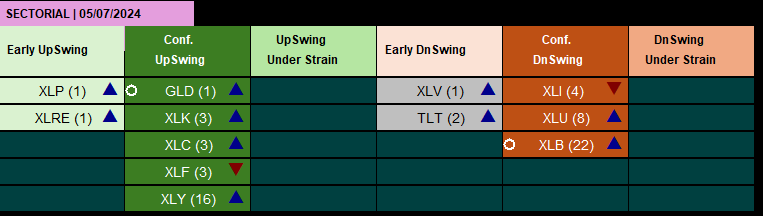
US Stock market Quadrant for #SPX, #NDX, #RUSSELL3000
- Only invest in stocks that are in defensive sectors or showing good RS compared to $SPX
- Cash is a good option while market is choppy and in downtrend
US Stock market Quadrant for #SPX, #NDX, #RUSSELL3000
- Only invest in stocks that are in defensive sectors or showing good RS compared to $SPX
- Cash is a good option while market is choppy and in downtrend
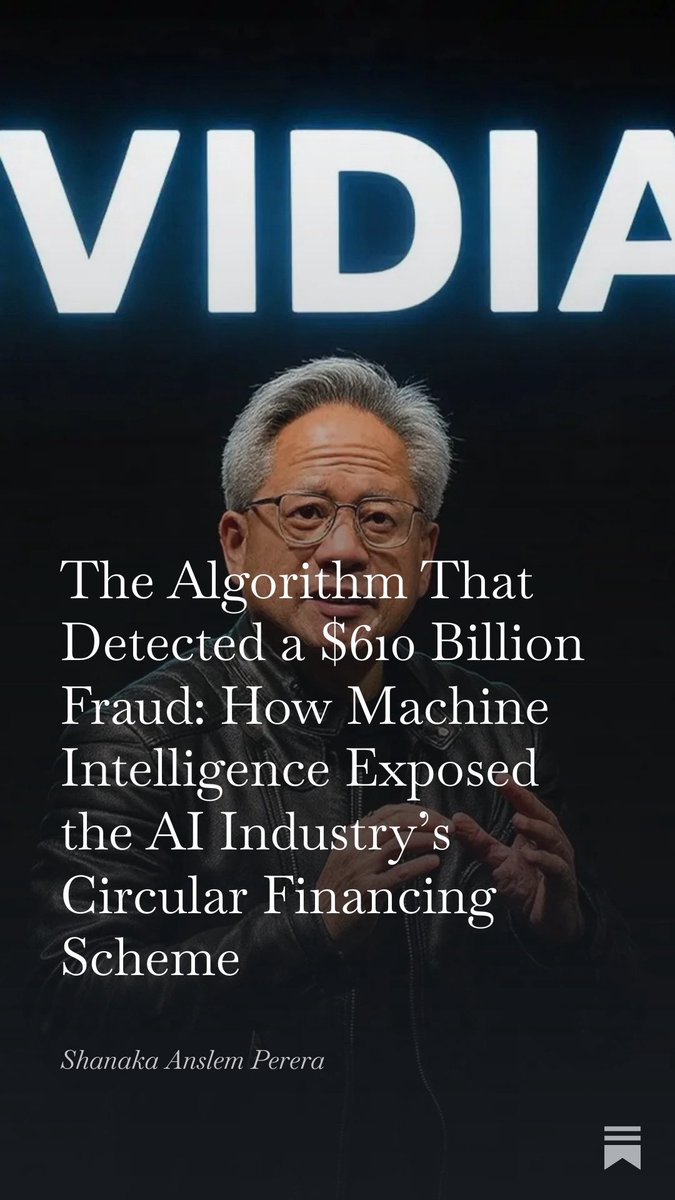
BREAKING: The $610 Billion AI Ponzi Scheme Just Collapsed
Last night at 4pm EST, something unprecedented happened. Nvidia stock rallied 5% on earnings, then crashed into negative territory within 18 hours. Wall Street algorithms detected what humans couldn’t: the numbers don’t add up.
Here’s what they found.
Nvidia reported $33.4 billion in unpaid bills, up 89% in one year. Customers who bought chips haven’t paid for them yet. The average wait time for payment stretched from 46 days to 53 days. That extra week represents $10.4 billion that may never arrive.
Meanwhile, Nvidia stockpiled $19.8 billion in unsold chips, up 32% in three months. But management claims demand is insane and supply is constrained. Both cannot be true. Either customers aren’t buying or they’re buying without cash.
The cash flow tells the real story. Nvidia generated $14.5 billion in actual cash but reported $19.3 billion in profit. The gap is $4.8 billion. Healthy chip companies like TSMC and AMD convert over 95% of profits to cash. Nvidia converts 75%. That’s distress level.
Here’s where it gets criminal.
Nvidia gave $2 billion to xAI. xAI borrowed $12.5 billion to buy Nvidia chips. Microsoft gave OpenAI $13 billion. OpenAI committed $50 billion to buy Microsoft cloud. Microsoft ordered $100 billion in Nvidia chips for that cloud. Oracle gave OpenAI $300 billion in cloud credits. OpenAI ordered Nvidia chips for Oracle data centers.
The same dollars circle through different companies and get counted as revenue multiple times. Nvidia books sales, but nobody actually pays. The bills age. The inventory piles up. The cash never comes.
AI company CEOs admitted it themselves last week. Airbnb’s CEO called it vibe revenue. OpenAI burns $9.3 billion per year but makes $3.7 billion. That’s a $5.6 billion annual loss. The $157 billion valuation requires $3.1 trillion in future profits that MIT research shows 95% of AI projects will never generate.
Peter Thiel sold $100 million in Nvidia on November 9. SoftBank dumped $5.8 billion on November 11. Michael Burry bought put options betting Nvidia crashes to $140 by March 2026.
Bitcoin, which tracks AI speculation, dropped from $126,000 in October to $89,567 today. That’s a 29% crash. AI startups hold $26.8 billion in Bitcoin as collateral for loans. When Nvidia falls another 40%, those loans default, forcing $23 billion in Bitcoin sales, crashing crypto to $52,000.
The timeline is now certain. February 2026, Nvidia reports fourth quarter and reveals how many bills aged past 60 days. March 2026, credit agencies downgrade. April 2026, the first restatement. The fraud that took 18 months to build unwinds in 90 days.
Fair value for Nvidia: $71 per share. Current price: $186. The math is simple.
This is the fastest moving financial fraud in history because algorithms detected it in real time. Human investors are 90 days behind.
Read the full data driven deep dive article here - https://t.co/sDEf5Mdrtc
This will mark my 8th year of Black Friday using Tradingview.
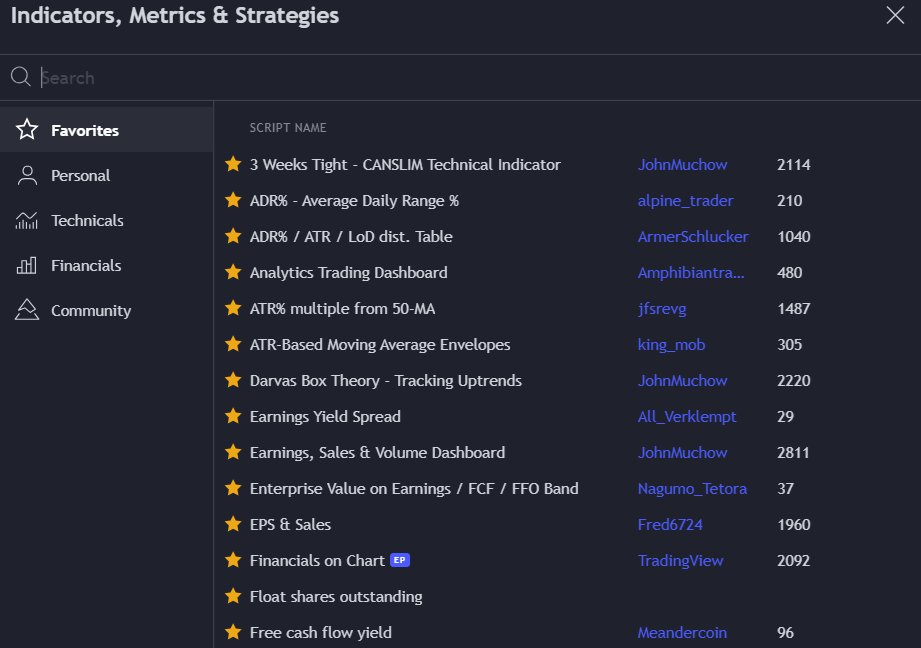
Here are 8 FREE public scripts I highly recommend exploring to refine your workflow, templates, or layouts. They’re listed alphabetically by script name:
1. **ADR% - Average Daily Range %** - By @zerokapital
https://t.co/X4auTxiKfR
Use this to study the historical ADR% of securities and analyze how momentum stocks develop and build their volatility patterns.
2. **ATR% Multiple from 50-MA** - Credits to @DumbleDax
https://t.co/mLUqfb8OMa
My favorite tool for profit-taking or extension signals in setups. It’s also helpful for index analysis to gauge when to scale back on risk exposure.
3. **EPS & Sales** - By @DumbleDax
https://t.co/jvz3G2xm36
Arguably the best EPS & Sales script available. It integrates earnings, sales, beats, and guidance into your charts via table format or below price template, as seen in my trading ideas and stock update.
4. **Financials on Chart** - By @tradingview
https://t.co/CbtPTKxl11
A fantastic on-chart display of up to 9 fundamentals (Qtr/Yr) of your choice from over 100 options, including PEG, Earnings Yield, Price to Free Cash Flow Ratio, and ROIC%. This is great for your long-term investment overview without referencing to another 3rd party website for fundamental data.
5. **Industry Group Strength** - By @amphtrading
https://t.co/IKtmMr502b
This indicator helps you pinpoint the best-performing stocks within specific industry groups. My default template lists the top 5 RS stocks from the same industry as the stock I’m analyzing. @amphtrading also offers 41+ free scripts, making him one of the most generous contributors to our TradingView community.
6. **Range Tightening Indicator** - By @Ollie_AllCaps
https://t.co/Mor5ex7AdU
A price-tightening indicator using a lookback period. It’s also useful for identifying the "rate of change" of potential bottoms or tops, as highlighted by Stanley Druckenmiller in his podcast with Nicolai Tangen.
7. **Simple Volume with Pocket Pivots** - By @finallynitin
https://t.co/aLQ9h3B0Xc
The most versatile volume script, in my opinion, offering extensive customization for color coding, dollar volume, RVOL, and more.
8. **Swing Data** - Credits to @DumbleDax
https://t.co/JzrW28SgVE
This table consolidates essential data for swing traders in a simple format, providing everything you need to improve trading execution & efficiency.
If you found this post helpful and valuable, consider retweeting🔁to spread the words to support their efforts and encourage future updates and enhancements.
I hope these scripts will prove beneficial on your trading journey.
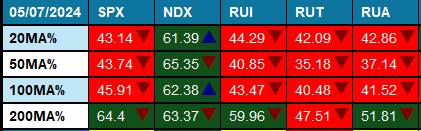
Heavy lifting is done by bigger names. Not majority of stocks participating in this uptrend.
% of stocks above its MA (20/50/100/200) are below 50%
New High/Low on $NASDAQ & $NYSE are not much
Ride the Tech lead uptrend until it is trending 📈
📈 The FREE TraderLion 2023 Model Book is here.
Train your eyes with 30+ marked-up charts of the biggest winners from 2023.
🔁 Retweet and we will DM you the link!
Must be following so we can DM you.
These are % of stocks above its MA & HiLo for $SPX $NDX $RUT $XJO.AU and $XAO.AU
> 50% and increasing is a sign that more stocks are going up and vice-a-versa
Market gone down on Friday but more number of stocks gone above its MA and similarly Advance/Decline ratio gone up