El ingeniero que creó claude code acaba de soltar un video de 28 minutos donde te enseña a escribir prompts que realmente funcionan.
He visto cursos de 300 dólares que no llegan ni a la mitad de lo que explica en los primeros 10 minutos.
Archivos CLAUDE.md, atajos de memoria, sesiones paralelas y patrones de prompting que cambian el juego.
Todo en un solo video y completamente gratis.
Da igual si eres desarrollador, principiante o ya llevas meses usando Claude. Esto te va a volar la cabeza.
A Recap of the Logic Behind Shorting Semiconductors, Plus a Few Thoughts on Monday
Most of this was already laid out in last week's weekly report.
https://t.co/sXDtY4X9JY
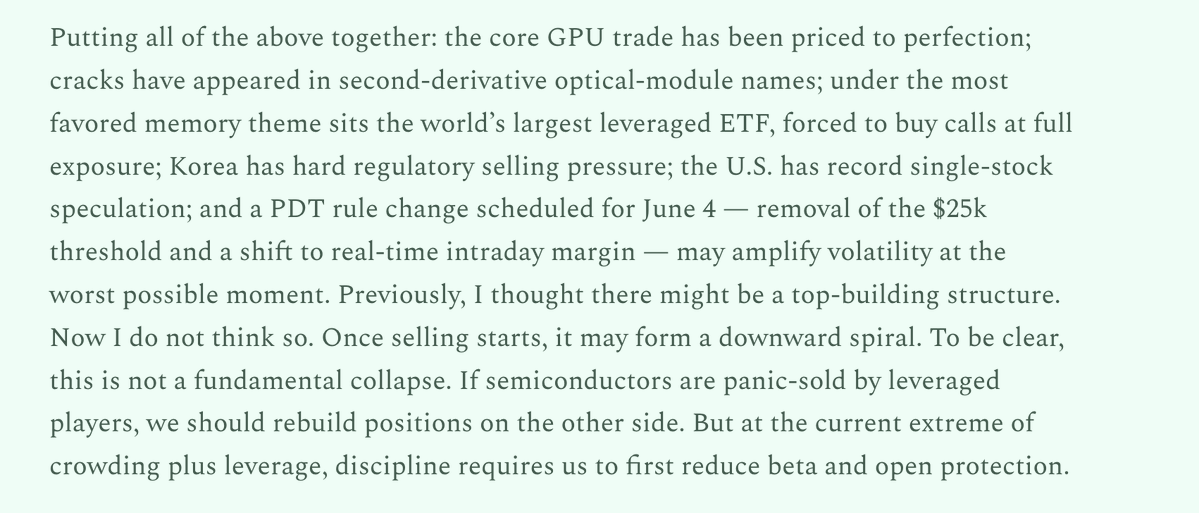
Here I'll cover just the single most important point: the prime mover of this crash was never fundamentals — it was leverage.
To gauge just how much leverage had piled up, I rely mainly on two indicators — VIXEQ and COR1M(I learnt them from @labubu_trader — supplemented by the call/put ratio and a few other sentiment indicators.
Let me first explain how these two indicators work.
VIXEQ (the Cboe S&P 500 Constituent Volatility Index) measures implied volatility at the single-stock level. VIX uses SPX index options and captures "the fear of the index as a whole"; VIXEQ instead runs a VIX-like calculation on each constituent's single-stock options and then aggregates them by market-cap weight, capturing "the fear of the average individual stock." When single-stock call buying turns extremely aggressive and speculation concentrates in names like MU, SNDK, INTC, and NOK, those single-stock options get bid up to very rich levels, and VIXEQ's premium over VIX is stretched to an extreme — the most direct read on single-stock speculation and leverage.
COR1M (the Cboe 1-Month Implied Correlation Index) measures the market's expected correlation among constituents. Index variance ≈ average constituent variance × correlation, so when individual stocks are all rising but rising independently of one another (with capital scattered across each name's own story), correlation gets compressed to rock-bottom. COR1M closed at 6.33, meaning implied correlation has already approached its historical low.
Put together, these two indicators describe the same structure: everyone is levered up, betting on mutually independent single stocks (mostly semiconductors), while at the same time many hedge funds are long semiconductors and short value stocks — so the index gets artificially flattened. The greatest risk in this structure is that any single shock can, in an instant, snap correlation back from near 0 to 1 — every name falls together, and all the leverage is forced to unwind at once. A crash, in essence, is just the process of correlation reverting to 1.
So as early as the start of last week, I had already recognized this enormous leverage risk. That is the prime mover of the decline.
As for what the trigger was — it really doesn't matter. AVGO's earnings, SemiAnalysis's negative commentary on MU, that so-called "overheated" NFP, Meta's secondary offering — these were all nothing more than that single gunshot at Sarajevo. It's exactly like silver in late January this year: Warsh taking office was also just a trigger; the real reason was that the leveraged capital loaded with unrealized gains, built up over the course of the parabolic rally, began to flee — setting off a long-on-long stampede, longs trampling longs, the more they sold the more it fell, the more it fell the more they sold. Structure determines direction; the catalyst only determines timing.
As for the short itself: I started with just a 1%-sized SMH put spread. In a market like this it's very hard to call exactly which day it cracks, but we can preset a level. Our preset level was 7495 — the HVL (high vol level). Above 7495, dealers are net positive gamma, which suppresses volatility; once 7495 breaks, positive gamma flips to negative gamma, dealers are forced to sell more the more it falls, manufacturing even greater systemic selling pressure. Adding to the short at that level carries the highest win rate. It's not about guessing the top — it's about waiting for the structure itself to flip short, for the dealers themselves to become forced sellers, and only then making the move.
There isn't much else to say.
Oh, one extra note on my view for Monday.
A systemic crisis is still brewing in the Korean market. To describe the most dangerous left tail, it would roughly look like this: if SK Hynix opens limit-down on Monday, it gives the 2x Hynix ETF (currently the world's largest single-stock ETF) no window at all to de-risk — it can't sell hedges into a locked limit-down board, can't de-lever, and so is forced to carry far more than 2x leverage into the next day. Once Hynix sells off further the following session, this ETF gets blown through entirely — possibly even liquidated — and once the panic spreads directly from Seoul to Hong Kong and on to the rest of the world, it triggers an even larger secondary crisis.
But in all likelihood, Korea will step in to prop things up. So let's pray for Korea.
Google 把内部工程师的代码审查(Code Review)规范公开啦
这几乎是目前业界最顶级的标准
很多程序员只会写代码,但不知道怎么审代码,可以看看 Google 是怎么做的
1.双向指南:不仅教审查者怎么挑毛病,还教作者怎么写出容易通过的代码
2.术语科普:解释了 Google 内部常用的 LGTM(看起来不错)和 CL(变更列表)到底意味着什么
3.实战价值:这套规范不是理论,而是 Google 每一位工程师都在用的实际操作准则
如果你想提升团队的代码质量,或者想知道顶级大厂的开发门槛,这份文档必读!
https://t.co/OdaozRkMYn
Yes I’m still very bullish on SPX and SMH for the whole year.
But I think in the next 1-2 weeks, SPX will form a bull trap. The reason is simple:
The straits wouldn’t reopen as fast as the market expected.
Also June’s 1st half has so many macro events which would cause big uncertainty.
I would reduce my leverage and exposure in beta during this bull trap and buying any dips in June’s 1st half.
Also if short end CL/BRN has a huge dip, I will buy it and also long XLE/OIH/XES.
@IOIoIOIolOIO@labubu_trader@diyas_1989 Historical average of bullish is 37.5%. Currently it's 31.7%, way lower than the average. So it's "overall" bearish.