WABAG (VA Tech Wabag): Anatomy of a base
just flipped its short-term downtrend — and today's chart is a clean lesson in reading a base for multiple entries, not just one.
What changed:
The recent pullback (a downtrend inside the bigger uptrend) just printed a Higher Swing High. Early read- the daily candle hasn't closed yet- but if it holds, this is a technically valid trend-change signal.
Three ways to play the base from here, each with a different risk/reward:
1. Low Cheat Pivot (occurs at the lower 3rd of base)
Minervini's term for a breakout firing in the bottom third of the structure - a form of PBC (pullback continuation). It's technically valid today. Tighter risk, safer entry - but can take time to work as the stock digests overhead supply.
2. Cheat Entry (middle 3rd of base)
A breakout through the next resistance level, roughly mid-range. More confirmation than the low cheat, still well ahead of the crowd.
3. O'Neil Pivot / ONP (top of base):
The classic base breakout O'Neil championed in How to Make Money in Stocks - buying strength at the base's highest point. Most confirmed signal, and when it works the move is fast and vigorous. But ~4-5 in 10 breakouts here "squat," so failures are part of the game.
You don't have to pick just one. Read the base correctly and you can scale in across all three - low cheat first, add on the cheat, add again on the ONP - building a full position as confirmation stacks up. Especially useful for positional trades.
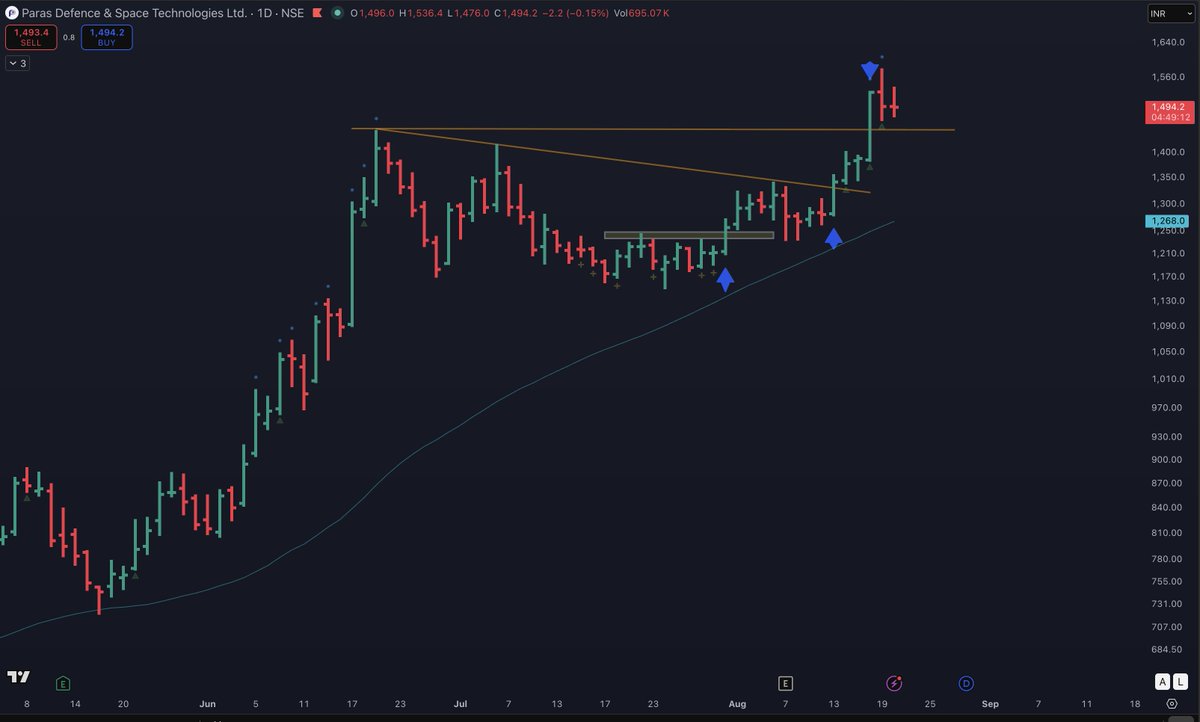
A recent example where I played this is in Paras:
Not financial advice. Just how I read the tape.
Sector Rotation Scanner - link below
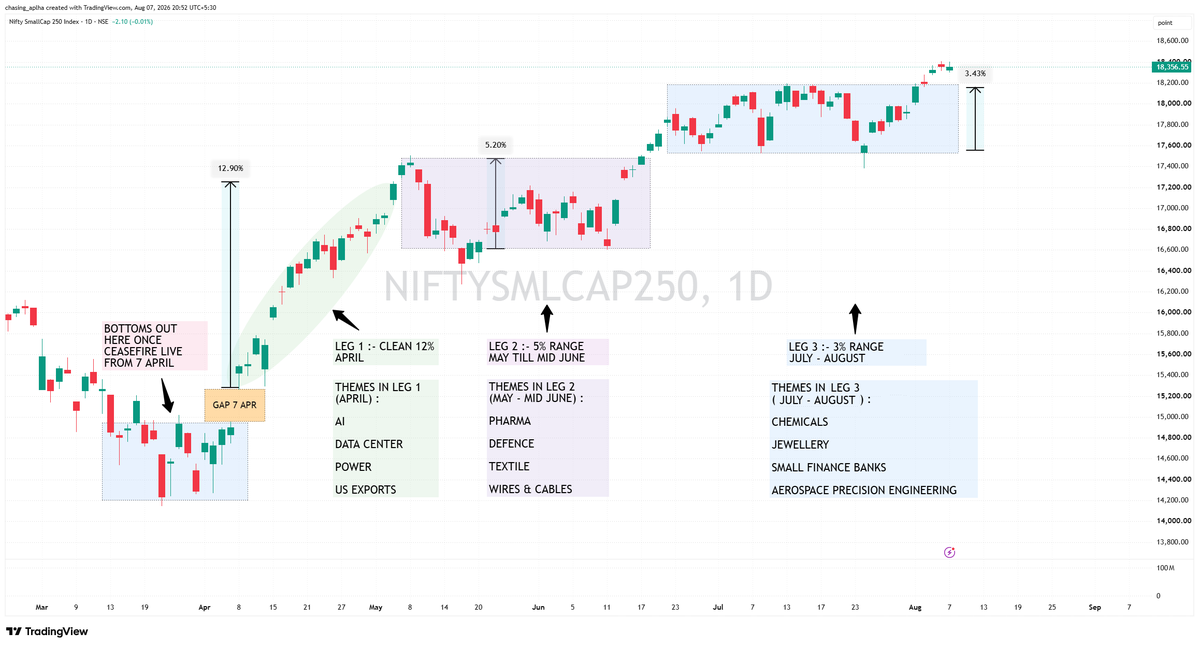
Why - Markets are majorly sideways- post early April bottom, Small Cap index gave a clean move of 12-14% till early May & then went sideways in Leg 2 & 3 (marked in attached chart). Since May, index is choppy & unless you knew how to churn capital into different trending sectors, your returns may have suffered!
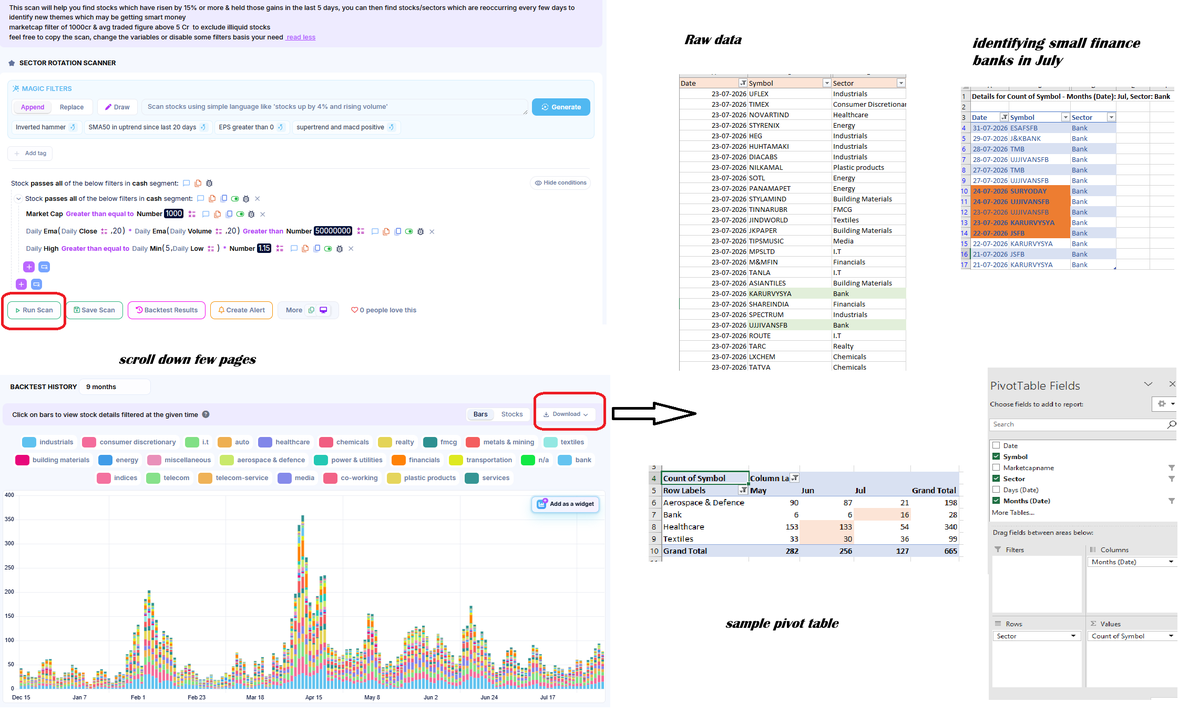
How -Link to a sector scanner (which lists stocks up 15% in last 5 days can help you in identifying sectors/ sub sectors/theme) -
https://t.co/ooi4ApeXql
You can run/save this scanner & change the conditions basis your needs; run this scan daily post markets preferably or twice a week, else download the backtest data on weekend & analyse stocks or sectors which are appearing repeatedly for many days (example shown in pic); once you have locked on to the trending theme, study the charts to identify strong clean structures (with solid fundamentals) & plan your entry
Over last 5 months, markets have seen frequent sector rotation as follows :
April : AI | data center | power
Mtar | Qpower | HFCL | Enrin | TDpower | PowerIndia
May-June : wires & cables | defence | pharma | textile
RR Kabel | Universal cables | Apollo | Paras | Suven | Bliss GVS | SPAL | ICIL
July-August : chemicals | jewellery | small finance banks | aerospace & precision engineering
HSCL | Tatva | Bluestone | Kalyan | ESAF | Ujjivan | Omni | Azad | Aequs
many paid websites also exist to help you catch trending sectors but above scan is completely free & gives you full raw data to act basis your inference
theoretically, catching even 2 good names per theme & riding for 10-15% swing (with 25-50% capital) allows you to earn high single digit portfolio returns in every leg, although its not that easy as by the time you get signs to fully exit a theme & deploy to new one, some move has already taken place there
pls open the attached pics on laptop to be able to read them better, if above scan is useful, kindly repost, share ahead for wider investor trading community reach 🙏
You forced me to skim through my old notes. :)
Dumping them here as they are. These are probably from 2021 or 2022, so if there's any deviation from what @PradeepBonde teaches today, please follow his latest version.
#2LYNCH Framework
A series of criteria we look for:
2 – The stock should not be up two days in a row.
L – Linearity. How smoothly the stock moves. The opposite of choppiness. It reflects orderly price action.
Y – Young trend. Prefer the first breakout, second breakout, or at most the third breakout. Beyond that, the probability of failure increases.
N – A negative day or a narrow-range day before the breakout.
C – Quality of consolidation.
Consolidation Quality (Sub-Criteria)
There should not be more than one 4% breakdown during the base.
Volume should contract during the consolidation.
The consolidation should be orderly, compact, and low in volatility. Avoid choppy bases.
The breakout bar should close near the high of the day.
If the stock doesn't satisfy the first two conditions of 2LYNCH, leave it.
When a stock forms a proper base, we consider it the beginning of a young trend.
Run the scan multiple times during the day and buy as soon as the stock satisfies the criteria.
Stop Loss
Initial stop loss should be at the low of the entry day.
If that low is violated, assume the setup has failed.
Management
Run the scan.
Apply the 2LYNCH criteria.
This gives you the candidate list.
Then prioritize using PLASTICS.
Initial stop: Low of the entry day. (I think this is outdated)
If the stock advances on Day 2, trail the stop.
If the stock gains around 20% by Day 3, consider locking in profits by trailing the stop to protect roughly an 18% gain.
You can either exit completely or book partial profits and trail the remaining position.
Linearity
Continuous institutional buying creates linear moves.
A sequence of setup → breakout → setup → breakout is a sign of linearity.
When several stocks qualify, prefer the one showing the highest degree of linearity.
In short, 2LYNCH is primarily a quality filter. Applying it consistently can significantly improve the success rate of your trades.
🟢Wait is finally over !!!!!
✅Giveaway of Model book -2 for 5 Star setup Containing 50 charts.
✅Elevate your Chart Reading Skills by Reviewing just 50 Charts.
✅50 detailed real - world Examples to Transform your Trading & Shorten your Learning curve.
📌Comment " Model Book & " Like + Retweet & DM me for 5 Star Setup Model book (Need to follow @pheonix_trader
for DM)
Price always moves via base.
Scalper. Day trader. Swing trader. Investor.
1-min or 1 week — the base is everything.
I’ve compiled all key base types you’ll see repeatedly.
RT + Follow & DM me to grab the document 📈
The 30min pivot has become one of the most important entry tactics in my entire system.
Huge credit to @1ChartMaster because he was the one who really opened my eyes to how powerful this entry tactic can be on true leadership names.
And it also solved one of the biggest problems I used to struggle with...chasing strength emotionally.
I think a lot of momentum traders can relate to this.
You see a stock like $MU, $ARM, $INTC, or $MRVL exploding intraday, your brain starts screaming “don’t miss it,” and before you know it you’re buying extended candles after a huge expansion move. Then the stock pulls back 3-5% immediately after you enter, you get shaken out, and somehow the stock ends up going higher without you anyway.
That cycle used to happen to me constantly.
The 30min pivot completely changed that for me because now instead of chasing emotional strength, I wait for controlled weakness *inside* strong trends.
I’m specifically looking for:
-a true leader,
-inside a strong theme,
-holding key moving averages,
-while institutions continue defending dips.
Names like $MU and $ARM recently are perfect examples. These aren’t random low-float junk names bouncing around. These are institutional leadership stocks inside powerful themes like semis, AI infrastructure, memory, networking, and data centers.
Momentum persistence in leading stocks is often driven by institutional accumulation and trend continuation behavior, especially during strong sector rotations.
"But how do I enter using the 30min pivot?"
No need to fret, my friend.
This is my EXACT entry process:
I wait for the stock to flush intraday into a key area:
usually the 9EMA, 21EMA, prior breakout pivot, AVWAP, or some obvious support zone where I think buyers may defend.
I do absolutely nothing during the flush itself, because I’m not trying to catch the exact bottom...all I’m doing is waiting for proof the selling pressure is slowing down.
Then I look for the first green 30min candle after the selloff. That candle becomes my pivot candle!
The second price takes out the high of that candle, I enter immediately. My stop goes under the low of the day or slightly beneath a support pivot.
That’s what creates the asymmetry for me.
If I’m wrong, I know very quickly.
Small loss, then move on.
But if I’m right, I’m entering a leading stock at the exact moment momentum begins shifting back higher after weak hands just got flushed out. That’s why I love this setup so much in momentum environments.
It allows me to participate in leadership without chasing vertical expansion candles emotionally.
A stock can be incredibly strong and still offer a terrible entry if you’re buying emotional extensions into resistance. The 30min pivot forces me to stay patient and wait for the stock to come into my areas instead of forcing trades because of FOMO.
The real edge comes from combining the setup with *stock selection*.
Strong stocks in strong groups tend to offer repeated opportunities during uptrends as pullbacks into moving averages often become areas institutions defend before continuation higher.
That’s why this setup has helped me catch some of my biggest winners recently like $ARM, $MU, $INTC, $DELL, etc.
Give it a try and let me know if it helps!
The 30-minute pivot strategy used by Elite Swing Traders (@1ChartMaster) is a tactical entry method designed to help traders buy high momentum stocks at defined support levels while minimizing the risk of "chasing" a move. It is particularly effective for traders prone to FOMO (Fear Of Missing Out).
Core Components of the Strategy
Identifying Relative Strength (RS): The strategy focuses on "RS names" stocks that are holding up better than the broad market. The goal is to find a stock you want to own that is currently experiencing a short-term pullback.
The "String of Red" Setup: A key signal for this entry is seeing a string of red 30-minute candles in a stock that is otherwise in a strong uptrend. This represents a healthy, short term "cooling off" period.
The Pivot Entry: Rather than buying as the stock is falling, the trader waits for a "pivot" a specific point where the downward momentum on the 30minute chart shifts back to the upside.
Defined Risk: By entering at the 30 minute pivot, you have a defined spot for a stop loss, usually just below the recent 30 minute low.
Why Use It?
Patience over FOMO: It forces the trader to wait for the stock to come to them rather than buying at the top of a parabolic move.
Institutional Alignment: It seeks to buy the "dip" in a leading stock, often near short term support levels like the 8 EMA or the 8 wee EMA
High Expectancy: When a High Tight Flag (HTF) or a high momentum name pulls back, the 30minute pivot often provides a low risk entry into the next explosive leg higher.
Key Takeaway: The strategy is about finding the "beachball underwater" a strong stock being temporarily pushed down by market noise and entering at the moment the pressure is released and the stock begins to "pop" back up.
@tradingview@in_tradingview
You are changing the features of all the plans on your whims and fancies despite a customer paying for it upfront.
Any feature change you want to implement should be done for the new customers from a specified date
This is daylight robbery by changing the plans during their running subscription period.
More than everything - this is a serious unethical practice
💥100 Day Challenge - 100 Charts
✅Will Post everyday for next 100 days - 100 charts of Past winners.
✅Will mark Probable Entry Points so that everybody can train there eyes.
Like , Retweet for maximum reach
Follow : @pheonix_trader
🟩Giveaway Alert :-
🟩Golden opportunity to utilize this correction in markets to improve your trading skills :-
🟧 Giveaway of complete package containing 5 different model books which are :-
1⃣Model book containing 100 charts of 5 Star Setup
2⃣Model Book based on IPO Setups
3⃣How to trade Breakouts using ADX & RSI
4⃣How to trade Pullback using ADX & RSI
5⃣Market cycle & Stage analysis.
✅Comment " Model book"
✅Like + Retweet
✅DM me for Model book's
(Need to follow @pheonix_trader for DM)
🚨 Still getting DMs for my Swing Trading Playbook — weeks later.
Most traders are drowning in indicators.
What they really need is a rules-based system.
My framework is simple:
• Market Trend
• Sector Leaders
• High-Probability Setups
• Strict Risk Management
Missed the FREE Playbook PDF last time?
1️⃣ Follow
2️⃣ Repost
3️⃣ Comment “SWING”
I’ll send it.
What’s ONE trading rule that saved you the most money?
👇
#SwingTrading #StockMarket #Trading #StockMarketIndia #Nifty #PriceAction
Learning Post
100 Days Challenge PDF
I completed a 100 Days Challenge, and during this journey I used several stock setups. I’ve created a simple and useful PDF explaining all the setups I used.
If you want the PDF:
FOLLOW, LIKE, RETWEET, and COMMENT #PDF
I’ll send it to you via DM.