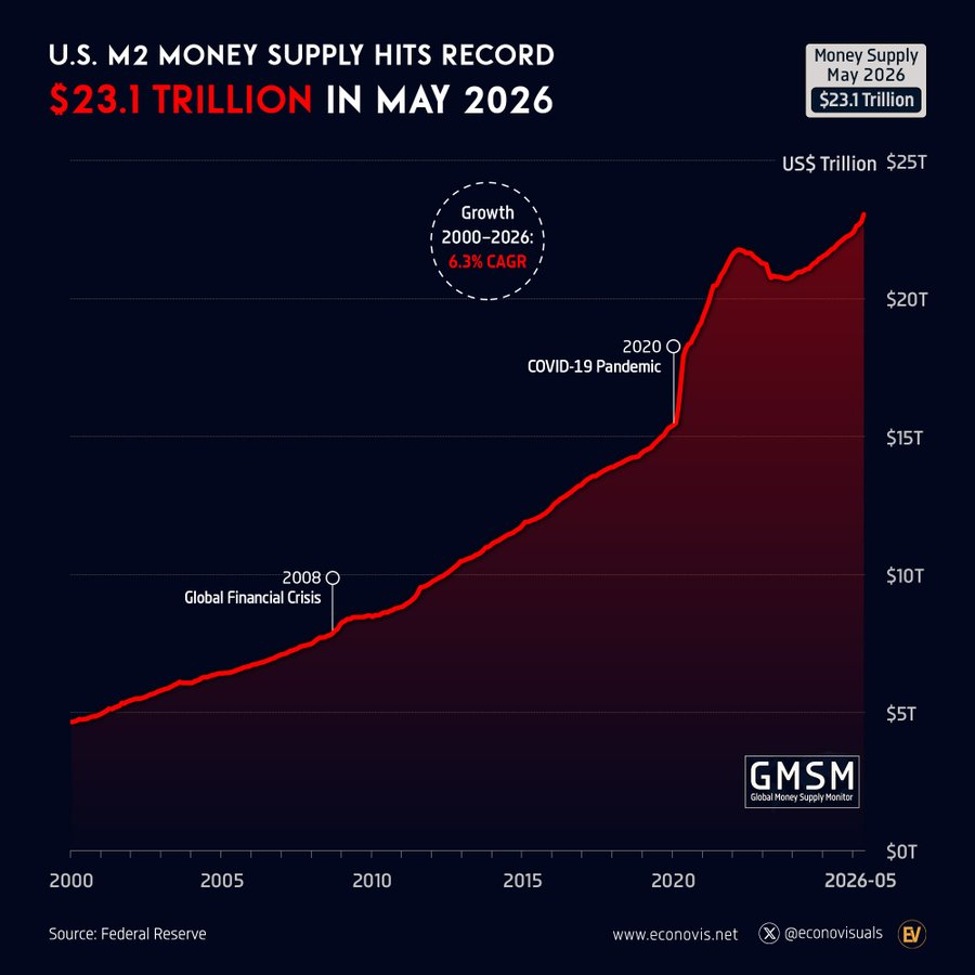
BREAKING: US M2 money supply surged +$247.8 billion in May, to a record $23.1 trillion.
This marks the largest monthly increase since May 2021.
Year-to-date, M2 has soared +$698.6 billion, the largest January to May increase in 5 years.
Money supply now stands $1.3 trillion above the March 2022 peak.
Since 2000, money in circulation has grown at an average annual rate of +6.3%.
US money creation is accelerating.
In a fiat currency system, the benefits of deflationary technology primarily accrue to asset holders, because the forced inflation created by central banks pumps up asset values.
If we were living under an honest, hard-money monetary system, where the benefits of technology would not be offset by central banks debasing the currency, those gains would accrue more evenly across the population.
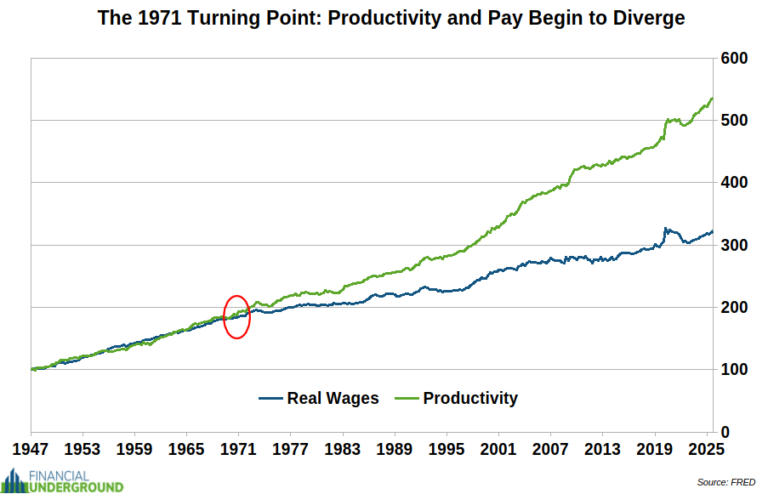
That is why we think the chart below is instructive.
It is a long-term view of real wages versus productivity.
The two tracked together well for decades, showing that as productivity increased, real wages did too. In other words, most people benefited from increases in productivity through higher real wages.
Then something changed around 1971, when that strong positive correlation broke. It was the year the US government cut the dollar’s last link to gold and the dollar became a pure fiat currency.
Since 1971, there has been a growing gap between productivity and real wages.
If you could transport yourself back to the early 1970s, just as the divergence between productivity and real wages began, and ask people what they thought 2026 would look like, they might have said something like The Jetsons—flying cars, advanced technology, and a society in which everyone was better off.
They probably would not have believed you if you told them that, in reality, people would be worse off in many ways in 2026 than they were in the early 1970s, despite enormous technological progress. We may not have flying cars or The Jetsons, but there have still been significant advances. Yet people’s standard of living has declined in many ways.
Today, many people are bewildered by how people could be worse off now than they were then. The answer is in this chart, which shows that the fiat system and currency debasement are the problem.
Despite advances in technology, the shocking level of currency debasement has not merely kept pace with the natural deflation that comes from increased productivity, but has vastly outpaced it… which is why people are, in many ways, worse off today than they were in the early 1970s. That prosperity has been stolen by inflation and fiat currency.
Since 1971, productivity has continued to increase, largely thanks to advances in technology, but those gains have not translated into growth in real wages as they had in the past under an honest money system. That is because under a fiat currency system, the central bank—the Federal Reserve—has created significantly more inflation than the gains in productivity, which meant real wages did not keep up.
However, those productivity gains from advancing technology did not just disappear. They were redirected somewhere else. They accrued primarily to asset holders, as wage earners chased rapidly depreciating fiat currency.
In short, the fiat currency system is a mechanism for transferring wealth created by technological productivity gains to asset holders and politically connected insiders closest to the money printer.
Frankly, it is a disgusting, dishonest system that operates at the expense of honest people.
But that is the nature of the monetary system we are all forced to live under. And it is wise to acknowledge it, understand it, and take action to protect yourself.
And now, with AI bringing a mind-bending level of productivity gains, this dynamic is about to go into overdrive.
The US wealth divide has never been bigger:
The top 20% of earners now account for ~58% of all personal spending in the US, the highest proportion on record.
At the same time, the bottom 80% account for just ~42%, the lowest on record.
This comes as personal outlays growth for the top 20% has averaged +8.3% per year since the 2020 pandemic, almost double the +4.5% seen for the bottom 80%.
Over the last year, the gap has widened further, with the top 20% seeing a +6.5% increase in spending, compared to +2.6% for the bottom 80%.
To put this into perspective, in the 1990s, both groups accounted for roughly equal proportions of total personal spending, at ~50% each.
Asset owners are the only winners in this economy.
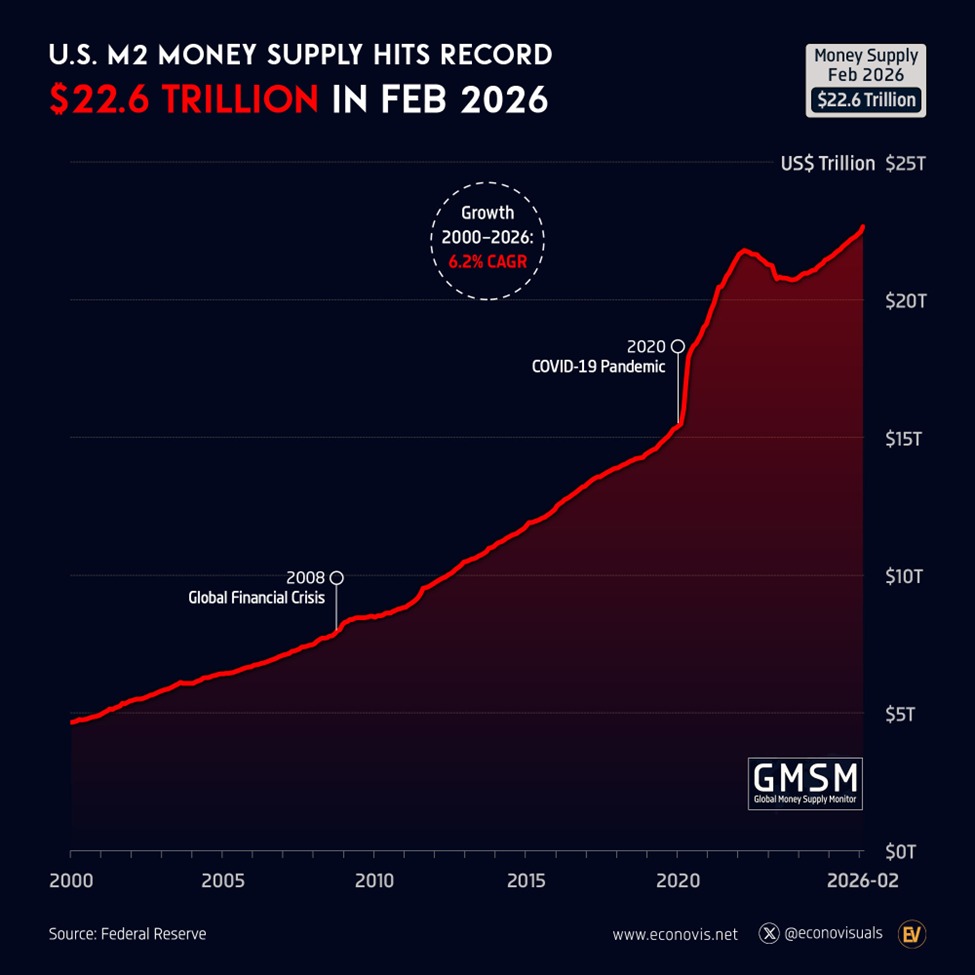
BREAKING: US M2 money supply jumped +4.8% YoY in February, to a record $22.6 trillion, marking the 24th consecutive monthly increase.
Money supply is now ~$700 billion above the March 2022 peak.
Since the 2020 pandemic, M2 has surged +$7.1 trillion, or roughly +$1.2 trillion per year.
Since 2000, money in circulation has grown at an average annual rate of +6.2%.
The US Dollar is losing purchasing power at a historic pace.
Blessed Feast of St. Patrick!
Let us pray,
O God, who chose the Bishop Saint Patrick to preach your glory to the peoples of Ireland, grant, through his merits and intercession, that those who glory in the name of Christian may never cease to proclaim your wondrous deeds to all. Through our Lord Jesus Christ, your Son, who lives and reigns with you in the unity of the Holy Spirit, God, for ever and ever.
Amen
Today we celebrate Saint Patrick: missionary, bishop, former slave, and bold preacher of the Gospel.
Patrick didn’t set out to be a saint. He was kidnapped as a teenager, enslaved in Ireland, and spent years in isolation as a shepherd. It was there, in quiet and hardship, that his faith deepened. After escaping and returning home, he eventually chose to go back to Ireland, not for revenge, but for love, to share the Good News.
That’s courage. That’s mercy. That’s a life transformed by grace.
Today, let's remember: God can use every chapter of our story for His glory.
St. Patrick, pray for us 🍀
$PLTR announced a sovereign AI operating system reference architecture with $NVDA designed to give customers a turnkey AI data center from hardware procurement through application deployment.
The partnership is aimed at simplifying the full stack from infrastructure buildout to real-world AI deployment.
8 BUSINESS LESSONS FROM HISTORY;
1. Solve problems people pay for (Edison).
2. Iterate relentlessly (Ford).
3. Build teams of A-players (Rockefeller).
4. Market emotions, not products (Jobs).
5. Diversify intelligently (Buffett).
6. Adapt or die (Bezos).
7. Leverage debt wisely (Vanderbilt).
8. Give value first (Carnegie).
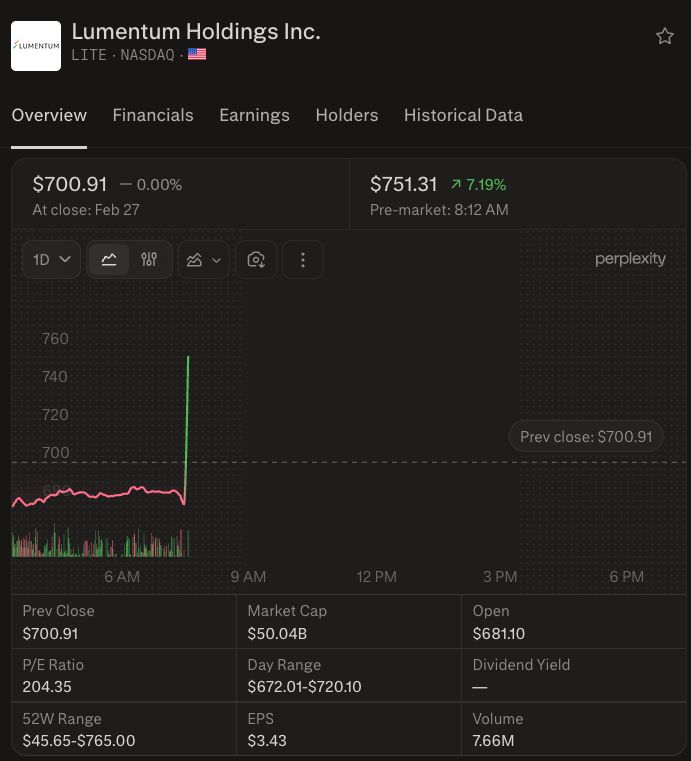
$NVDA is investing $2B into Lumentum $LITE and another $2B into Coherent $COHR under separate multiyear, nonexclusive optics deals.
Both include multibillion-dollar purchase commitments and give Nvidia future capacity/access rights for advanced laser and optical networking parts, while funding R&D and U.S. manufacturing expansion aimed at optical interconnects and advanced packaging for AI data centers.
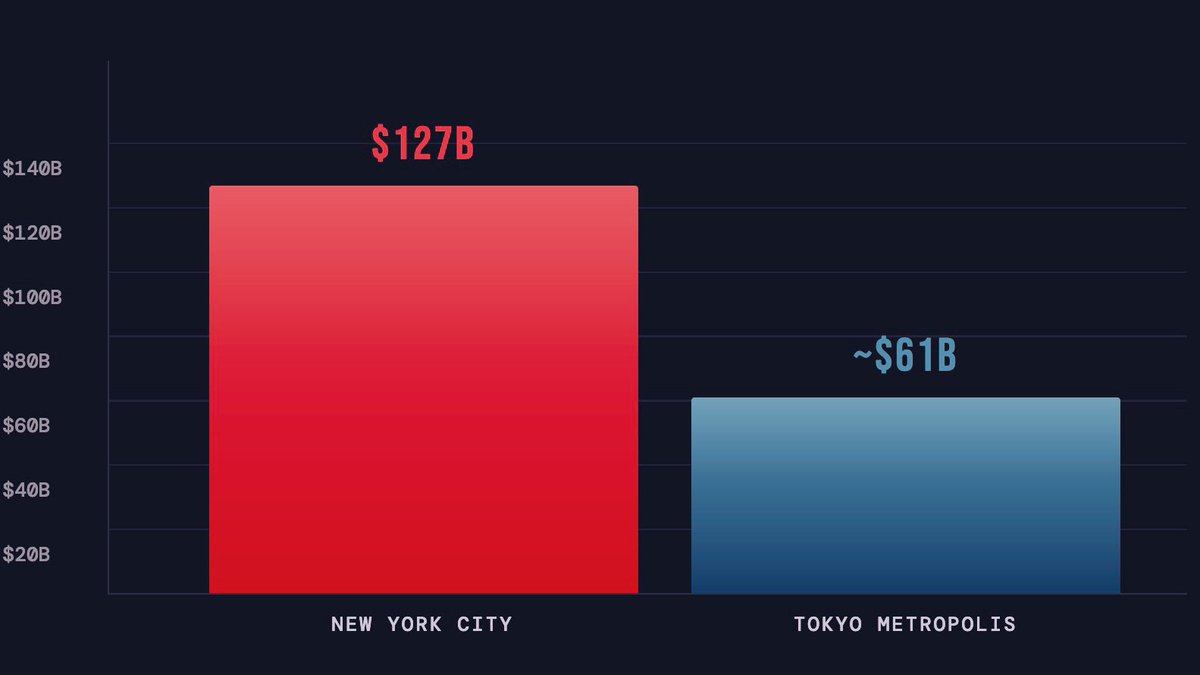
NYC's annual budget is double Tokyo's
Tokyo has twice as many people, cleaner urban environments, superior public transit, lower crime rates, almost no homelessness, and better public education.
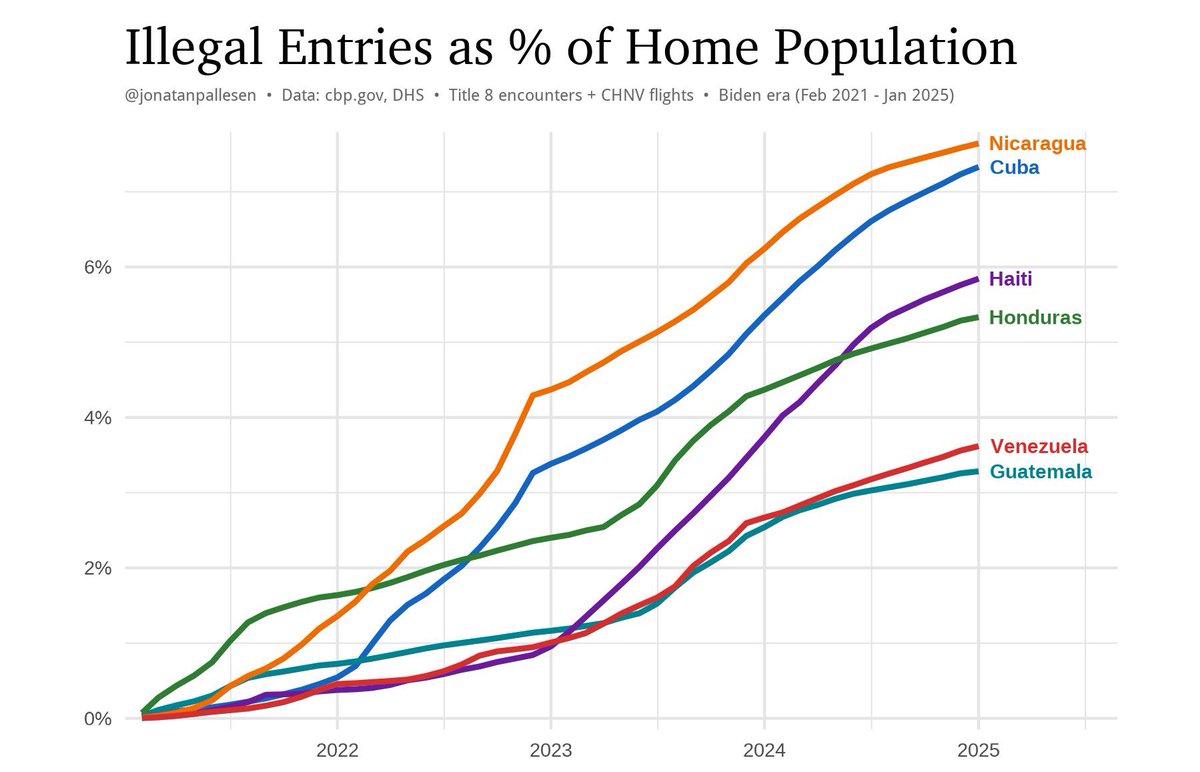
Most Americans still don’t fully understand what happened under Biden…
8% of Nicaragua entered the US in 4 years.
8% of the entire country.
7% of Cuba.
6% of Haiti.
5% of Honduras.
Most people have never heard of the Cantillon Effect.
But once you understand it, you’ll see the world of investing differently.
What is it?
In the early 1700s, Richard Cantillon noticed a simple pattern:
When new money enters an economy, it doesn’t reach everyone at once.
And whoever gets it first benefits the most.
Here’s how it works today:
New liquidity enters through the Fed and through bank lending.
Both follow a similar pattern:
→ Markets and large balance sheets get first access
→ Large corporations and well-connected borrowers tap cheap credit next, they invest and expand at today’s prices
→ Asset prices tend to rise as new liquidity chases finite assets
→ Consumer prices often follow
→ Wages rise last, usually after purchasing power has already declined
Fed data shows how lopsided the playing field is:
- The top 10% hold nearly 90% of equities.
- The bottom 50% holds about 1%.
It’s a simple but powerful monetary transmission.
Understanding this won’t change the system.
But it might change how you think about where to store your savings.
For those of you who don't know, I write all about topics like this every week in The Informationist. Last week, we dove deep on this one.
Link in bio if you want to read the full explanation.