🚀 Just released my US Model on Portfolio123 — complementing the earlier European model!
🇺🇸 US Model: +44% CAGR Long Term in sims https://t.co/3jj7qhqULj
🇪🇺 European Model: +44% CAGR Long Term in sims
https://t.co/eZ5iZBUtgp
📊 Limited spots available – check out the simulations and feel free to request a stress test. Take a look at links to see Out Of Sample performance. 🔥
⚠️ Disclaimer: For educational purposes only. Not financial advice. @P123Finance
#QuantFinance #Portfolio123 #SystematicInvesting #Quant #sp500
I valued SpaceX for its IPO a few weeks ago, with minimal information and a promise to revisit the valuation, when the prospectus was made public. The prospectus is public, the offering price has been set and my update is up and running. https://t.co/zRjpD1C0wv
By the way, related to this topic: normally predicted volatility is larger than realized one = Good to sell put and call with higher volatility stocks , when the price is also coherent
Value is created.
Intrinsic value is not a just a semi-static stock trait waiting to be discovered. It is produced through capital allocation, operational execution, innovation, competitive positioning, and sometimes exogenous catalysts.
Markets price this imperfectly and with variable lag. Sometimes price is a leading indicator, sometimes it is a lagging one.
Sometimes, value is created over many years, others it is created in an instant by an idea or event and prices need to follow suit if the stock is to remain reasonably valued.
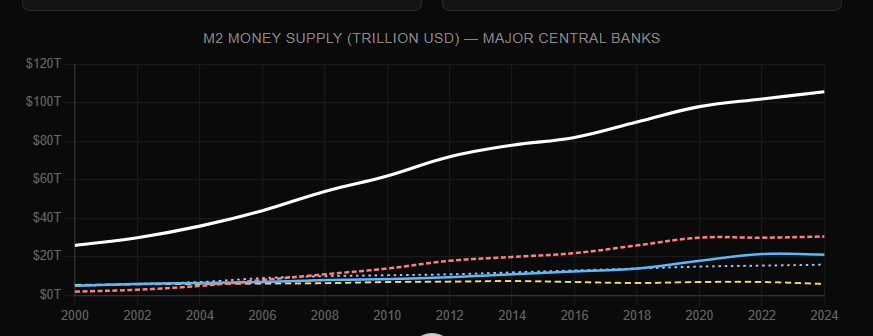
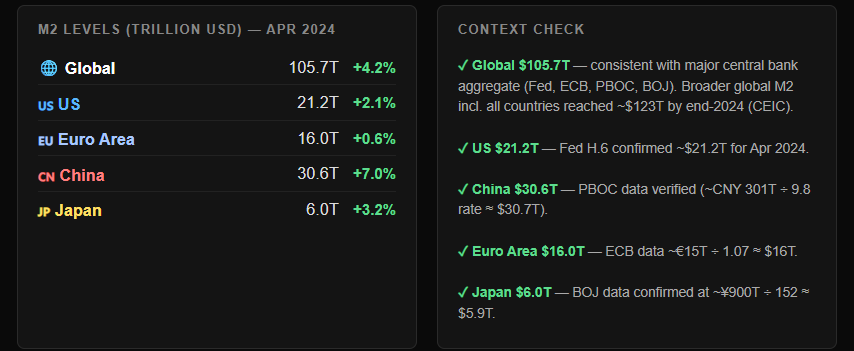
Global M2 money supply hit $105.7T in April 2024 — +4.2% YoY.
But here's what matters now: by end of 2024 it had already surged to ~$123T, and in 2026 we're pushing toward $137T+ as central banks quietly expand again. China alone is at $50T.
The liquidity spigot never really closed. Markets pricing in rate cuts while M2 keeps climbing.
#Macro #GlobalM2 #Liquidity #CentralBanks #MoneySupply
📢 This is how our Designer Models perform altogether OOS!
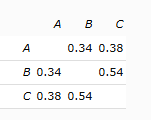
📷Both Sortino and Sharpe ratios outperform the S&P 500 — check the photo! Correlation amongst them is key as well for true diversification.
For full details & live models, check yourself or DM:
https://t.co/aX50f0Zh79
#DesignerModels #Portfolio123 #QuantTrading
📢 This is how our Designer Models perform altogether OOS!
📷Both Sortino and Sharpe ratios outperform the S&P 500 — check the photo! Correlation amongst them is key as well for true diversification.
For full details & live models, check yourself or DM:
https://t.co/aX50f0Zh79
#DesignerModels #Portfolio123 #QuantTrading
Meanwhile inflation pressures keep building: consumer sentiment just hit one of the lowest readings in ~60 years, LEI indicators continue struggling, and only ~27% of S&P 500 stocks outperformed the index over the past month — a 1st percentile breadth reading since 2005.
At the same time, S&P 500 margins and the index itself remain near all-time highs. Interesting setup for a potential melt-up or meltdown.
And now US 10Y + Japan bond yields are surging, increasing pressure on the Fed to hike again — the bond market is forcing the Fed, not vice versa.
Investing is simple, but not easy. — Warren Buffett
Same in football and in almost every pursuit of excellence. As Johan Cruyff said: “Playing football is very simple, but playing simple football is the hardest thing there is.”
The highest level in investing, sports, and life is rarely about complexity — it’s about mastering the fundamentals with discipline, consistency, and clarity.
#sp500 #quant #investing
Meanwhile inflation pressures keep building: consumer sentiment just hit one of the lowest readings in ~60 years, LEI indicators continue struggling, and only ~27% of S&P 500 stocks outperformed the index over the past month — a 1st percentile breadth reading since 2005.
At the same time, S&P 500 margins and the index itself remain near all-time highs. Interesting setup for a potential melt-up or meltdown.
And now US 10Y + Japan bond yields are surging, increasing pressure on the Fed to hike again — the bond market is forcing the Fed, not vice versa.
The U.S. Leading Economic Index (LEI) is one of the more reliable leading indicators for detecting recessions.
Its 6-month growth rate triggered a recession signal back in September 2025. As end of March 2026, that 6-month rate has continued to become less negative relative to the initial signal. Worth watching how this develops.
Agree with your findings. I tested multiple combinations around earnings week using different buy/sell rules, and the best approach still seems to be waiting for a weekly rebalance. Maybe with a daily confident tool the results could improve, but I’m not convinced the extra stress and complexity are worth it. Markets often overreact to bad earnings quickly (knives) and need some time to be digested, while good news tends to be priced in more gradually. Thanks for share @systvest
Agree with your findings. I tested multiple combinations around earnings week using different buy/sell rules, and the best approach still seems to be waiting for a weekly rebalance. Maybe with a daily confident tool the results could improve, but I’m not convinced the extra stress and complexity are worth it. Markets often overreact to bad earnings quickly (knives) and need some time to be digested, while good news tends to be priced in more gradually. Thanks for share @systvest