Trust me, no one is born a trader. It’s an acquired skill built through constant study and screentime.
Be patient with the learning curve while you acquire the skills that will last a lifetime.
Financial freedom isn't having enough money to buy everything you want.
It's having enough financial control over your life that the need for money can no longer force you to do things you don't want to do.
Trading has almost no barrier to entry.
That's one of its greatest attractions.
It's also one of its greatest dangers.
No degree required.
No apprenticeship.
No boss.
No customers.
Just capital and a brokerage account.
Easy to start.
Extraordinarily difficult to master.
3 patterns I’ve noticed in people who actually get better:
1. The 20-Minute Rule If you give a skill 20 focused minutes a day, most days, you’ll outpace almost everyone who “plans to start someday.” Talent is rare. Starting and staying is rarer.
2. The Input Audit In 5 years you won’t be a different person by accident. You’ll be the product of what you read, who you spend time with, and what you repeat when no one is watching. Change the inputs or keep the same life.
3. The 5-Item Filter Write down everything you want this year. Circle the 5 that would actually change your trajectory. The rest aren’t “later.” They’re distractions until the 5 are done.
Most people don’t fail from lack of ideas. They fail from spreading thin and never stacking days.
@BlogJulianKomar So true! I started off trying to day trade and realized I was just swaping one full time job for another. Time is truely one thing we can not buy more of. I am looking forward to joining your community next month.
@mwebster1971@TaPlot@YouTube Prayers and good vibes sent your way. My wife had cancer and is doing well. In her journey we discovered Dr. Thomas Seyfried. Anyone with cancer should check out his work. Stay strong!
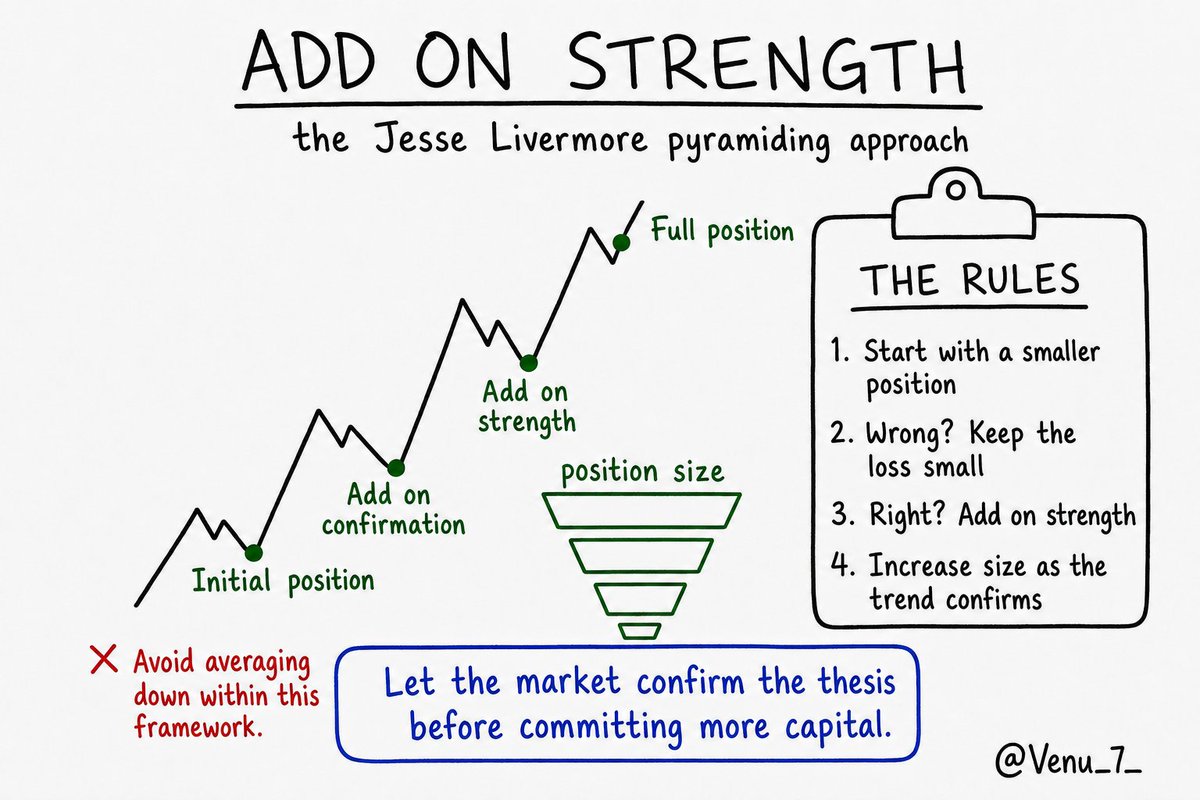
Jesse Livermore had a simple idea about position sizing:
1) Start small.
2) If the trade goes against you, take a small loss.
3) If price confirms your idea, add to the position.
4) Keep adding as the trend strengthens.
5) Never average down.
The key idea:
Risk less when uncertainty is high.
Commit more when the market proves you right.
The goal isn’t to catch the lowest price.
It’s to increase your position as the probability of being right improves.
Jesse Livermore’s approach to position sizing was built around confirmation.
Rather than building a full position immediately, his approach was to increase exposure as price confirmed the trade.
- Start with a smaller initial position
- If price moves against the thesis, keep the loss small
- If price confirms the thesis, add on strength
- Continue increasing size as the trend develops
- Avoid averaging down within this framework
The advantage is simple: your smallest exposure is when uncertainty is highest, while your largest exposure comes after the trend has provided more confirmation.
This isn’t the only way to build a position. Long-term investors and different trading styles may use very different approaches.
But within Livermore’s framework, the objective wasn’t to get the lowest possible entry.
It was to commit more capital as the market provided more evidence that the trade was working.
William O’Neil’s research broke down that:
37% of a stock’s price movement was attributable to its industry/subgroup
12% was attributable to its broader sector
Together, that means about 49% — essentially half — of a stock’s movement is related to the group/sector it belongs to.
Get the group and theme right, and your odds of success go up exponentially.
Theme > setup.
@stamatoudism was very influential in getting this across for me.
Lesson from 50 years in the markets:
The market is an expensive place to discover you have an ego problem.
Learn to be wrong.
Learn to take the loss.
Learn to move on.
Your account will thank you.
My dad taught me that kindness and courage are the only currency that matters in life. Not school awards, not job titles. Just how you treat people and how you get back up from failure. That’s the real legacy.
Few things reveal our priorities more clearly than how we spend our time.
Money can be replaced. Possessions can be recovered. But an hour that passes never returns.
Invest your time carefully in your faith, your family, your growth, your purpose, and the people who matter most.
15 years ago in my trading career, I made a simple mistake:
I traded almost every stock that formed something that looked like a breakout base.
I knew the patterns.
But I didn't understand the details that separate an average base from an exceptional one.
Today, I can reject many breakout setups within seconds.
Before I even think about an entry, I zoom out.
Here is what I look for:
1. Prior advance: I want real momentum. Ideally, the stock has already advanced 70–100%+ over the previous weeks or months. Many of my biggest winners were already 100%, 200%, 300% or even 500% above their 52-week lows.
2. Stock character: I love stocks that move like staircases. Strong momentum move → tight consolidation → another strong move. I avoid stocks that constantly swing violently in both directions.
3. Base quality: I want clean price action and contracting volatility. The tighter and cleaner the consolidation becomes, the more interested I get. Repeated fake breakouts and wild swings are warning signs.
4. Breakout level: I prefer a clean horizontal breakout line or even slightly declining resistance. If the stock keeps drifting higher throughout the base, the entry becomes much more difficult for me.
5. Volume: Ideally, volume contracts as the consolidation develops. I want to see activity dry up rather than constant heavy trading throughout the base.
6. The complete picture: I never judge the base in isolation. Fundamentals, story, relative strength, liquidity and my conviction in the stock still matter.
This is why simply knowing the names of chart patterns isn't enough.
You can learn what a flat base, VCP or cup-and-handle looks like relatively quickly.
But recognizing the small differences between an average setup and an exceptional one takes thousands of charts.
You have to train your eyes.
That's why I have studied historical winners for years and built my own model books.
The goal is to reach the point where a sloppy setup almost feels wrong when you look at it.
Look at these 4 charts.
Two have the characteristics I want.
Two don't.
Which two would you trade—and what detail gave you the answer?
Support and resistance aren't lines. They're tests.
Support holds → buyers defended it.
Resistance breaks → buyers overwhelmed sellers.
Breakout fails → sellers regained control.
Support breaks → supply won.
Don't just mark levels. Watch what price does when it reaches them.