99% OF RETAIL ARE NOT READY FOR THIS $BTC "PUMP"
BITCOIN JUST PRINTED TEXTBOOK HEAD & SHOULDERS PATTERN
HISTORICALLY, IT SIGNALS TREND REVERSAL
NEXT TARGET: $50K
HUGE MOVE INCOMING! 🚀
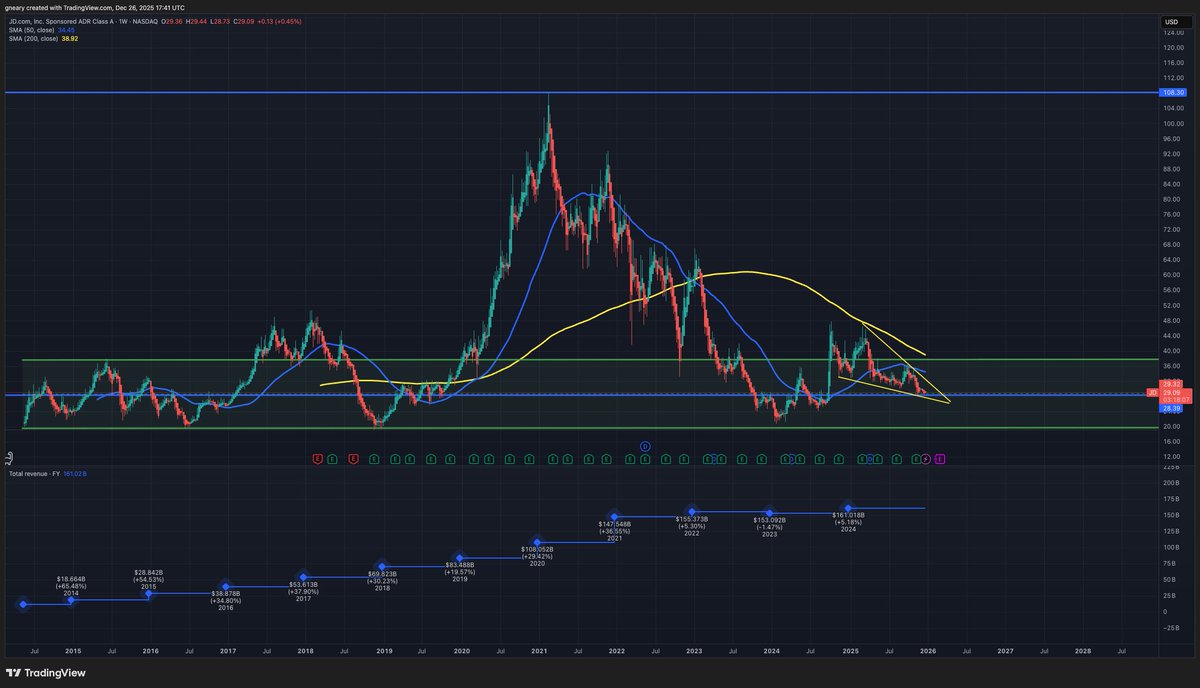
$JD at $30, is the same price it was at in 2014.
Except Revenue:
2014: $18 Billion per year
2025: $161 Billion per year
Nearly a +900% increase.
We shared the same chart for $BABA when it was at $70....before it ran to $192
Verdict: severely undervalued:
PT $100.
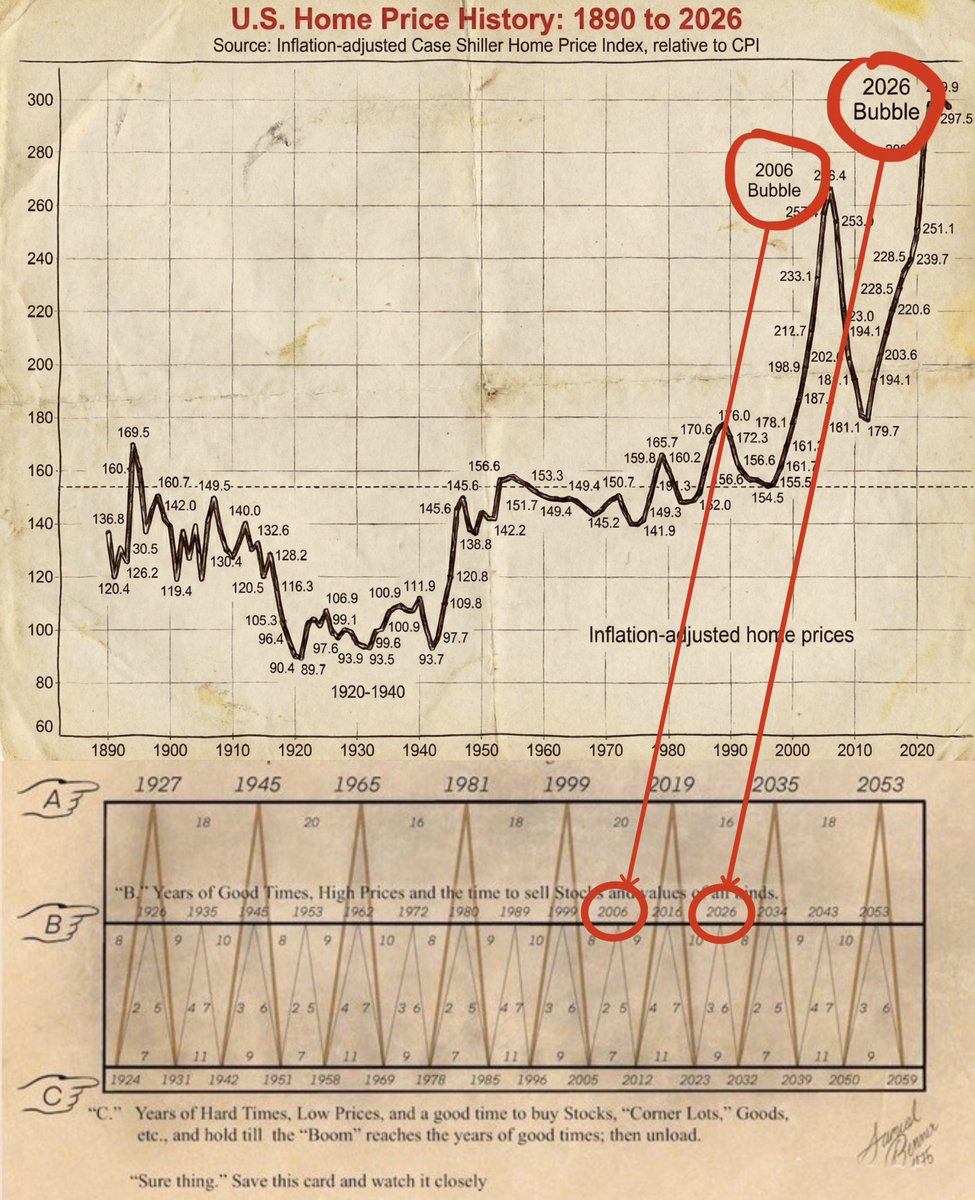
🚨 DO NOT BUY A HOUSE THIS YEAR, UNLESS YOU’RE A BILLIONAIRE!
I’ve spent 22 years in macro.
I’ve seen every cycle from the 2008 crash to the 2020 blow-off top.
Look at this chart.
2006 bubble peak was about 266.
If you think the current market is safe, you’re missing the structural freeze.
Buying in 2026 is a TRAP, here’s why:
Redfin data shows a massive imbalance: 36.8% more sellers than buyers. Demand is sitting at the lowest levels since the 2020 lockdown.
This isn't a normal dip, it’s a total loss of market velocity.
Most owners are locked into 3% paper. With the 30-year fixed suffocating at ~6.5%, the "cost to move" is prohibitive.
We have zero price discovery because nobody can afford to move. You’re buying an illiquid asset at a sticker price that hasn't been tested by real volume.
Buying now means locking in a brutal monthly payment on an asset with capped upside.
If you’re levered 5:1 on a house that stays flat while you pay 6.5% interest, you aren't building equity, YOU’RE BLEEDING CAPITAL.
THE MACRO PLAY:
Wait for the fatigue phase in late 2026/2027.
That’s when the "wait it out" crowd hits life catalysts (divorce, relocation, retirement) and is forced to sell into a cooling economy.
That’s when the affordability reset actually happens.
If you must buy, do it like a shark:
– Stress-test your income for a 20% haircut.
– Keep your LTV healthy (avoid negative equity).
– Only buy if you can hold through a flat decade.
The math doesn't have emotions. Don't let your dream home become a zombie asset.
I’ve studied macro for 10 years and I called almost every major market top, including the October BTC ATH.
Follow and turn notifications on. I’ll post the warning BEFORE it hits the headlines.
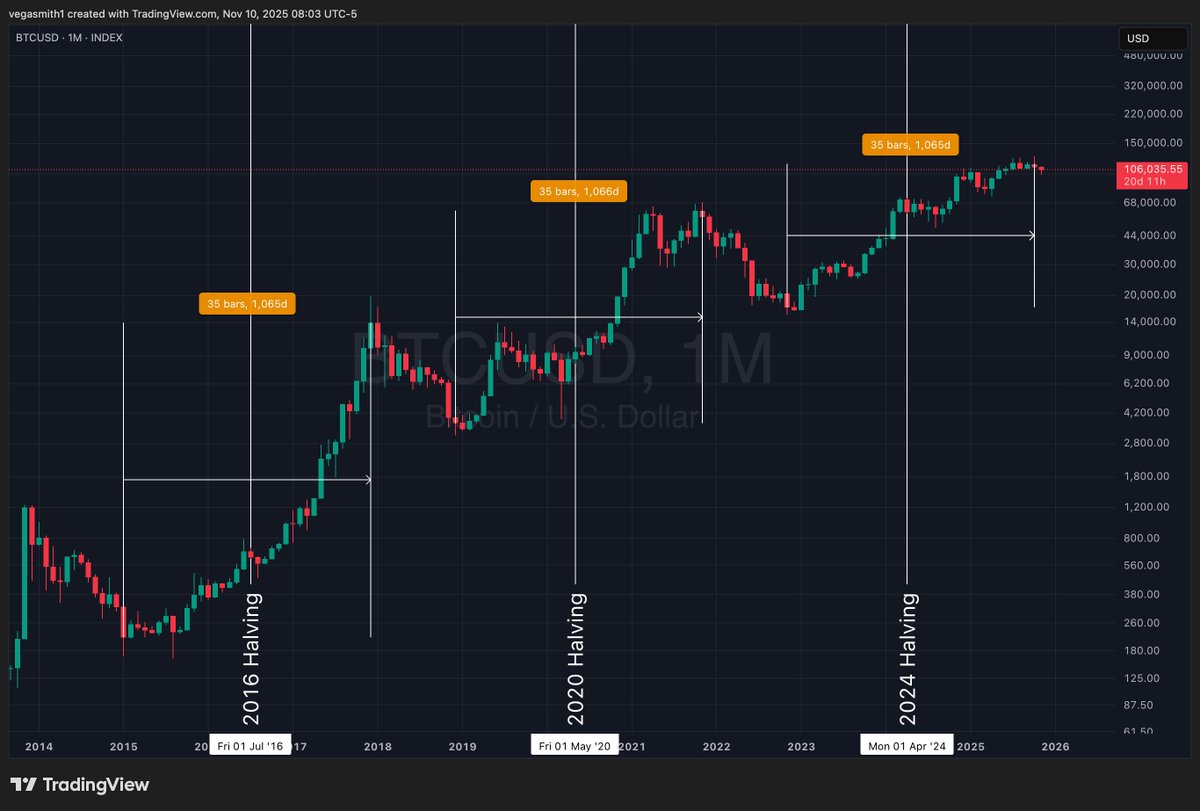
BITCOIN IS TRACKING LIVERMORE’S LEGENDARY ACCUMULATION CYLINDER.
Accumulation. Breakout. Stage 8 vertical phase.
Most people only recognise this pattern after the move.
Miss this phase and you don’t miss a trade…
You miss a generational run.
Structure over opinions.
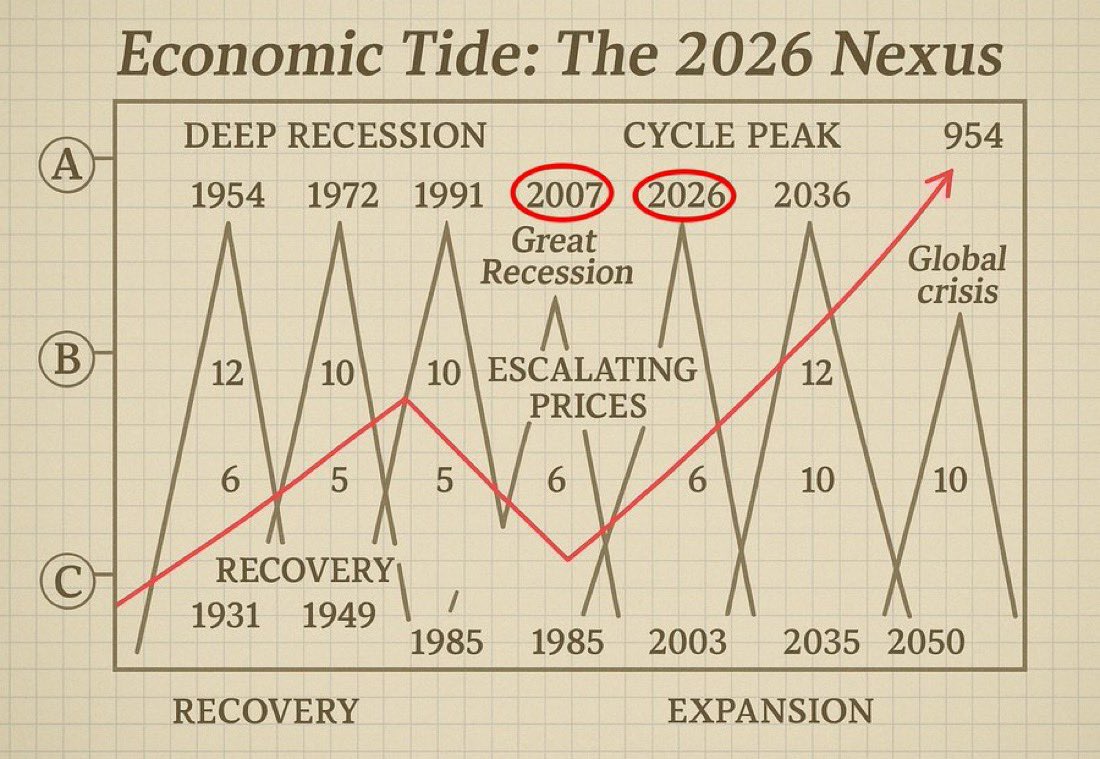
🚨 HEAR ME OUT NOW!!!!
A Major Financial Shock Is Lining Up for 2026 and the Warning Signs Are Already Here.
Something big is coming for 2026. And no, it’s not another banking meltdown or a typical recession cycle. This time, the pressure is sitting right at the core of the global system: sovereign bonds.
The first red flag? The MOVE index. Bond volatility is waking up.
Right now, three silent fault lines around the world are straining at the same time:
1️⃣ U.S. Treasury funding
2️⃣ Japan’s yen and carry-trade system
3️⃣ China’s overleveraged credit machine
Any one of these snapping would be enough to shake the world. All three converging in 2026? Everything falls apart.
Let’s start with the one building the fastest: a U.S. Treasury funding shock.
In 2026, the U.S. has to issue record levels of debt. At the same time, deficits are ballooning, interest costs are climbing, foreign demand is fading, dealers are stretched thin, and auctions are showing stress.
In other words: the perfect recipe for a failed or severely strained long-end Treasury auction.
And this isn’t speculation. It’s already visible in the data: weaker auctions, bigger tails, fading indirect bids, rising volatility at the long end.
If this feels familiar, it should. This is exactly how the UK’s gilt crisis kicked off in 2022. Only now, the scale is global.
Why does this matter so much? Because everything takes its cue from Treasuries: mortgages, corporate credit, global FX, emerging-market borrowing, repo markets, derivatives, collateral.
If the long end shakes, the entire system shakes.
Now layer Japan on top of this.
Japan is the world’s biggest foreign buyer of Treasuries, and the backbone of global carry trades. If USD/JPY rockets to 160–180, the BOJ has to step in, carry trades start to unwind, Japanese pensions sell foreign bonds… and Treasury volatility shoots even higher.
Japan doesn’t just get hit, it amplifies the shock.
And then there’s China.
Behind the curtain sits a $9–11 trillion local-government debt bubble. One major LGFV or SOE failure → yuan devalues → emerging markets panic → commodities jump → the dollar spikes → U.S. yields jump again.
China becomes the second amplifier in the chain.
So what actually sets off the 2026 event?
➡️ A weak U.S. 10-year or 30-year auction.
One bad auction could be the moment yields spike, dealers step back, the dollar surges, global funding tightens, and risk assets are forced to reprice all at once.
Here’s what happens next.
Phase 1:
Long-end yields explode higher.
The dollar rips upward.
Liquidity disappears.
Japan intervenes.
The offshore yuan drops.
Credit spreads widen.
Bitcoin and tech sell off hard.
Silver trails gold.
Equities fall 20–30%.
This is a funding shock, not a solvency crisis and it moves fast.
Then comes the inevitable central-bank response: liquidity injections, swap lines, Treasury buybacks, maybe even temporary curve control.
It stabilizes the system… but it floods it with liquidity.
And that liquidity sets off Phase 2.
Phase 2 is where the opportunity shows up: real yields collapse, gold breaks out, silver leads, Bitcoin recovers, commodities surge, and the dollar finally peaks.
That’s the start of the 2026–2028 inflation wave.
Why does everything point to 2026?
Because multiple global stress cycles are all hitting their peak at once.
And the early-warning signal is already blinking: the MOVE index is climbing.
When MOVE + USD/JPY + the yuan + 10-year yields all start pushing in the same direction…
…you’re looking at a 1–3 month countdown clock.
Final thought: The world can absorb a recession.
What it can’t absorb is a disorderly Treasury market.
2026 is when that pressure finally breaks.
First with a funding shock, then with the biggest hard-asset bull run of the decade.
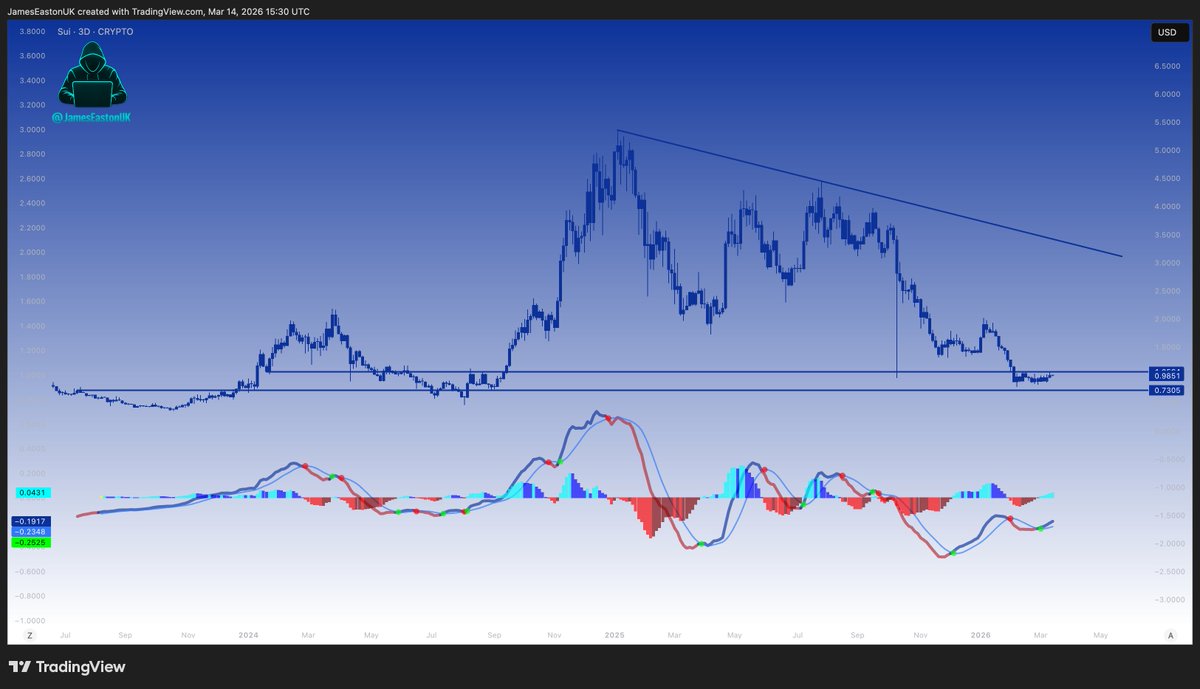
This Gann Square is projected from the $BTC all-time low using Gann ratios and scaling (no curve fitting). So this is an all-encompassing BTC Gann Square.
What's interesting is that the 2013 & 2017 bull runs topped exactly at an arc.
Each cycle, BTC fell to the next Gann angle and followed that trajectory.
Yes, the 2021 cycle however feels orphaned and had no interactions with the square.
Yesterday's BTC correction now finds itself exactly at the next Gann angle lower.
Will it now latch on to this trajectory? Could we see another top at an arc?
The first arc above will take BTC to around $180k. This number keeps popping up in my analysis from different angles.
Hmmmmm.
@martian_wallet Hello Martian Team, who can help me? Unfortunately, my coins are no longer displayed in my wallet. Everything is gone. But that can't be right, because I can see that I still have my coins in APtos Explorer. What should I do? Thank you very much.
https://t.co/adECN7ovw8


![Onil_coder's tweet photo. Over 80 AI tools to finish months of work in mere minutes🪄
1. 𝐑𝐞𝐬𝐞𝐚𝐫𝐜𝐡
- ChatGPT
- Copilot
- Gemini
- Abacus
- Perplexity
2. 𝐈𝐦𝐚𝐠𝐞
- Fotor
- Dalle 3
- Stability AI
- Midjourney
- Microsoft Designer
3. 𝐂𝐨𝐩𝐲𝐖𝐫𝐢𝐭𝐢𝐧𝐠
- Rytr
- Copy AI
- Writesonic
- Adcreative AI
4. 𝐖𝐫𝐢𝐭𝐢𝐧𝐠
- Jasper
- HIX AI
- Jenny AI
- Textblaze
- Quillbot
5. 𝐖𝐞𝐛𝐬𝐢𝐭𝐞
- 10Web
- Durable
- Framer
- Style AI
6. 𝐕𝐢𝐝𝐞𝐨
- Klap
- Opus
- Eightify
- InVideo
- HeyGen
- Runway
- ImgCreator AI
- Morphstudio .xyz
7. 𝐌𝐞𝐞𝐭𝐢𝐧𝐠
- Tldv
- Otter
- Noty AI
- Fireflies
8. 𝐒𝐄𝐎
- VidIQ
- Seona AI
- BlogSEO
- Keywrds ai
9. 𝐂𝐡𝐚𝐭𝐛𝐨𝐭
- Droxy
- Chatbase
- Mutual info
- Chatsimple
10. 𝐏𝐫𝐞𝐬𝐞𝐧𝐭𝐚𝐭𝐢𝐨𝐧
- Decktopus
- Slides AI
- Gamma AI
- Designs AI
- Beautiful AI
11. 𝐀𝐮𝐭𝐨𝐦𝐚𝐭𝐢𝐨𝐧
- Make
- Zapier
- Xembly
- Bardeen
12. 𝐏𝐫𝐨𝐦𝐩𝐭𝐬
- FlowGPT
- Alicent AI
- PromptBox
- Promptbase
- Snack Prompt
13. 𝐔𝐈/𝐔𝐗
- Figma
- Uizard
- UiMagic
- Photoshop
14. 𝐃𝐞𝐬𝐢𝐠𝐧
- Canva
- Flair AI
- Designify
- Clipdrop
- Autodraw
- Magician design
15. 𝐋𝐨𝐠𝐨 𝐆𝐞𝐧𝐞𝐫𝐚𝐭𝐨𝐫
- Looka
- Designs AI
- Brandmark
- Stockimg AI
- Namecheap
16. 𝐀𝐮𝐝𝐢𝐨
- Lovo ai
- Eleven labs
- Songburst AI
- Adobe Podcast
17. 𝐏𝐫𝐨𝐝𝐮𝐜𝐭𝐢𝐯𝐢𝐭𝐲
- Merlin
- Tinywow
- Notion AI
- Adobe Sensei
- Personal AI
18. 𝐒𝐨𝐜𝐢𝐚𝐥 𝐦𝐞𝐝𝐢𝐚 𝐦𝐚𝐧𝐚𝐠𝐞𝐦𝐞𝐧𝐭
- Tapilo
- Typefully
- Hypefury
- TweetHunter
[Bookmark this post🔖]
Must follow @Onil_Coder for more AI tools smart creators use 🪄👇](https://pbs.twimg.com/media/HGW1mftaAAAWZRO.jpg)