Gonna be closing out my participation on Twitter over the next few months. The misinformation and electioneering by Musk is beyond the pale at this point and I really can't stick around any longer. Already active at Bluesky so find me there https://t.co/ibgpVvGtRD
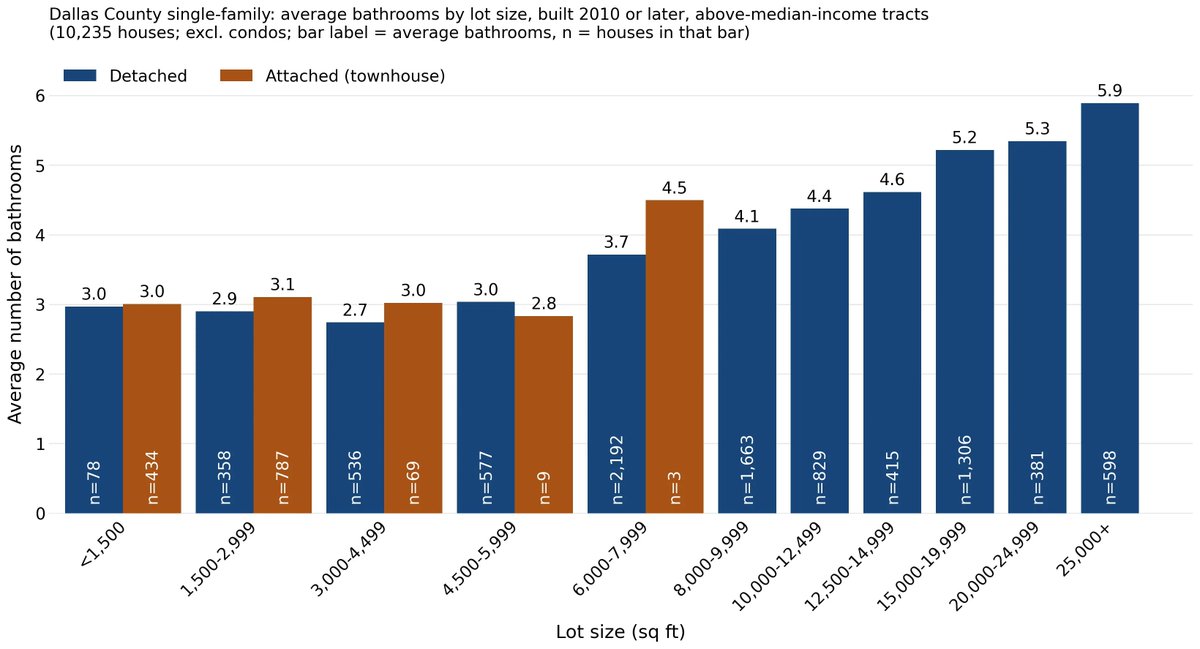
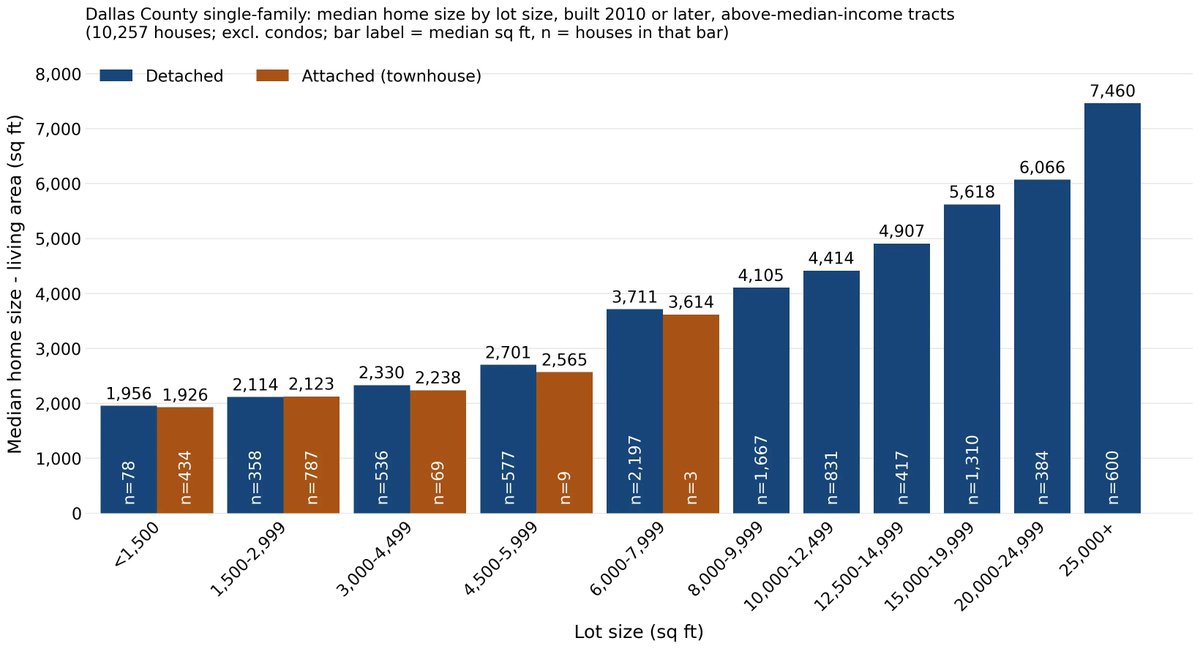
The lesson here is clear: Even in a county without a robust policy allowing for small lot homes, the relatively few new homes built on smaller parcels (under 5k or 3k sq. ft.) are consistently smaller—but still family-sized—and thus more affordable https://t.co/FRXzexmmtq
I've got various other figures in there too. Here are bar charts for median home size, average bedrooms, and average bathrooms by lot size band. This is partly intended to address the opposite critique, that small lots will only produce "tiny homes"
Figure 4 is further evidence that land values determine home sizes. On the y-axis, I replace lot size with land value, and I remove the tract-level income restriction. The relationship is very clear, with higher land values consistently associated with larger new homes.
Figure 3 is the same as #1, but for n'hoods with hh income *below* the county median. The clear relationship btwn lot size and home size breaks down, which I argue is due to lower land values: they're not exerting pressure to build bigger and maximize your investment in land.
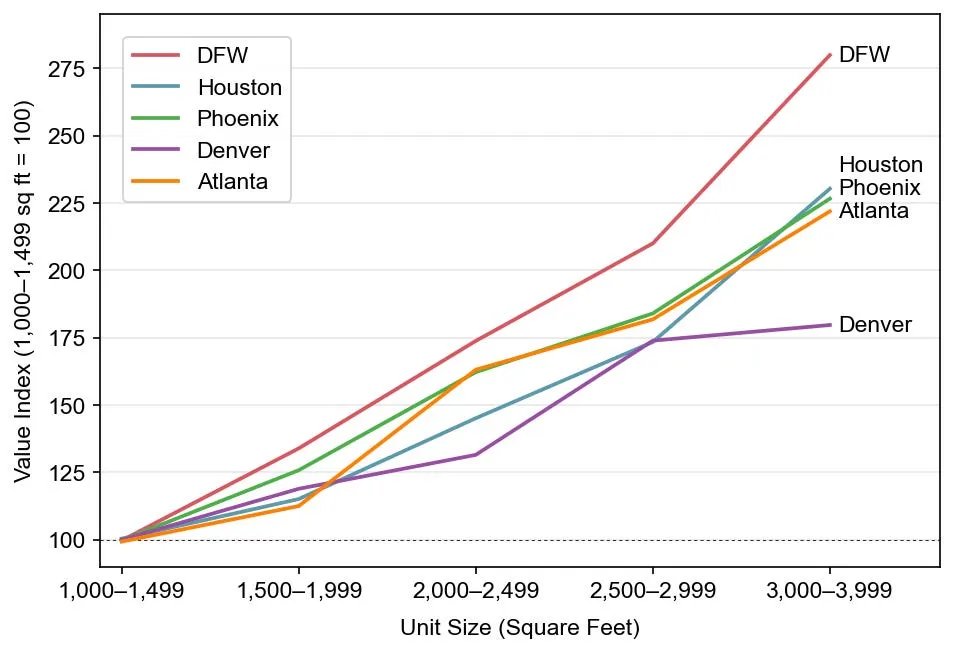
This figure shows that home size *does* matter a great deal for the price of housing, even when other characteristics are held roughly constant. So when lot sizes are smaller, we're not just benefiting from lower land cost, but lower improvement/construction cost as well.
Figure 2 shows relative values, inclusive of land, for homes of increasing size in five major metro areas including Dallas, holding constant home type (single-family detached), tenure (owner-occupied), lot size (1/8 to 1/4 acre), and building age (1980–1999).
Very clearly, smaller lots are associated with smaller new homes. For example, for parcels 1,500-2,999 sf. in size, the most common new home size was 2,000-2,249 sf. For parcels 20k sf (about half an acre) and above, the typical new home is over 6k sf. It's a smooth progression
New analysis on my Substack showing that smaller lots are strongly associated with smaller, more affordable houses. The analysis centers on a place you've probably never heard talked about in the minimum lot size reform conversation: Dallas County, TX. https://t.co/FRXzexmmtq
This shows the frequency of different lot size and home size combinations in Dallas County, restricted to single-family houses built 2010 or later in n'hoods with median incomes above the countywide median. Darker squares represent more common home sizes within a lot size band
This is a response to the criticism that allowing homes on smaller lots won't produce more affordable homes, and instead will just lead to huge unaffordable homes on small parcels of land. It certainly happens, but is it the norm? I'll highlight a few figures from the post here.
In this week's UCLA Housing Voice podcast reading list, we talk about research into conditions most likely to lead to redevelopment, infrastructure costs for urban vs. suburban housing, early impacts of a major Los Angeles zoning reform, and more. https://t.co/05n66izGzP
This tool is something I've wanted to create for years, and thanks to Claude Code I was finally able to do it in a reasonable amount of time. It's still very much a work in progress, so give it a spin and let me know what could be improved. https://t.co/KMwmv1cHt2
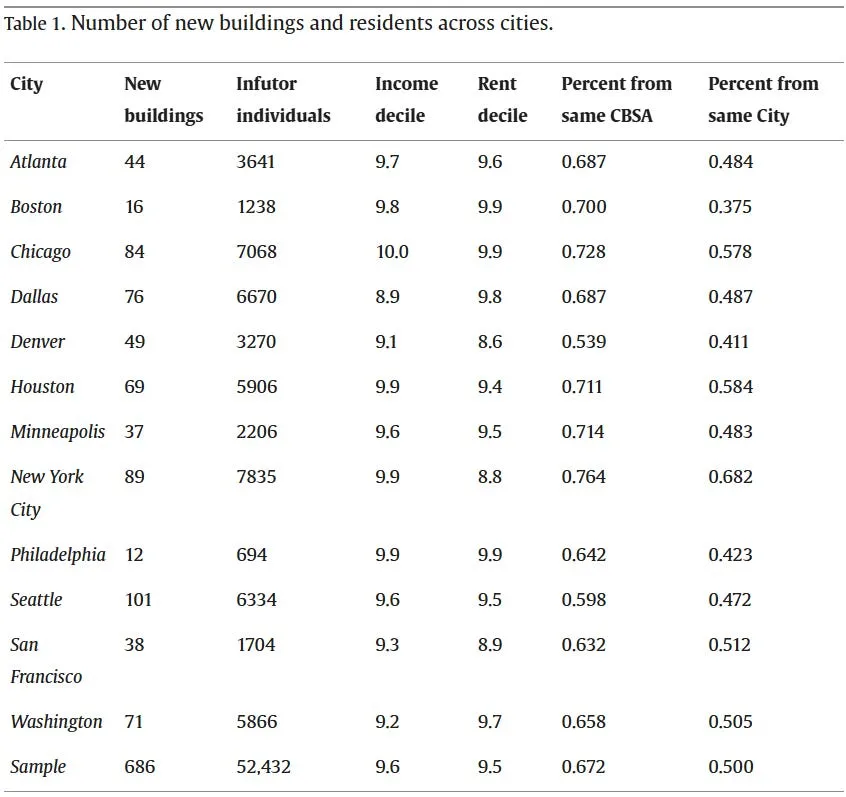
Who lives in new housing? I built this dashboard showing the share of people who moved in the past year who came from another metro, >100 miles away, etc. The main takeaway: People moving longer distances aren't attracted by new housing. Read more here: https://t.co/KMwmv1cHt2
- These migration patterns are at the heart of the moving chain research by Mast (2023) and others. Mast found that roughly 60–70% of people moving into new market-rate apartments came from the same metro, mirroring the 30–40% coming from outside the metro seen in this dashboard
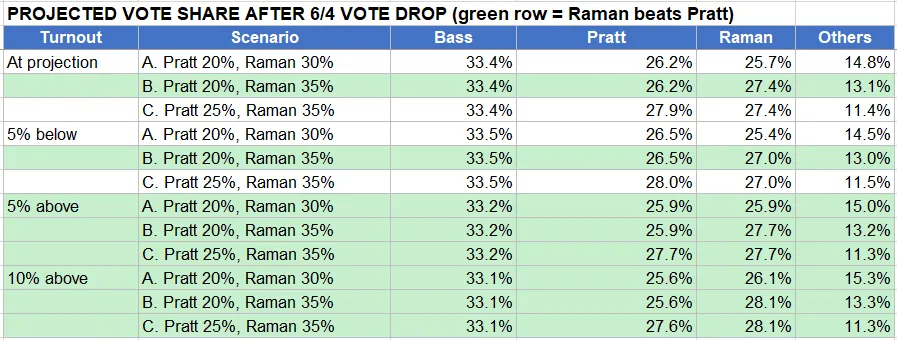
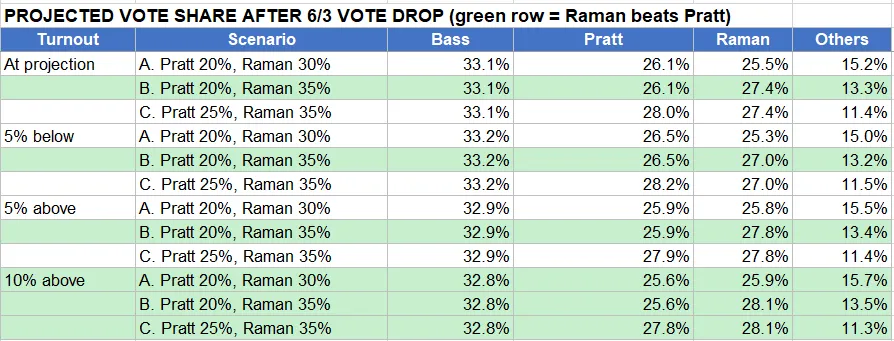
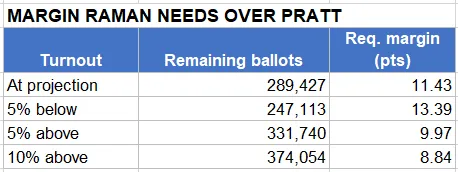
Updates based on today's vote drop. Of the 12 scenarios I posted yesterday, Raman beat Pratt in 6. After the 6/4 vote drop, she wins in 8. If turnout meets projections, she needs an ~11.4 point margin over Pratt. Her margin was 10.4 in the 6/3 drop and 13.3 today.
To be clear, my scenarios were informed speculation about possibilities, not projections. That Raman won in 6 of 12 and then 8 of 12 scenarios doesn't mean her odds of winning have increased from 50% to 67%. The required margins are more informative about her chances, IMO.