Well... this has to be the scariest chart I've ever seen.
Free cash flow and the S&P 500 will eventually converge. The question is where?
HT @renewableworks
The plan is to retire US Treasuries & take them out of circulation. Steve Keen & @paulbuitink get it 🤫👇
Forcing nations to sell them below face value requires a $ shortage (deflationary spiral) which triggers a global insolvency crisis similar to 1929.
https://t.co/p3KcDE3E6D
Let's be honest,the Iranian delegation's performance in Switzerland was a masterclass in psychological and diplomatic leverage.
They arrived on their own terms, made the Americans wait, refused even the symbolic gesture of a handshake, held firm to their demands, and walked away the moment they usual threats from Donald Trump entered the conversation.
In doing so, they projected confidence while exposing the American desperation and weakness.
What stands out is the Persians' sophisticated understanding of symbolism and strategy.
Every move is calculated, every gesture deliberate, as though they are several moves ahead in a chess match while their counterparts is struggling to keep up.
The result is a striking contrast: Iran is composed, disciplined, and in control, while the United States is reactive and outmaneuvered.
It is becoming increasingly difficult to deny the fact that Iran has now emerged as one of the most influential and formidable powers in the Middle East......
Jun 5, 2026 Day Trade Plan:
--------------------------------
yesterday, i said all eyes on the kospi - well, today they had to shut algo trades off after it crashed 5% down at the open
so, typically, how this works is that there are follow through drawdowns to this initial impulsive move down, until levels are too oversold in the short time frame leading to a mechanical bounce - this mechanical bounce then gets mistaken for a "buy the dip" opportunity by the herd (local retail in korea) leading to an "everything back to normal" rally for a failed double top (lower high, same high, or slightly higher high). in any case, the kospi doom crash has started and now we shall just witness the flavor of "hope" the herd prefers to get slaughtered with - slaughter is a strong word, but when a nation's index rises 100% in half a year due to just 2 companies, there's no mincing of reality
again, the reason i watch the kospi is because it is the leading indicator of what is coming to us equities. speaking of which, the /es is showing a little brother version of the kospi's negative divergance, and now, with another sdsi trigger, is set to drop as well. first kospi, then us equities - i think you get the idea here
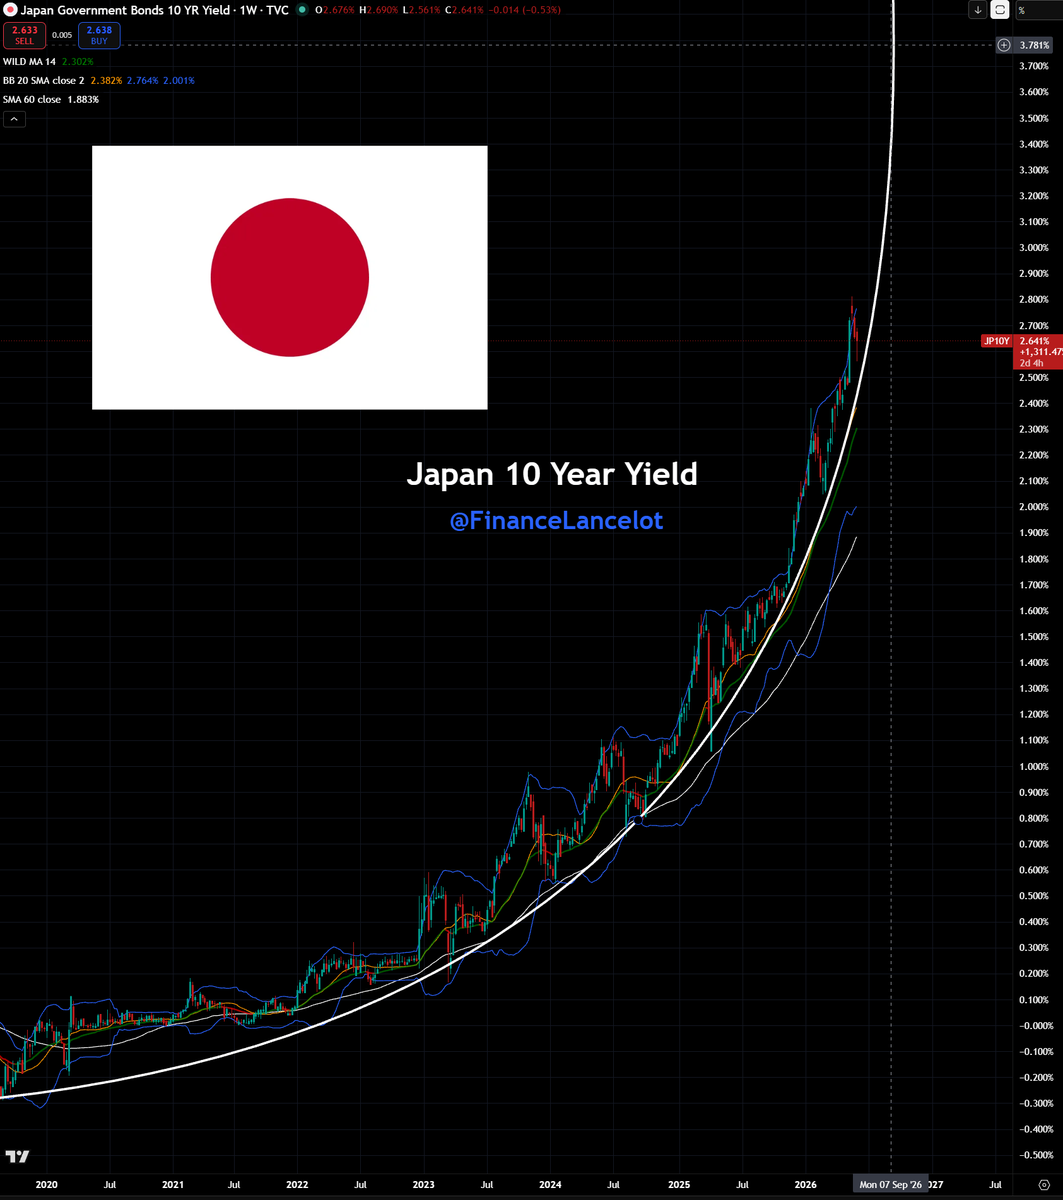
The Japanese Yen is pushing up against 160:1 USD again. Expecting a major intervention soon.
Meanwhile the Japanese 10 year yield is about to go vertical to roughly 4% by September 2026.
At that point the parabolic is going so vertical it's technically going backward in time.
Market Crash Pattern.
Same setup. Every time.
Dotcom Crash: -49.1%
2008 Financial Crisis: -56.8%
Pandemic: -33.9%
The pattern is identical.
THE SETUP
Look at the bottom two charts:
Yield Curve (green): Inverts before every crash
Fed Rate (gray): Cuts aggressively during every crash
This is the playbook.
THE YIELD CURVE
When short-term rates rise above long-term rates, the yield curve inverts.
Dotcom (2000): Inverted → Crash
2008: Inverted → Crash
2020: Inverted → Crash
The yield curve has predicted EVERY recession since 1970.
No false positives.
THE FED RATE
After the yield curve inverts, the Fed eventually cuts rates.
But it's too late.
The damage is already done.
Dotcom: Fed cuts from 6% → 1%
2008: Fed cuts from 5.25% → 0%
2020: Fed cuts from 1.75% → 0%
2026: Fed starting to cut from 5%+
The pattern repeats.
WHERE WE ARE NOW
2026: Yield curve inverted for 2+ years (longest in history)
Fed is starting to cut rates.
The stock market is near all-time highs.
This is EXACTLY the setup from 2000 and 2007.
THE LESSON
The yield curve inversion is the WARNING.
The Fed rate cuts are the CONFIRMATION.
By the time the Fed cuts, it's already too late to avoid the crash.
THE PLAYBOOK
1. Yield curve inverts (WARNING: recession coming in 12-18 months)
2. Market ignores it and keeps rallying
3. Cracks appear (corporate earnings weaken, unemployment rises)
4. Fed starts cutting rates (CONFIRMATION: we're in trouble)
5. Market crashes
We're between step 4 and step 5.
THE QUESTION
Are we different this time?
Or are we following the same pattern as 2000, 2008, and 2020?
History says: Same pattern. Different excuse.
THE TAKEAWAY
The yield curve doesn't lie.
The Fed always cuts too late.
And crashes always feel different until they're over.
Then you look back and realize: It was the same pattern all along.
FACT: New Fed Chair = MARKET DUMP
Look at this closely:
Every time a new chair came to the Fed, the market entered a downtrend
Yellen - major drawdown
Powell - same story, TWICE
This isn't just a hypothesis - we've seen this happen THREE times in a row
Now we’re approaching another transition
I think the market is not pricing this in yet
Be careful around this period - this is where narratives flip fast
Prepare, don’t react
NOTIFS ON!
Semiconductor ETF flows just hit a record.
March: record OUTFLOWS. Panic selling.
April 15th: record INFLOWS. Biggest in 7 years.
The same investors who sold in panic
are now buying back at higher prices.
This is the most expensive pattern in investing.
Sell the low. Buy the high. Repeat.
And here is the contrarian warning.
Record ETF inflows into a sector that is still in overbought territory on the weekly chart.
A large divergence forming.
A top expected in early May.
The crowd just loaded up at exactly the wrong moment.
When everyone rushes in after a panic sell — that is not a buy signal.
That is an exit signal.
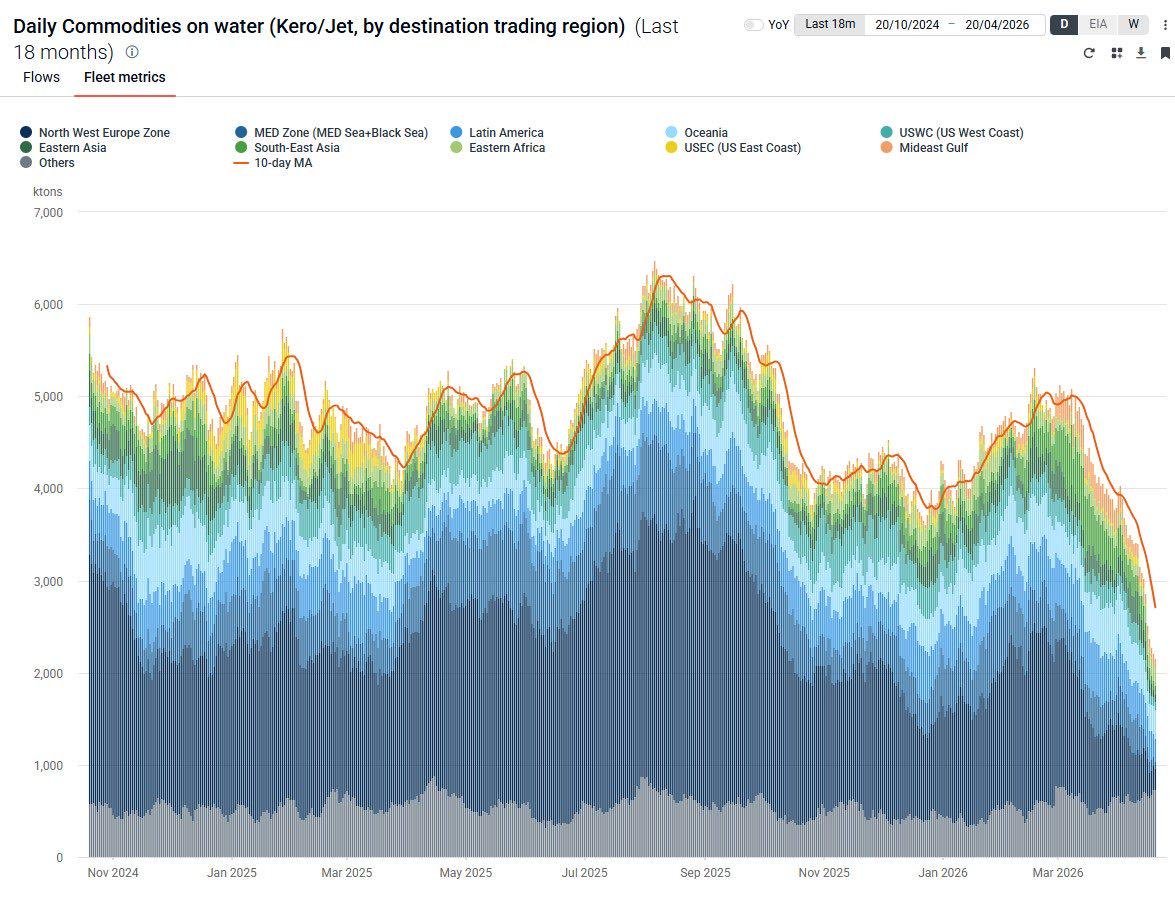
Global energy supply is now down an astounding 60% in the last 60 days!
We've never seen anything like this before.
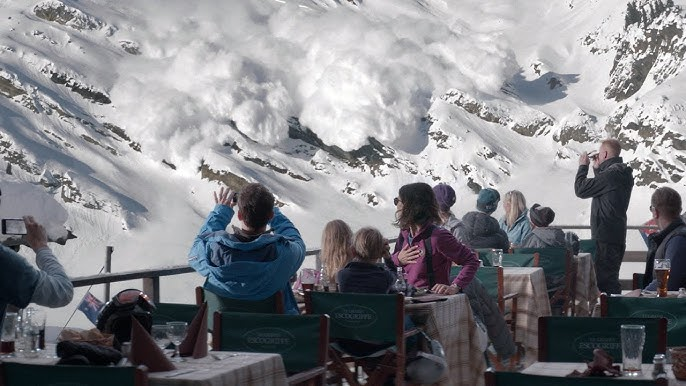
I don't think people fully grasp the tsunami on its way. We're talking lockdowns, travel restrictions and grounded flights.
Not only that, the fertilizer situation is even worse! Expect food shortages in 3-4 months, Arab Spring 2.0 food riots globally, and introduction of a CBDC for food rationing.
BREAKING: 🇺🇸 The U.S. stock market is about to crash according to this Wyckoff pattern.
The classic Wyckoff pattern is currently active on the S&P-500.
What comes next is a massive leg down.
Are you prepared?
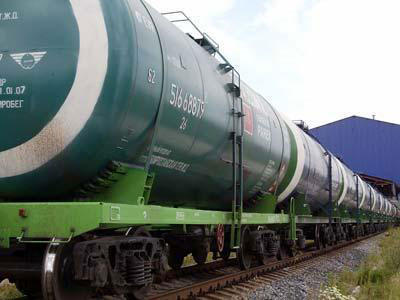
🚨🚨🚨 TEN OIL REFINERIES HAVE BLOWN UP IN 21 DAYS. YOU HAVE NO IDEA WHAT THEY JUST TRIGGERED. 🚨🚨🚨
Since April 3rd, ten oil refineries, power plants, and energy facilities across seven countries have been destroyed by "fires," "explosions," and "accidents."
Let that sink in.
💀 Russia — THREE facilities destroyed in 21 days
💀 India — THREE facilities destroyed in 21 days
💀 Australia — 10 percent of national fuel production GONE in one night
💀 Mexico, Romania, Texas — ALL lost a major energy site in the same 21-day window
💀 Every single one is being reported as "unrelated"
⚠️ The Viva Energy refinery in Geelong, Australia produces 120,000 barrels per day. One fire took that offline for months.
⚠️ Russian refineries have been hit by drones for 18 months — the West cheered. The same signature is now hitting refineries on four continents.
Do you understand the scale of what's happening?
⚠️ There are roughly 600 operational refineries on Earth. Losing 10 of them in 3 weeks is not statistical noise. That is a campaign.
⚠️ Global refining has ZERO spare capacity. Every facility is running at max because post-COVID demand never softened. One lost refinery = real shortages within 60 days.
⚠️ In 2019, a SINGLE attack on Saudi Abqaiq knocked out 5.7 million barrels per day and sent oil up 15 percent in one session. We are watching that same dynamic, distributed across the planet.
They're showing you "isolated accidents."
They're NOT showing you that the exact same signature — unannounced, unclaimed, blamed on "a faulty valve" — is hitting different countries on different continents in the same 21-day window.
Here's the logic — follow it carefully:
→ Refineries on four continents burn in 3 weeks
→ Zero suspects named
→ Zero coordinated response
→ Zero insurance classified as terrorism
→ Every single one gets the same word: "accident"
If these were truly accidents, why is every major insurance carrier quietly rewriting refinery attack exclusion clauses RIGHT NOW?
Complete silence.
This is no longer an energy story. This is a civilization-level infrastructure war hiding behind the word "accident."
this was just part one.. follow me because part two is going to be the one everyone shares. 🚨
.
IT'S 2007 ALL OVER AGAIN!!!
The S&P 500 is Repeating the 2007 Topping Process
NEW HIGHS ON THE S&P 500 & NASDAQ 100
Stock Market Video Here
https://t.co/AAjxrCHWmg
.
$SPY $SPX #SP500 $NDX $QQQ #NASDAQ100 $NQ #stockmarketcrash #oil #Powell $DJIA $DJI $DIA $IWM $RUT $VIX #war #Iran #Trump
🚨 S&P 500 BACK AT ATH 🚨
Do you think this is bullish? Maybe, but local
Globally market is repeating the 2025 move
Look at this:
1: Local top
2: Initial drop
3: Manipulation phase
4: The final flush
We are at Phase 3 - next move DOWN
BTC in this scenario will be VERY bad