Community wind co-ops: stop guessing, start proving your impact. 🌱
Track turbine uptime, carbon savings, financial returns & member engagement — all in one live dashboard. Win grants, retain trust, scale profitably.
See the example 👇
https://t.co/E5nxLaOvC9
#kpi #kpidashboard
#RenewableEnergy #WindEnergy #CleanEnergy
Track appointment volumes, revenue per transaction & staff efficiency all in one place with our Veterinary Clinic KPI Dashboard example.
👉 https://t.co/7pl2MhKo35
#VetClinic#KPI#VeterinaryBusiness#KPIDashboard
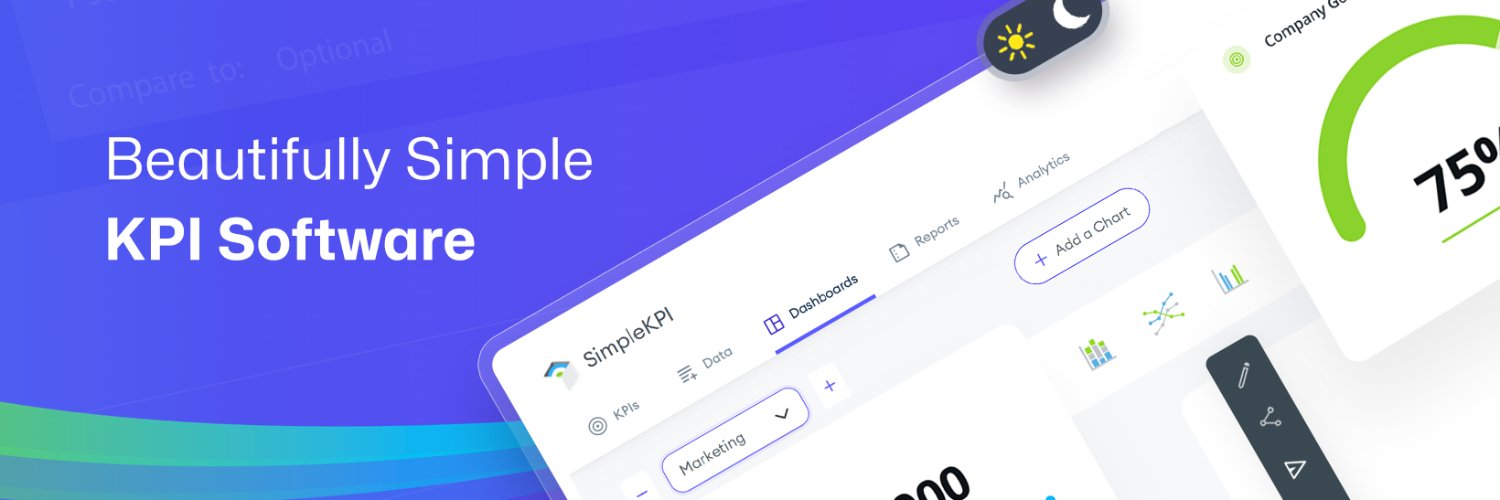
Stop battling spreadsheets for KPI tracking - eliminate version chaos, manual updates, and input errors that turn “reporting” into firefighting. Move your KPIs into a real easy to use KPI Dashboards: https://t.co/KflMuIgMeJ #kpi#kpis#kpitracking#kpispreadsheet
New KPI dashboard example: Youth Homelessness Prevention. Turn your program data into a clear, shareable view of progress and outcomes. https://t.co/0c9BXxdOrd
#nonprofit#ImpactMeasurement
We’ve just launched in‑app support in SimpleKPI: tab-level video walkthroughs, “Learn more” task menus, and an AI assistant that lives right where you track your metrics.
https://t.co/bU6IrPYbIz
Turn ride data into magic. 🎢✨
Monitor wait times, downtime, guest happiness, per-capita spend, and weather impact in one real-time view with this Theme Park Guest Experience dashboard from SimpleKPI. https://t.co/gMHF3BRqTl
#kpitracking#dashboardtemplate
Level up your KPI Dashboard in 2026. ✅
From SimpleKPI to Tableau, this guide breaks down 8 KPI dashboard tools, pricing, and use cases so you can ditch duct-tape spreadsheets and decide faster.
👉 https://t.co/64zi6luLFT
#kpi#kpidashboard#businessdashboard
Ready to track your eco-impact? 🌱 Discover our new Environmental Sustainability KPI Dashboard—monitor energy, emissions, waste, and more in real time. Start building a greener, more efficient business.
https://t.co/LCmp8cSxla
#Sustainability#ESG#KPIs
Elevate your club with live KPIs! Track rounds played, membership growth, revenue, and satisfaction—all in one dashboard. Make course management smarter and keep your players happy.
https://t.co/Hw76IMZxTJ
#GolfClub#KPI#GolfBiz
Take the headache out of fleet management! 🚚 SimpleKPI’s Fleet Dashboard gives you real-time numbers on fuel, costs, downtime, driver scores, and more—all in one view. #FleetManagement#Logistics#KPIs#KPIdashboard
https://t.co/9ozflMbUHW
Uncover 5 quietly powerful SimpleKPI features that level up dashboards fast: Data Users, KPI Notes, Embeddable Charts, Full Screen Auto‑Cycle, and Chart Footer Notes — small tweaks, big clarity 💡📊
#SimpleKPI#KPIDashboards#KPISoftware#KPIReporting
https://t.co/w1fpjVa5tt
Dashboard TV:
Production Dashboards in SimpleKPI help teams monitor and boost performance on the factory floor. KPIs, charts, and actionable insights—all in 1 minute! #DashboardTV#Manufacturing#ProductionKPI#KPIdashboards
https://t.co/nRzLLI9Dp6
Want to make the most of Data Users in SimpleKPI? Check out our in-depth support page for tips on tracking KPIs across products, services, machinery and more.
https://t.co/1CFU0iKhtj
#KPI#SimpleKPI
Want to know if your content is actually landing? Track your Content Engagement Rate! The higher it is, the more your audience is loving what you share. #KPI#ContentMarketing#SimpleKPI
Are you putting all your eggs in one basket? 🧺Track your Lead Source Diversity Rate to build a stronger, more resilient pipeline! The more sources, the safer your growth. #KPI#LeadGen#SimpleKPI
Discover how using SMART (Specific, Measurable, Achievable, Relevant, Time-bound) and SMARTER (plus Evaluate & Revise) frameworks can turn vague goals into actionable, trackable results.
https://t.co/6tfy1xVfSI
#smartkpis#kpis