4. March 2001 to March 2013, Gold has generated 505% return while S&P 500 has generated 33% return (price ratio> 3 years moving avg.). Now, it seems Gold underperformance vis a vis S&P 500 (April 2013 till Aug. 2023) is ending and gold is again ready to shine.
1. It seems Gold is ready to rock again. Assets move in relative terms. Just like Sector rotation, there is asset rotation as well. This is yearly ratio chart of Adjusted Gold vs Adjusted US 10 Year T-Note and 3 year moving Avg. Whenever ratio is above 3 year avg, gold shines..
2. Whenever the price ratio > 12 moving avg, Gold is outperforming and while price ratio < 12 moving avg, stock is outperforming...Signal is very strong and it can be used for switching the asset or asset allocation...
I have calculated Gold/S&P 500 yearly price ratio chart and 12 month moving avg. it's good for asset allocation specially for Gold. I have readjusted the base of both prices for better comparison. Whenever the ratio > moving avg, Gold is outperforming and vice versa..
This is US S&P 500 and US 10 year treasury price ratio chart. whenever 200 DMA is broken, it is correcting massively. presently, .US market look like in very strong uptrend based on historical performance of Bond and stock relationship, enjoi the rally....
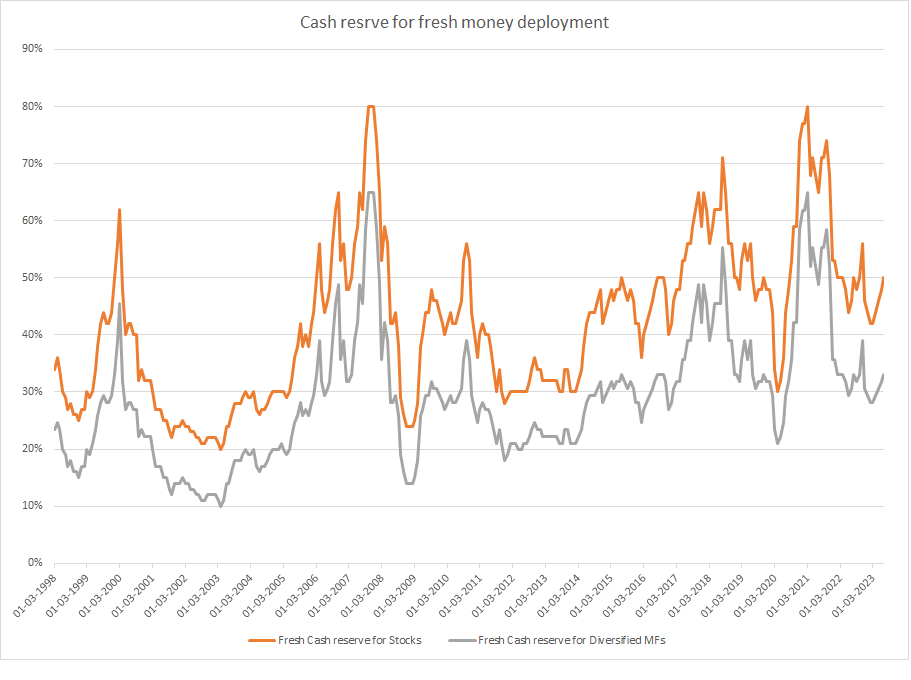
2. The idiot wave can be good tool to decide the allocation of fresh capital in the market. In present juncture if i have Rs. 100 fresh capital, I'll prefer to reserve 50% cash for stocks or 33% cash for diversified Mutual fund which will be gradually utilized if market corrects.
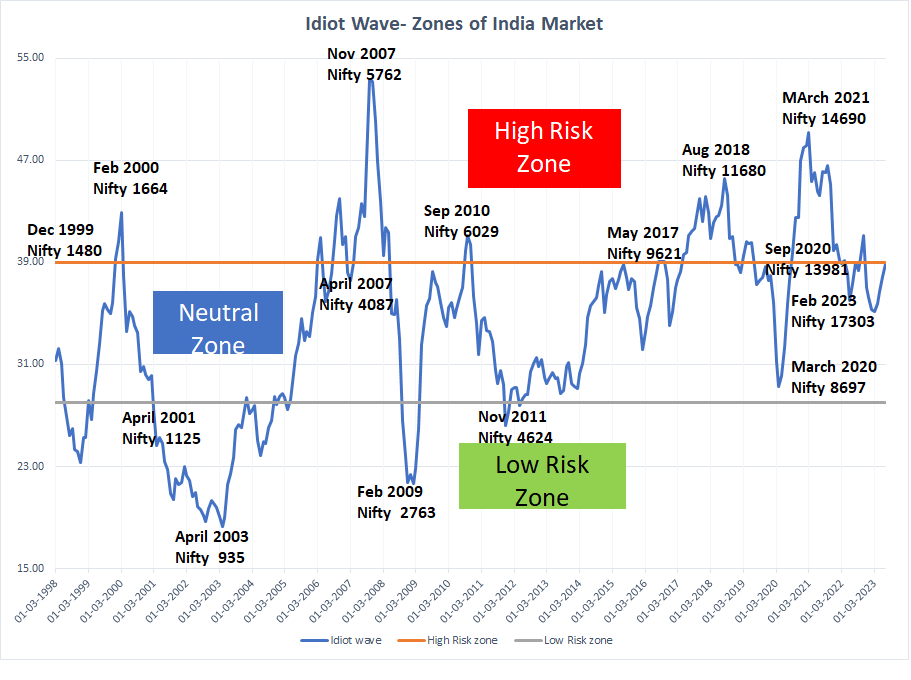
I have created idiot wave. Idiot wave has been created by combining Mcap/GDP,PE,PBV & interest rates. This is the guide which is not only helping me to assess the fresh cash deployment in the market but also helping me for profit booking as well. Presently, we are in neutral zone