Chart Analysis, Small Caps, Option Trading, Ichimoku Expert. All ideas and charts tweeted here are for illustration purposes only, and should not be relied upon
$GOOGL weekly chart!
A Symmetrical Triangle is a technical chart pattern where the price moves in a narrowing range, forming two converging trend lines that signal a period of market consolidation before a breakout
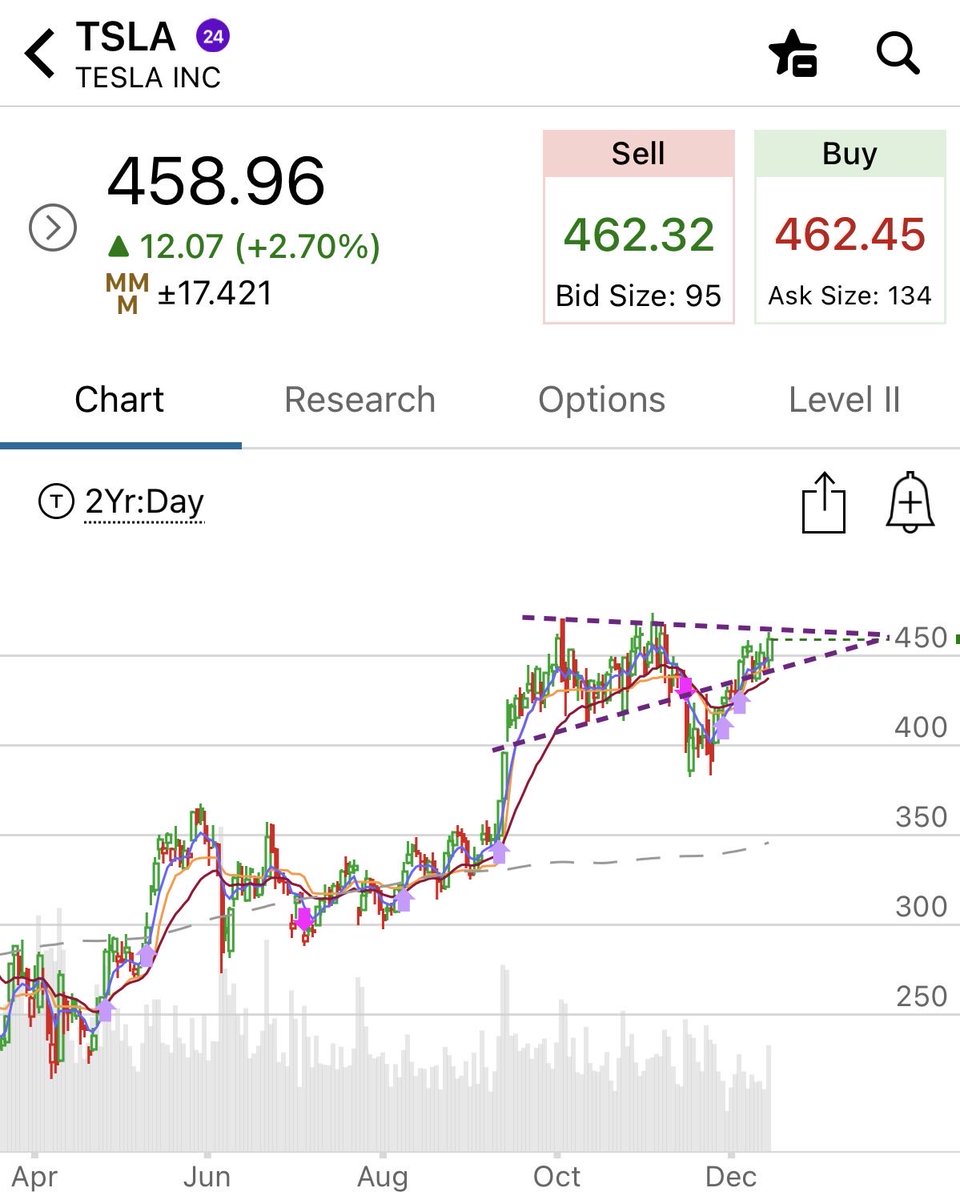
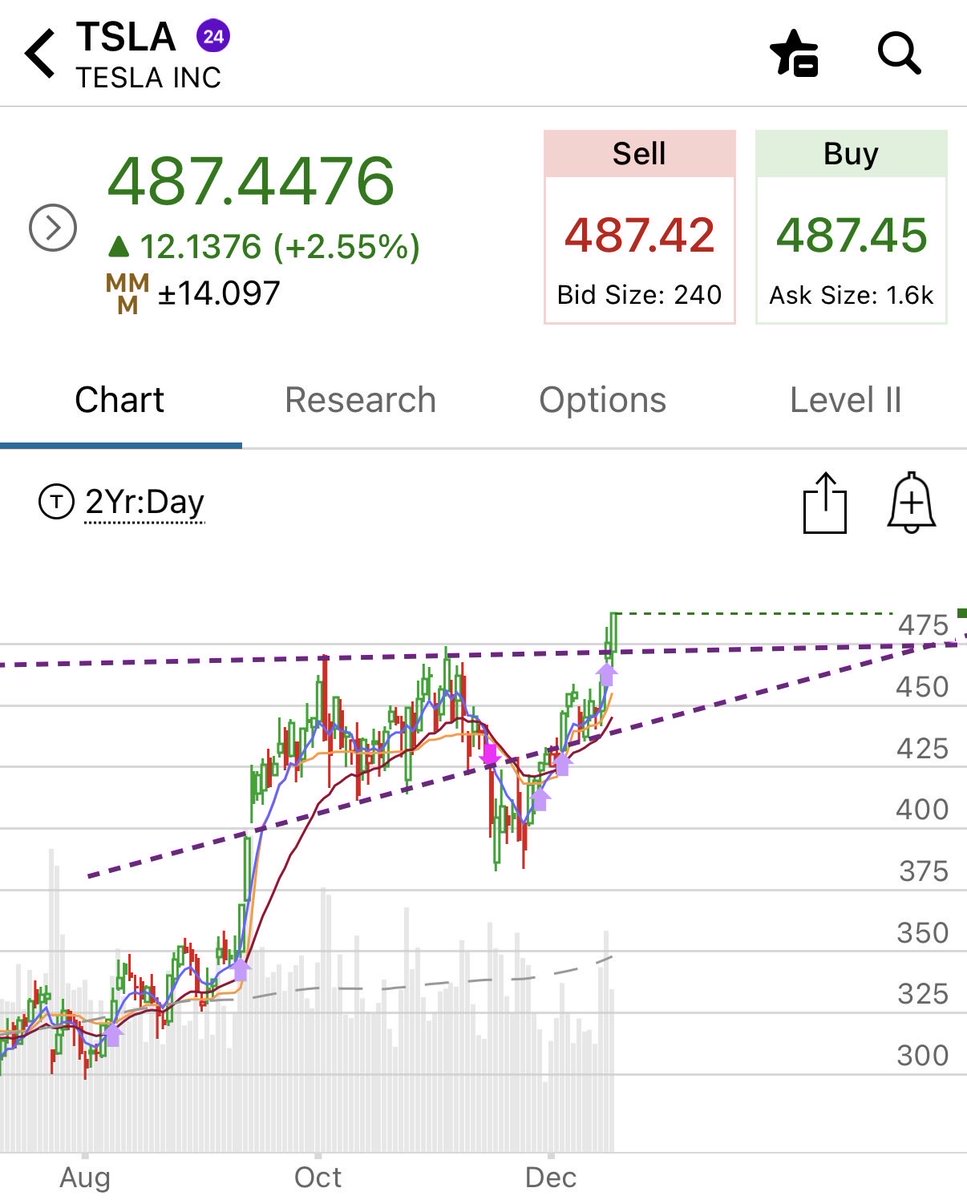
$TSLA , after failed ascending triangle pattern in November, Tesla is back to form ascending triangle. Break out is not far away, but waiting patiently until receive the confirmation #Tesla#Teslastock#trading
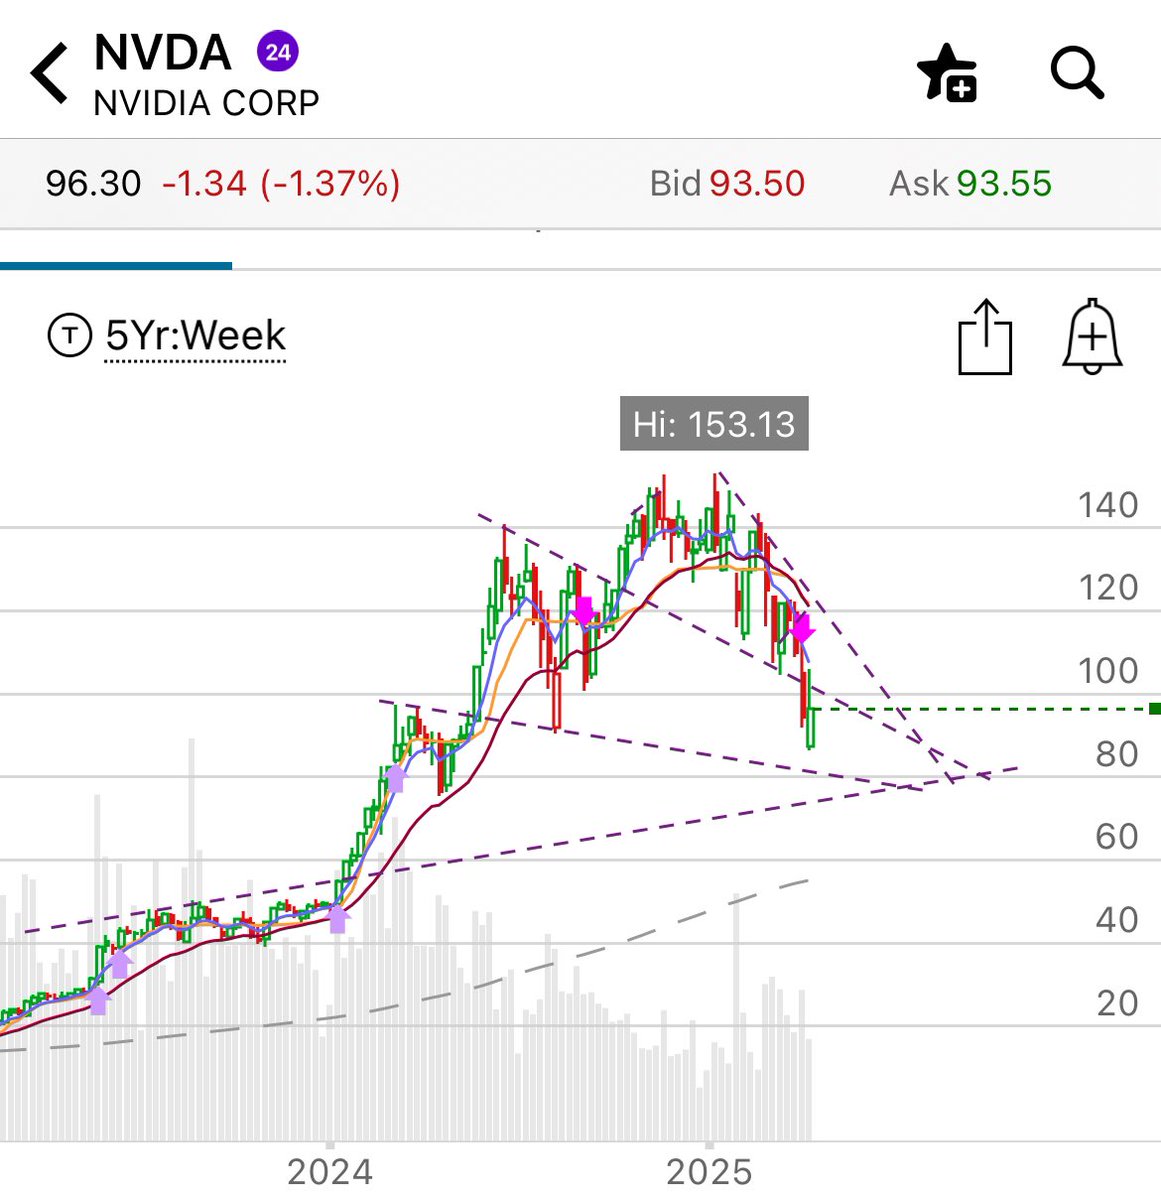
$NVDA , more downside as market is selling off! It should follow the path inside the blue short dashed lines. Short Position stays open as long as stays under upper blue dashed line.
#NVIDIA#chart#trading
The Eerie Parallels Between AI Mania and the Dot-Com Bubble:
- Investment in AI data centers, increasingly debt-financed, is comparable to the late 1990s telecom network spending.
- Current stock valuations are the most expensive since the dot-com bubble
Source: WSJ #Markets