BTC options currently look fairly priced, with implied and realized volatility closely aligned. In this environment, owning optionality can be attractive — recent realized moves have been larger than what the market priced in, creating opportunities to capture gamma during volatility swings.
#Bitcoin is currently trading near the key support level of $95,000. We may see some market movement on Monday, so let's observe how the market reacts.
At $96K, almost 99% of investors who bought Bitcoin within the last 155 days are now holding at a loss. This highlights how deeply short-term holders have been impacted by the recent drawdown and reflects extreme market stress in the short-term cohort.
#Bitcoin has broken out of the downtrend channel and retested the $100,000 level. However, the market is currently experiencing significant selling pressure following this break, and more selling may occur. To encourage buying, the price needs to reclaim the $100,000 level. The next support level is around $95,000.
Spot market activity has weakened noticeably over the past month, with CVD Bias trending lower across major exchanges. Both Binance (–822 BTC) and aggregate spot CVD (–917 BTC) show sustained net sell pressure and very limited aggressive buying. Coinbase is relatively neutral at +170 BTC, offering little evidence of meaningful buy-side absorption.
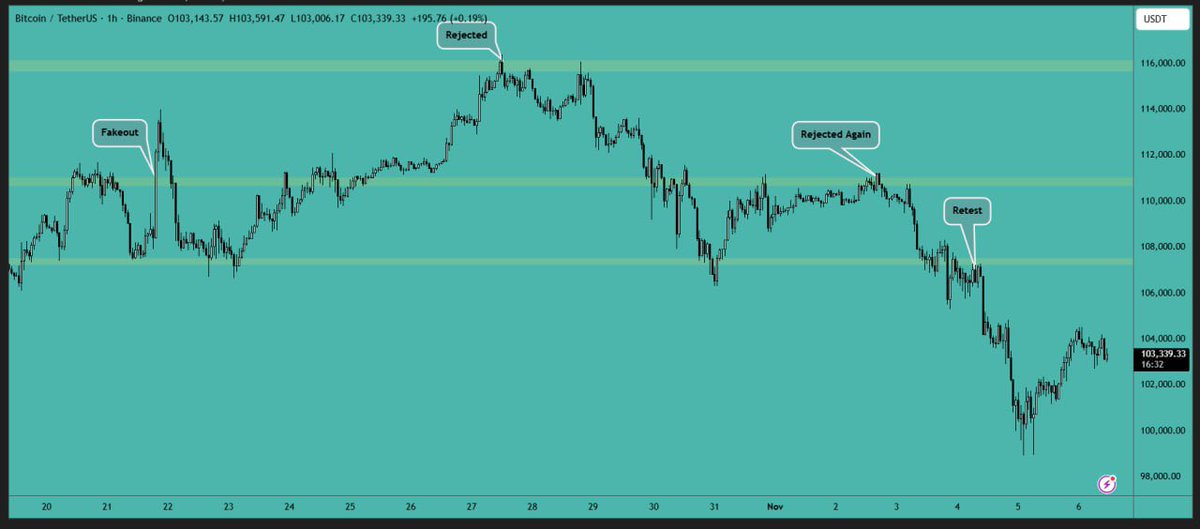
#Bitcoin cannot maintain the $103,000 support level. There is a downtrend channel on lower time frames. A break of this downtrend channel will push the price toward the $107,000-$108,000 resistance level.
#Bitcoin was unable to hold the $105,000 support level and has moved towards the $103,000 area, as expected. The price is currently holding at the $103,000 level, and we might see a bounce from there. A movement towards the resistance area is anticipated.
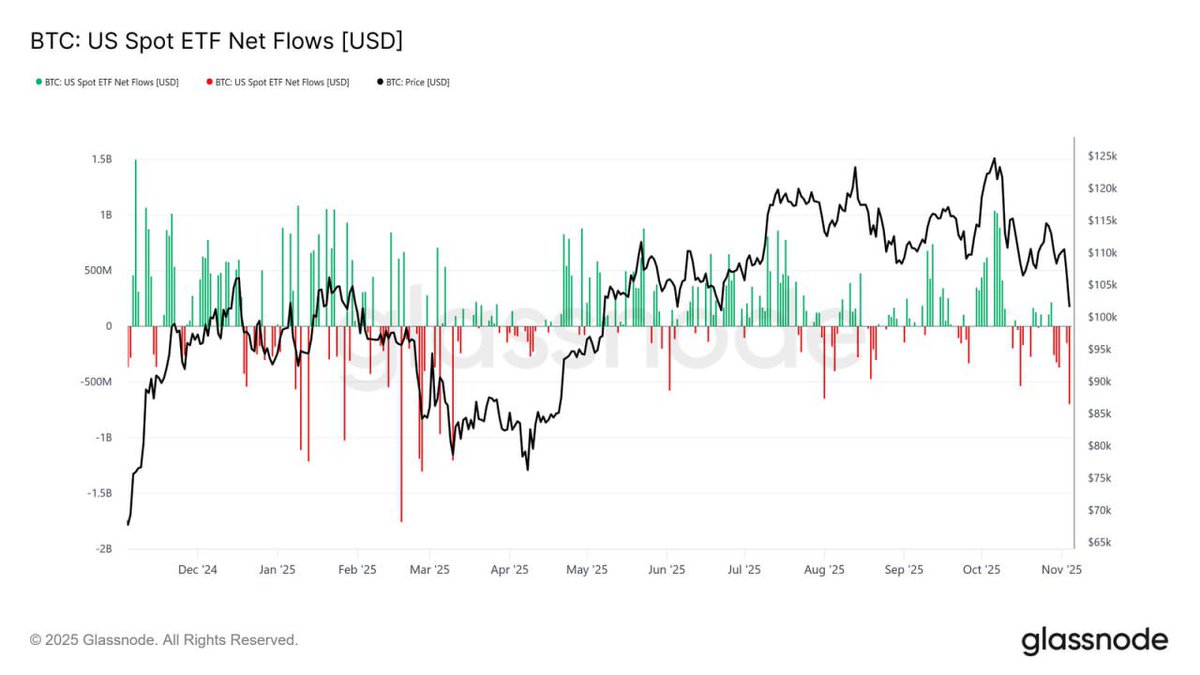
U.S. spot Bitcoin ETFs have slowed sharply, posting daily outflows of $150M–$700M over the past two weeks a clear contrast to the strong inflows seen in September and early October. This shift reflects profit-taking and reduced institutional demand, aligning with broader market weakness and signaling cooling buy-side conviction after months of steady accumulation.
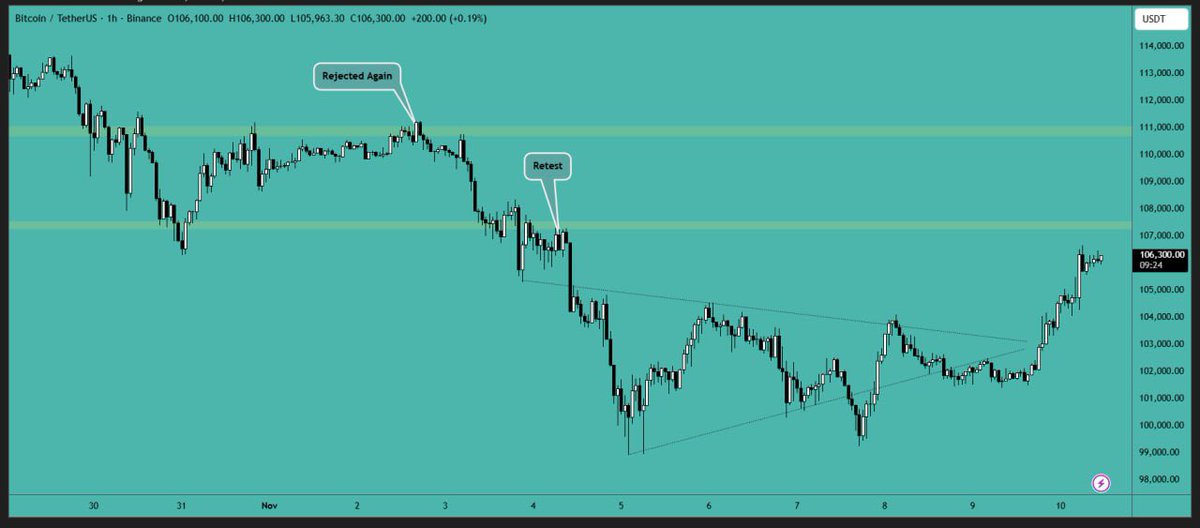
As mentioned, it’s wise not to trust the weekend price movements. After the opening of the global market, the price began to trend upward. Bitcoin started the week with positive momentum, and it will be interesting to see how the market reacts when the US market opens. The next resistance levels are in the $107,000 to $108,000 range, while support is around $105,000.
According to Glassnode, Ethereum’s SOPR has dropped to 0.96, showing that many holders are selling at a loss.
The last time this happened in April, ETH bottomed near $1,500 before gradually recovering a sign this could be another reset phase before a rebound.
Comparing cumulative long-term holder (LTH) spending with net supply change shows that LTHs have spent roughly 2.4M BTC over this period. However, new coin maturations have offset much of this outflow, resulting in a net supply decline of only 0.3M BTC.
Excluding the maturation effect, this spending accounts for around 12% of the circulating supply (2.4M / 19.4M) — a significant flow that highlights the persistent sell-side pressure in the market, even as prices appear relatively stable.
#ADA analysis:
Price is trading in a downtrend channel and is yet to gain momentum. The price needs to break the $0.60 resistance level to inspire some positive sentiment. Open long positions only if there is a break above the $0.60 level.
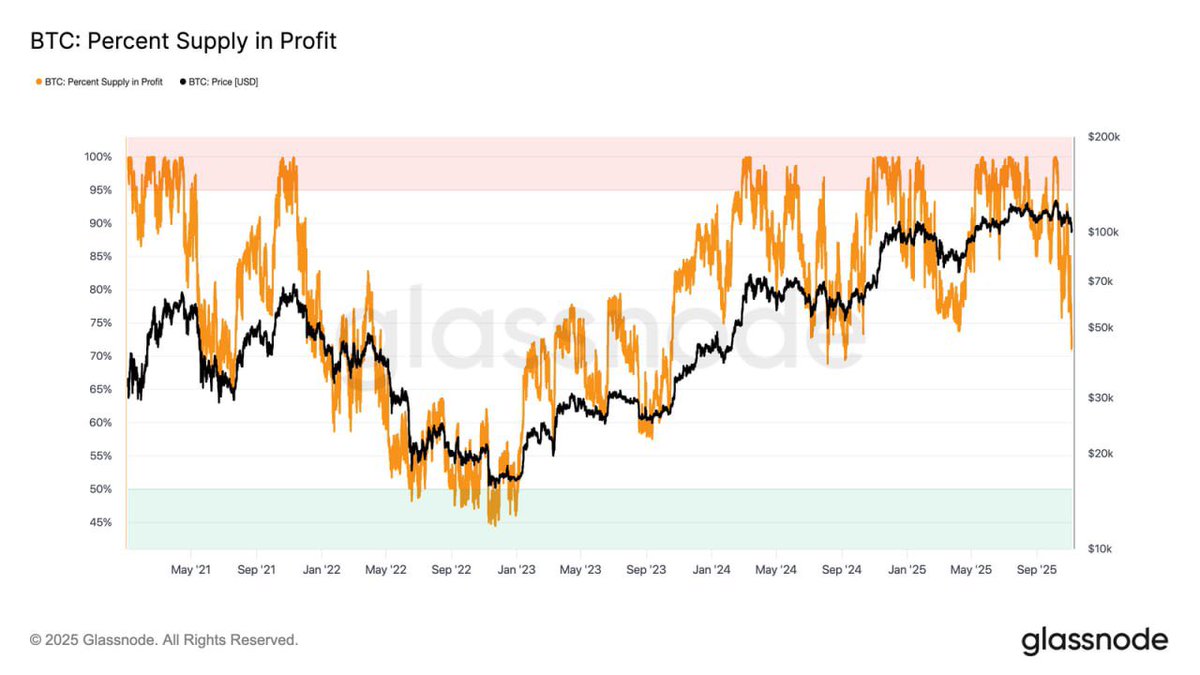
At $100K, around 71% of Bitcoin’s supply is in profit, sitting near the lower end of the typical 70%–90% equilibrium range seen in mid-cycle slowdowns.
This phase often brings brief relief rallies, but a lasting recovery needs renewed demand. A deeper drop could push more supply into loss, risking a shift toward capitulation and extended re-accumulation.
#ETH was unable to hold the support area, resulting in a triggered stop loss for the long position. The price reached the key level of $3000 and bounced back from that point. It has now reclaimed the $3350 level and is currently retesting it. A break below $3300 could send us back toward the $3000 support area.
#XRP analysis:
The price attempted to break through the resistance but was rejected. It is currently making lower lows and needs to break above the resistance area to gain some bullish momentum. You can consider opening a long position here and adding more if the price moves toward the $2.00 level.
Major Resistance Area: $2.65-$2.75
#Bitcoin has reclaimed the $102,000 level and is now trading above it. We may see a move towards the $105,000 resistance area, so let's see how the market reacts there.
Fear & Greed Index: 20
The Crypto Fear & Greed Index has fallen to 20 (EXTREAM FEAR) — the lowest reading in months.
Implications:
* Market sentiment is highly cautious; increased risk of panic selling.
* Such readings often coincide with capitulation phases and can precede short-term bottoms.
#Bitcoin failed to maintain the $102,000 support level and continues to trend downward. The price briefly dipped below $100,000 but is now trading above it. The first resistance level is around the $105,000 area.
#SOL analysis:
The price has broken out of the triangle pattern in a downward direction and has now reached a significant support area. You might consider accumulating some SOL below the $160 level, as we could see a bounce from this point. It’s advisable to set a stop loss just below $150; a break below this level would be bearish.