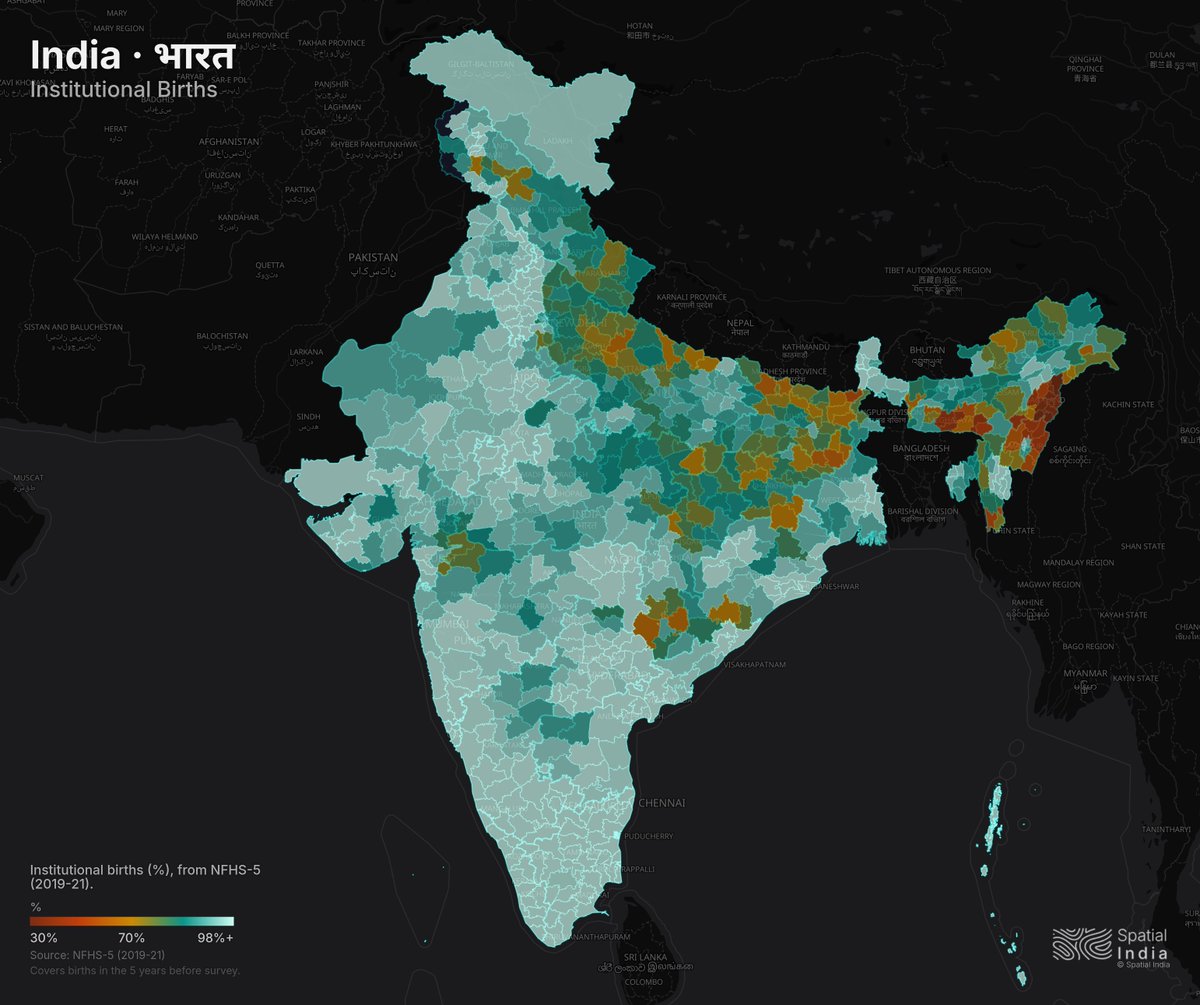
@beatsinbrief 152M tonnes is massive, but who's actually farming this? Over 80% of India's farmers are small & marginal. On Spatial India we mapped marginal farmer concentration — the districts producing the most aren't always the ones where farmers are doing well.
This is exactly why India's Census 2027 matters so much. The last district-level population data is from 2011 when fertility was still above replacement. On Spatial India we map the demographic indicators behind this shift — women's education, child marriage, teen pregnancy — across 800+ districts. Building the infrastructure to serve Census 2027 data the moment it lands.
This is exactly why India's Census 2027 matters so much. The last district-level population data is from 2011 when fertility was still above replacement. On Spatial India we map the demographic indicators behind this shift — women's education, child marriage, teen pregnancy — across 800+ districts. Building the infrastructure to serve Census 2027 data the moment it lands.
Also here's what the drinking water progress looks like — most of the country is glowing bright, which is incredible for a metric that was at 17% just a decade ago!
@Starboy2079 Also here's what the drinking water progress looks like mapped across 800+ districts on Spatial India — most of the country is glowing bright, which is incredible for a metric that was at 17% just a decade ago.
@Tejasvi_Surya This progress is literally visible from space @Tejasvi_Surya Spatial India's NASA night-time imagery shows how India's economic activity looks today — every expressway corridor, industrial cluster, and newly electrified district glowing across 800+ districts.
@IshanTanna1 Great compilation. Spatial India lets you see where this growth landed district by district — clean cooking fuel adoption, drinking water access, electricity coverage, MSME registrations, all mapped.
We built Spatial India to make this kind of progress visible at the district level. You can map sanitation, health insurance, drinking water, and vaccination rates across 800+ districts and instantly see where welfare reach is strong — and where the last mile still needs work. #12YearsOfGaribKalyan
What's even more interesting is where this growth is happening. Tracked NASA satellite night-time lights across 800+ districts on Spatial India — the brightness gains aren't just metros anymore. Smaller cities and industrial corridors are lighting up fast. The spread of growth is the real story.
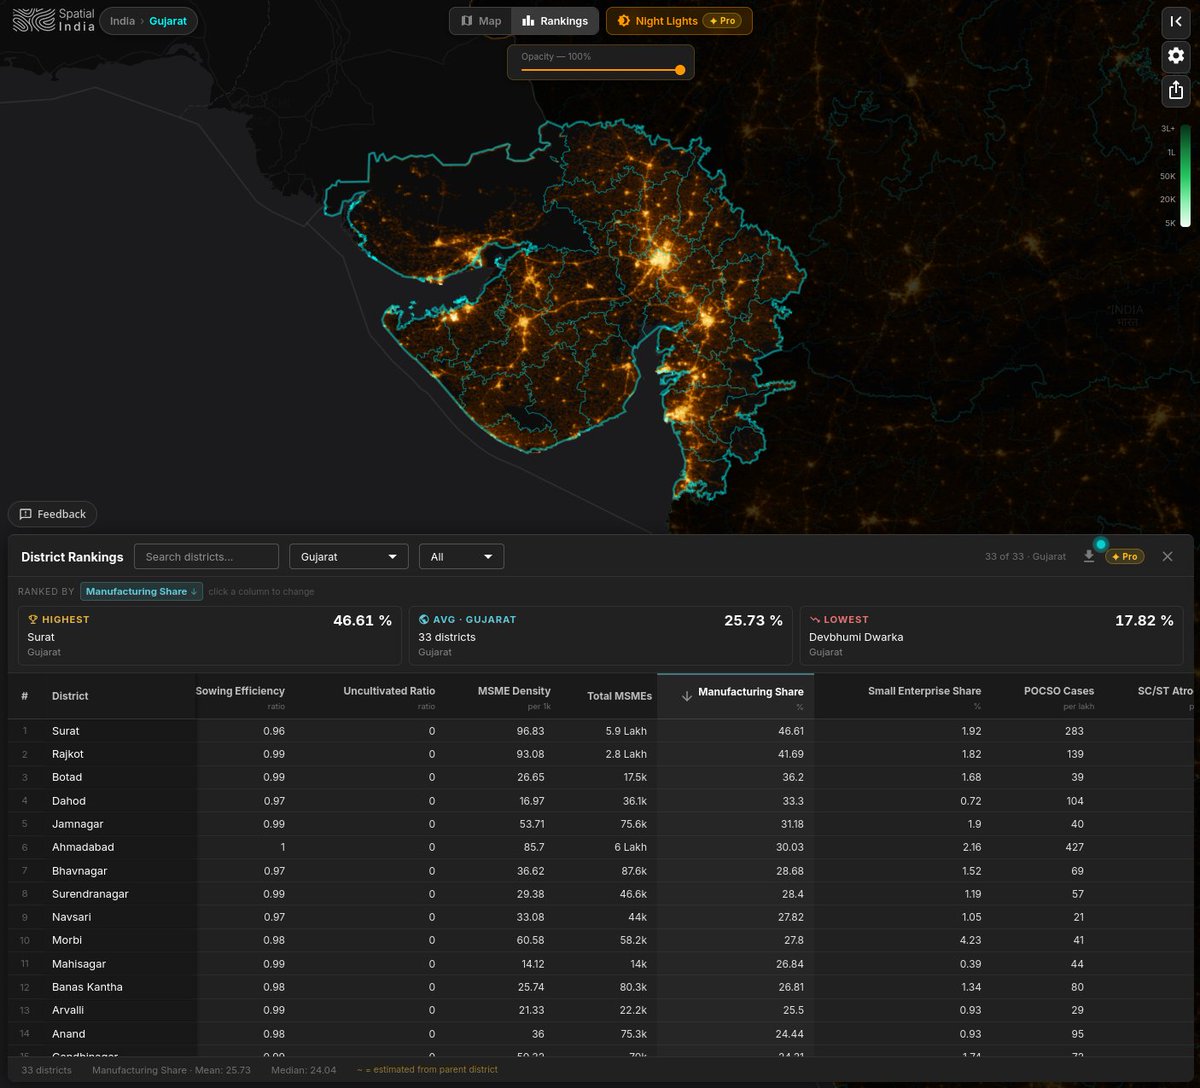
Hazira is fascinating on satellite data — Surat district's night-time light intensity has grown significantly over the last decade, and MSME density there is among the highest in #Gujarat. The defense manufacturing push is building on an already strong industrial base. Great to see it firsthand.
This is a smart play. AP's coastline is massively underrated — longest among major states, and the district-level MSME data shows industrial clusters already forming around those port towns. The real question is whether the hinterland logistics catch up fast enough to serve Russia-bound cargo routes.
@narendramodi Ballia is an interesting district — high climate vulnerability index, dense rural population, and now home to India's 100th Ramsar site. The overlap between conservation-priority areas and development-pressure districts is a pattern worth studying.
The interesting question is which Telangana districts are positioned to drive this. Hyderabad and Rangareddy are obvious, but the night-time lights growth in districts like Medchal-Malkajgiri and Sangareddy over the last decade tells a story. You can track it district by district at Spatial India 🇮🇳
@narendramodi India's district-level economic activity has been visibly shifting — you can actually track it year by year through NASA satellite night-time lights data on Spatial India. Investments like these don't land randomly; they follow where the growth clusters are forming.
We built a tool that lets you explore 800+ Indian district across 75+ indicators. Drill into any state, pull up district profiles, compare metrics — no GIS degree needed.
@Sputnik_India AP's mining districts like Anantapur and Prakasam also happen to have some of the highest MSME growth in the state — you can visualize the industrial clustering at https://t.co/25A740FxFy
AP's coastal districts vary massively in economic density. Visakhapatnam lights up on NASA satellite imagery while districts like Srikakulam and Prakasam are comparatively dark. Five new ports could reshape that entirely. You can see the contrast district by district at https://t.co/1dWdFjWHXh
Surat already lights up as one of Gujarat's brightest on NASA night-time satellite imagery — a proxy for economic density. ₹18,800 crore more in expressways, power grid, and industrial infra will push it further. You can see how #Surat compares to every other district on 78 indicators at Spatial India.
Curious which districts they'll pick. Sugarcane production, MSME density, and vehicle registrations vary wildly across Maharashtra's 36 districts. We mapped all of this at Spatial India — you can literally overlay agricultural output against economic activity to see where ethanol infra makes the most sense.
@narendramodi Before the highway: zoom into Odisha's coast. Khordha glows. The districts between? Much darker. A coastal highway connecting Rameshwar to Paradeep could change that.
See it yourself — district-level data on https://t.co/25A740FxFy