Interesting, so the Bogus/Bonus climate "scientist" blocked me the moment I wrote some argumented critique on the article he/they were promoting. Well, here is the article in question. https://t.co/3v9oSB588i
@cremieuxrecueil@JeremyTColes only if you find it interesting?
An article on measuring the effect of CO2 increase from space have surfaced on my timeline. The article, as I understood, is cherished and cited by climate scientists as a direct evidence of CO2 causing temperature increase on the Earth. Well, since I am scientist myself (not the climate, but energy) I've decided to have a look on the methodology, data, results and assumptions.
So my critique would only apply to general scientific methods, data processing, and fundamental physics and cannot go beyond that obviously. 🕵️♂️
1) There is no formal statistics. Only standard deviations reported but no confidence intervals whatsoever on the difference between theory and observation. Further, all channels are correlated, and in statistics this means that there are no sufficient independent confirmations. At one point, the standard deviation reported in the paper (0.025) was larger than observed noise. Actually it's unclear to me at all how SD was taken.
2) There is a mean-versus-mean comparison which seems to be quite a weak test, e.g. the theory used CO2 set to the 2003-2012 mean increase. It is not stated how multi-year differences were converted into an annual mean. So why not plotting radiance difference against delta CO2 for every year? 🤔 That could be quite stronger test.
3) The authors state that the temperature and humidity changes over 2000-2020 amount to only ~25% of the CO2 signal. If analogue matching had failed completely, the observed curve would still be within 25% of theory. So any unmatched radiance could also agree with theory? But this defies the method's claim that it can separate CO2 from temperature?
4) Theory CO2 uses July values, but analogue search profile of temperature and humidity spans June-August. But CO2 shifts across months and seasons, how can these be matched? The difference can be exactly the paper looks for.
Other points are difficult for me to judge on and require deeper knowledge.
To conclude, I think this the paper is a valid feasibility demonstration but as the evidence is weak on above points. What do other nerds think?
Enormous redispatch and curtailment volumes at this hour in Germany. Wind power is obviously getting hit hard while costs estimate for these measures are running already close to €8.4 mln. Around 6am there was also a serious overfrequency event with max deviation of 130.2 mHz and duration of 1 min 7 sec. That is outside of normal operation bands and can be classified as a stress event.
Jan Rosenow, the man responsible for inflicting unrecoverable damage to energy systems across Europe and especially in Britain. By exercising strong scientific and media influence which, of course, is in line with green ideology and is rewarded handsomely. So now this man states that "Freedom of speech is not freedom for ideas and opinions to go unchallenged by evidence..." Curiuos, but at the same time very much expected.
@Schwarzenegger It's not the fault of people that they hate each other in this context. Politicians around the world created this division, in fact they wanted to have it.
@d_tenn81@BuschEbba You are actually importing electricity in south because of own generation scarcity. Especially after shutting down some of the nuclear. What you need is more nuclear and then you can exit coupled market to have lower prices for yourself
Largest provider of finance example: 300 applications for research grant in energy "transition" of which only 50 are granted because total pot is just €50 mln, that's roughly €1 mln per project (assuming DEI plan is in place). That's not finanicing of cutting edge research, that's a lottery with peanuts.
France looks a little more uncertain but that is also because of the different generation composition (nuclear) for which my model not completely tuned, yet. Though €104/MWh is possible already on 15th November.
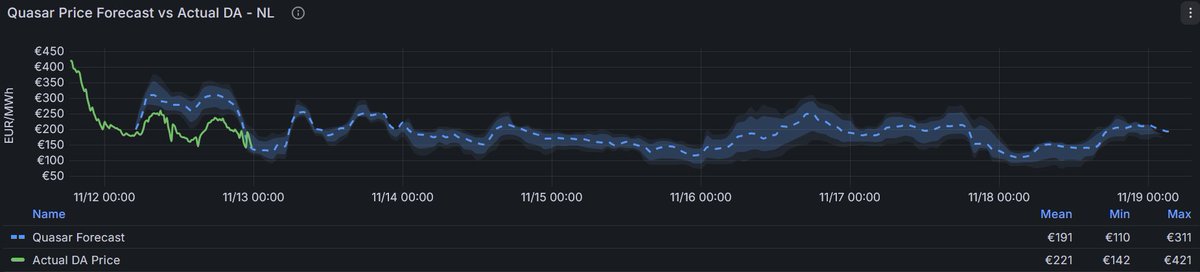
Expecting some relieve in electricity prices in the next 7 days after the roller-coaster week of record high prices. Forecasts below for Germany and the Netherlands. €110-117/MWh is very much possible
@top1percentile@clim8resistance I can't grasp anymore why energy engineering among all is flooded with absolute idiot leaders across Europe. Why not medicine, physics, or space industry for a change? How did this happen?
That's exactly the problem I noticed recently. The uncertainties are simply not quantified and hypotheses are not tested. Large amounts of aggregated data are used with no clue how the aggregation was exactly performed, at best they would call it just "annual mean" and uncertainty narrows down to "standard deviation" with no hints on what was meant by that exactly. Sad.
Just yesterday I was reviewing myself one of such scientific papers which tried to bring up correlation between C02 and radiation. Weakly argumented, quite frankly. Oh, and I was immediately blocked by climate guru who promoted it. They can't even hold an argument. https://t.co/woDvcGc1n7
An article on measuring the effect of CO2 increase from space have surfaced on my timeline. The article, as I understood, is cherished and cited by climate scientists as a direct evidence of CO2 causing temperature increase on the Earth. Well, since I am scientist myself (not the climate, but energy) I've decided to have a look on the methodology, data, results and assumptions.
So my critique would only apply to general scientific methods, data processing, and fundamental physics and cannot go beyond that obviously. 🕵️♂️
1) There is no formal statistics. Only standard deviations reported but no confidence intervals whatsoever on the difference between theory and observation. Further, all channels are correlated, and in statistics this means that there are no sufficient independent confirmations. At one point, the standard deviation reported in the paper (0.025) was larger than observed noise. Actually it's unclear to me at all how SD was taken.
2) There is a mean-versus-mean comparison which seems to be quite a weak test, e.g. the theory used CO2 set to the 2003-2012 mean increase. It is not stated how multi-year differences were converted into an annual mean. So why not plotting radiance difference against delta CO2 for every year? 🤔 That could be quite stronger test.
3) The authors state that the temperature and humidity changes over 2000-2020 amount to only ~25% of the CO2 signal. If analogue matching had failed completely, the observed curve would still be within 25% of theory. So any unmatched radiance could also agree with theory? But this defies the method's claim that it can separate CO2 from temperature?
4) Theory CO2 uses July values, but analogue search profile of temperature and humidity spans June-August. But CO2 shifts across months and seasons, how can these be matched? The difference can be exactly the paper looks for.
Other points are difficult for me to judge on and require deeper knowledge.
To conclude, I think this the paper is a valid feasibility demonstration but as the evidence is weak on above points. What do other nerds think?