$GME
Monthly chart
An update from Dec 6, 2025
The chart appears very similar to the prior post!
GME has continued to move sideways, within a tight range, however, the chart has become more bullish on multiple timeframes!
We had a >3-years bullish falling flag, with a breakout in 5/2024, which followed by a >24-months of re-accumulation with doji-like tiny monthly candles and a side-ways move!
When we break the trading range, the price will likely test the upper edge of the Ichimoku Cloud around $60!
If we are able to go through and above the Cloud, we may test the ATH around $125, within the smaller green channel!
Then, the price may retrace to the upper boundary of the Cloud before it moves back up and into the gray channel (the upper boundary $2500-$3000)!
Note that, since 2020, the GME price structure has evolved within a giant RE-ACCUMULATION SCHEMATIC and therefore is likely a CONTINUATION PATTERN!
Good luck!
$GME
Monthly chart
We had a >3-years bullish falling flag, with a breakout in 5/2024, which followed by a >15-months of re-accumulation with doji-like tiny monthly candles and a side-ways move!
When we come out of the current trading range, the price will likely test the ATH around $125 (red arrow) and primarily move within the green channel (the upper boundary $125-$150)!
After that, the price may retrace to the upper boundary of the Cloud, and then likely move back up and into the gray channel (the upper boundary $2500-$3000)!
Note that, since 2020, the $GME price structure has evolved within a giant RE-ACCUMULATION SCHEMATIC and therefore is likely a CONTINUATION PATTERN!
Good luck!
💥💥💥
$AMC
Daily and the weekly charts
The price is above the daily 200 MA, and also broke through the multi-year resistance line, rendering AMC BULLISH!
The price is also above the weekly 50 MA, at 2.09!
The next resistance level: the weekly 100 MA at $2.98; inside the Cloud!
💥
@holypopcornNFT@_uncleluc Agree! Usually, I am very careful to give any financial advice but I feel really sad for you, my friend! If you can, that would be my advice too. DCA here and get it down further.
$FFAI
Wyckoff Type I Accumulation Schematic w/a SPRING
Pic I
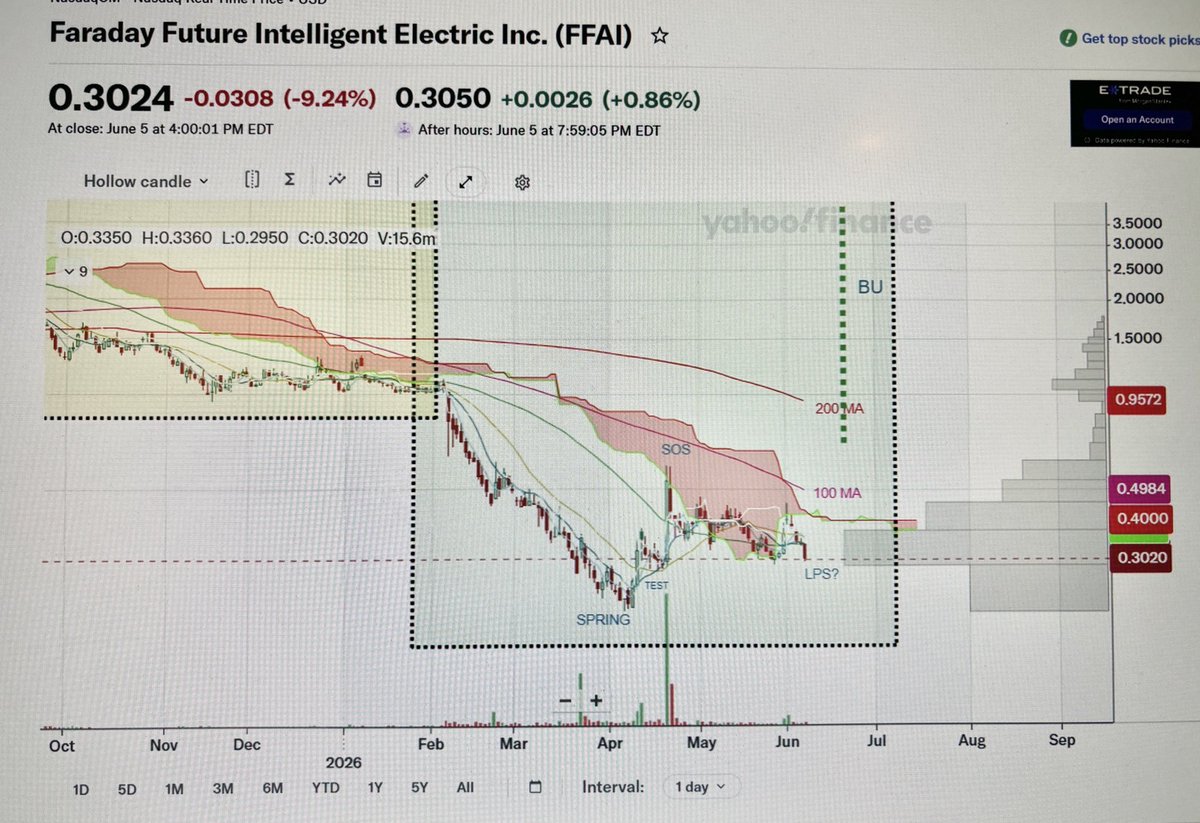
Monthly chart
Similar to AMC, $FFAI is a Wyckoff Type I Accumulation and therefore a reversal pattern (unlike the GME chart which is a Wyckoff RE-ACCUMULATION schematic and a continuation pattern).
Phase A: Stopping of the multi-year downtrend, which resulted in a Selling Climax (SC) in 4/2024; immediately followed by an Auto-Rally (AR) in 5/2024; and then in a Secondary Test (ST) in 11/2024.
Phase B: ABSORPTION phase, which started in 12/2025, and in which the price moved sideways, in a tight range ($1-$5); this phase typically shows a Secondary Test in Phase B (ST in B), and ended in 1/2026.
Phase C: SHAKEOUT phase, which is characterized by a SPRING action and its test; this phase started in the beginning of 2/2026, when the price suddenly broke through the bottom of $1 and rapidly declined over a period of two months, which resulted in a SPRING and an ATL of $0.2060 in early 4/2026, followed by the TEST of the Spring in mid 4/2026. This phase is likely complete, however, we need for the price to go back up, at least >$1, to validate the SPRING!
Phase D: Early BACKUP (BU) phase; we are likely in the early stages of markup phase, with the initial Sign-Of-Strength (SOS) rally and now likely completing the Last Point of Support (LPS). However, we need for the price to go back into the Phase B range ($1-$5), and then, ABOVE that range (>$5), to confirm the new uptrend!
Phase E: Advanced Backup (BU) phase; the price rapidly moves up, above the prior range, with high trading volumes, and should move towards the prior Auto-Rally (AR) level of $156!
Pic II
The drawing shows a typical Wyckoff ACCUMULATION schematic, with the important landmarks, which correspond to the monthly chart.
Pic III
Weekly chart shows a more granular detail with the Phases and the important landmarks of the Wyckoff schematic.
Note the thinning and the rapidly falling Ichimoku Cloud and also falling weekly 100 MA ($2.14) as well as the weekly 50 MA ($1.14), indicating diminishing resistance for the price to move higher!
Pic IV
Daily Chart shows the more detailed view of the Spring, its Test, and the initial massive SOS rally with so far the highest daily trading volume of 590 M! Since then, the price has moved sideways, likely now forming the LPS.
Note the extremely flimsy Ichimoku Cloud right above the current price! The MIGHTY daily 200 MA is just at $0.96 and the daily 100 MA at $0.5!
IMO, the algorithm is ready for the price to move higher!
NFA
Good luck!
$AMC
Wyckoff Schematic Phases
Pic I
Monthly chart
Phase A: MARKDOWN; start BC (6/2021) - end SC (4/2024);
Phase B: ABSORPTION; start AR (5/2024) - end 12/2026 when the price breaks the $2 floor; before that, the price remains in a trading range $2-$12
Phase C: SPRING + TEST; starts with the price breaking through the $2 floor (12/2026); reaching an ATL of $0.93 (3/2026); followed by a rebound and now likely in the TEST phase; appears to be complete!
Phases D/E: BACKUP! The algo appears to be ready for a major markup phase! First, the price has to go up and back into the trading range! Second, the price has to go above the trading range, then likely to fall back into the trading range! Third and the final, the price goes back up and much higher!
Pic II
Drawing showing the Wyckoff phases
Pic III
Weekly chart
The Wyckoff phases can also be seen on this weekly chart with more granular algorithmic detail!
Note the striking algorithmic similarities between the current SPRING + TEST (green arrow) and that in 1/2021 (red arrow)!
In both cases, we appear to complete the SPRING + TEST, and the price is below most MAs + the thin red Ichimoku Cloud + the 200 MA!
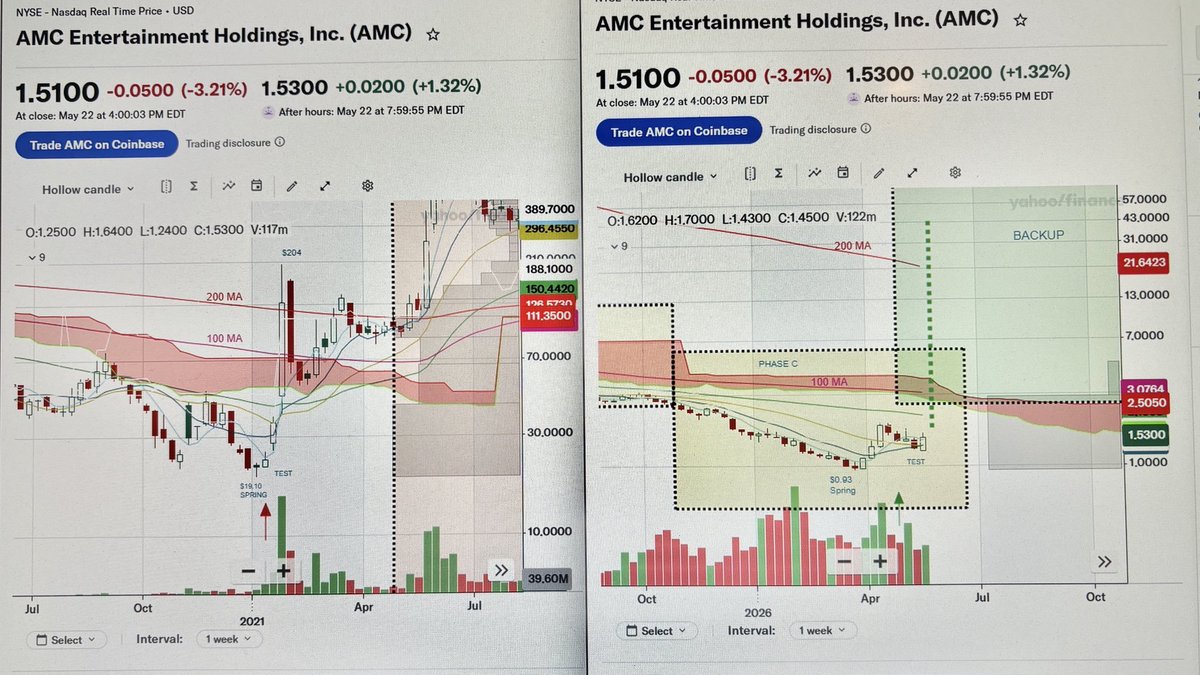
Pic IV
Side-by-side comparison of the 2021 and the current algorithms!
In both cases, the basic structure is similar however the current algorithm is taking more weekly candles/more time to play out!
In both situations, the price, after forming a SPRING + TEST, is below most of the MAs; the red thin Cloud; the 100 MA (which is mostly inside the Cloud); and finally, the weekly 200 MA on top!
In 2021, the price made a violent move, in just two weekly candles, and spiked above the weekly 200 MA!
The current algorithm could show a similar violent move and, with multiple gap fills along the way, could spike above the current weekly 200 MA, somewhere between $15-$45 (a little higher than shown in my recent prior post)!
TIME WILL TELL!
NO FINANCIAL ADVICE
GOOD LUCK!
Totally agree! In fact, multiple gaps on the daily chart and at least one large gap around $42 on the weekly chart, are visible! These were created during the panic selling in 8/2023 with a violent vertical move to the downside, typical of a capitulation move after the 1-10 stock split!
Therefore, a move back up may find little resistance, and could also be vertical but now to the upside!!!
Thank you for this and all your likes!🙏
$AMC
Wyckoff Type I Distribution Schematic
Pic I
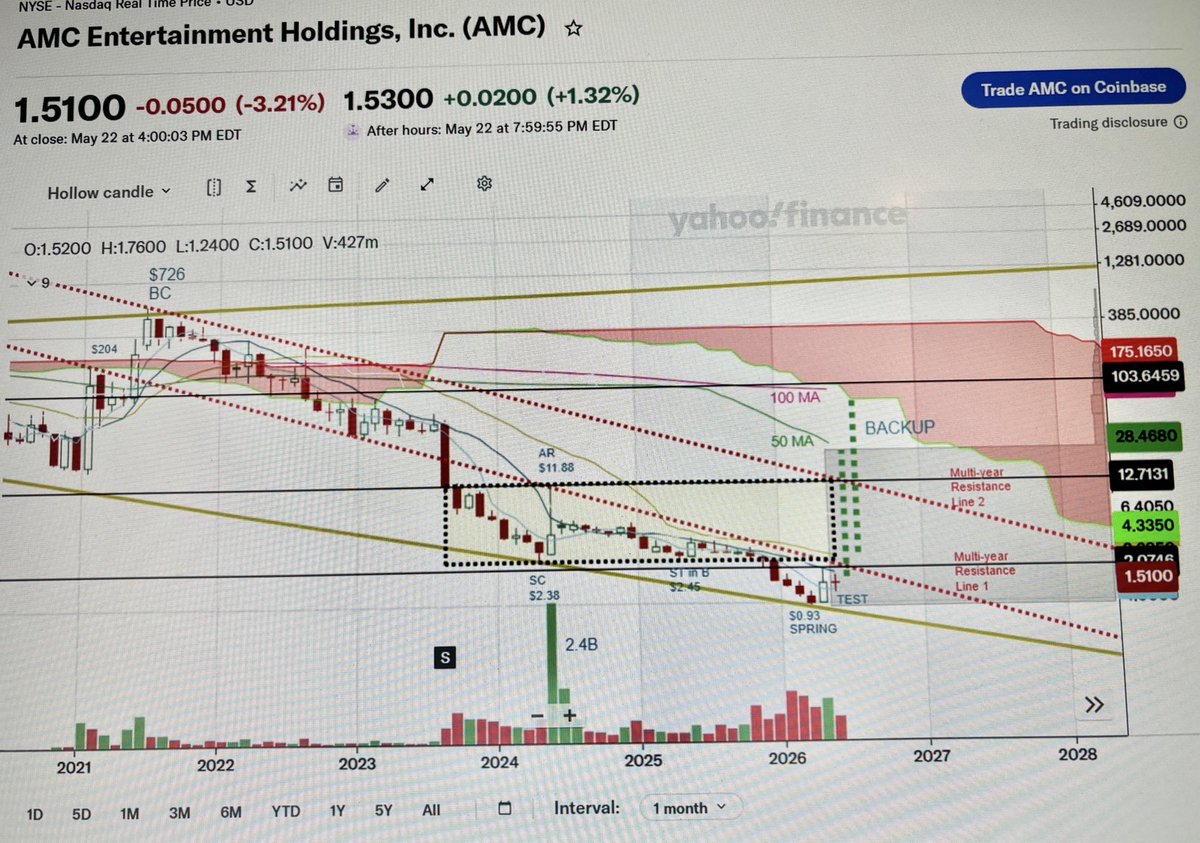
Monthly chart
During the meme-stock MOASS in 1/2021, the price surged from $19 to $204 and reached an ATH and a Buying Climax (BC) of $726 in 6/2021!
Since then, the price steadily declined within a falling flag formation, and accelerated its descent in 8/2023 with panic selling after a 1-10 stock split, culminating into a Selling Climax (SC) at $2.38 in 4/2024!
This was followed a massive auto rally (AR), with the price rebounding to $11.88, with the highest monthly trading volume of 2.4B in 5/2024!
Then, the price moved sideways, forming a trading range between $2 and $12 (yellow box).
In 12/2025, suddenly the price broke through the $2 to the downside, and continued to fall till it reached an ATL of $0.93! This was likely a high-volume Wyckoff Spring, a false move to the downside, which typically occurs before a BACKUP can begin!
Note that there are two long-term Resistance Lines 1 and 2, which coincide with the lower and the upper boundaries of the trading range!
After completing the TEST of the SPRING, the price has make its way back into the trading range (yellow box) > $2-2.50!
During an uptrend, the price has to break the resistance lines and could move up, with multiple gap fills, toward a range between $15-$30!
Then, it is likely to fall back into the trading range!
Finally, it could go back up and reach the monthly 100 MA/lower edge of the Ichimoku Cloud around $100!
Pic II
Wyckoff Type I Distribution Schematic Drawing
The monthly AMC chart shows striking resemblance to the drawing and the important landmarks can be identified, such as the BC, SC, AR, ST in B, SPRING, TEST of the SPRING, and finally the BACKUP (BU) phase!
Pic III
Weekly chart
Note a more detailed view of the trading range (yellow box) with the key events (SC, AR, ST in B, SPRING, TEST).
Also, note that the lower resistance line 1 coincides wit the weekly 50 MA, 100 MA + the lower edge of the Ichimoku Cloud, while the upper resistance line 2 coincides with the upper boundary of the trading range + the weekly 200 MA!
Pic IV
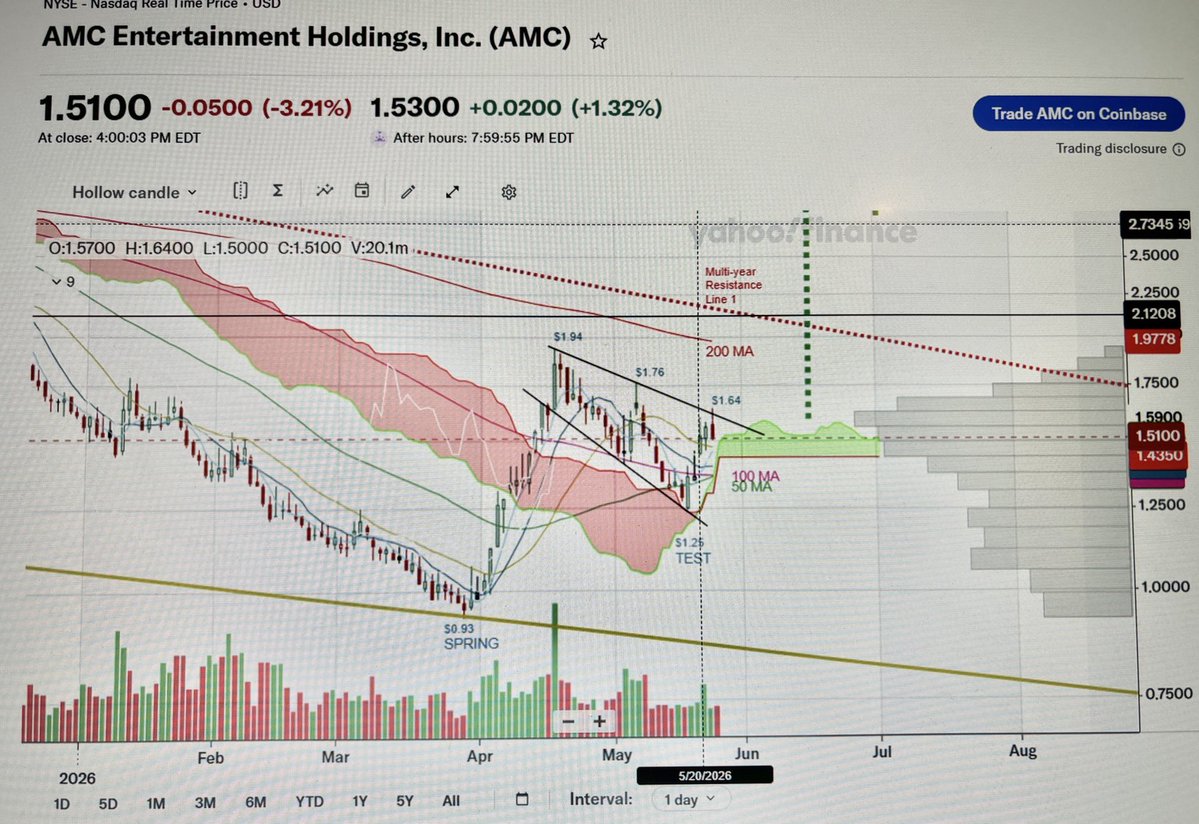
Daily chart
Note the detailed view of the most recent price action with the ATL of $0.93, likely the SPRING, followed by a price rebound to a local high of $1.94!
Then, the price went into a descending broadening wedge, likely resulting in the TEST of the SPRING at $1.25, and now appears to be in a new uptrend!
The price needs to break the $1.94 to the upside, in order to move back up into the trading range, >$2-$2.50!
The daily 200 MA is at $1.98 and the resistance line 1 is around $2.12!
Breaking below the recent low at $1.25 will invalidate the entire setup!!!
Time will tell!
NFA
Good luck!