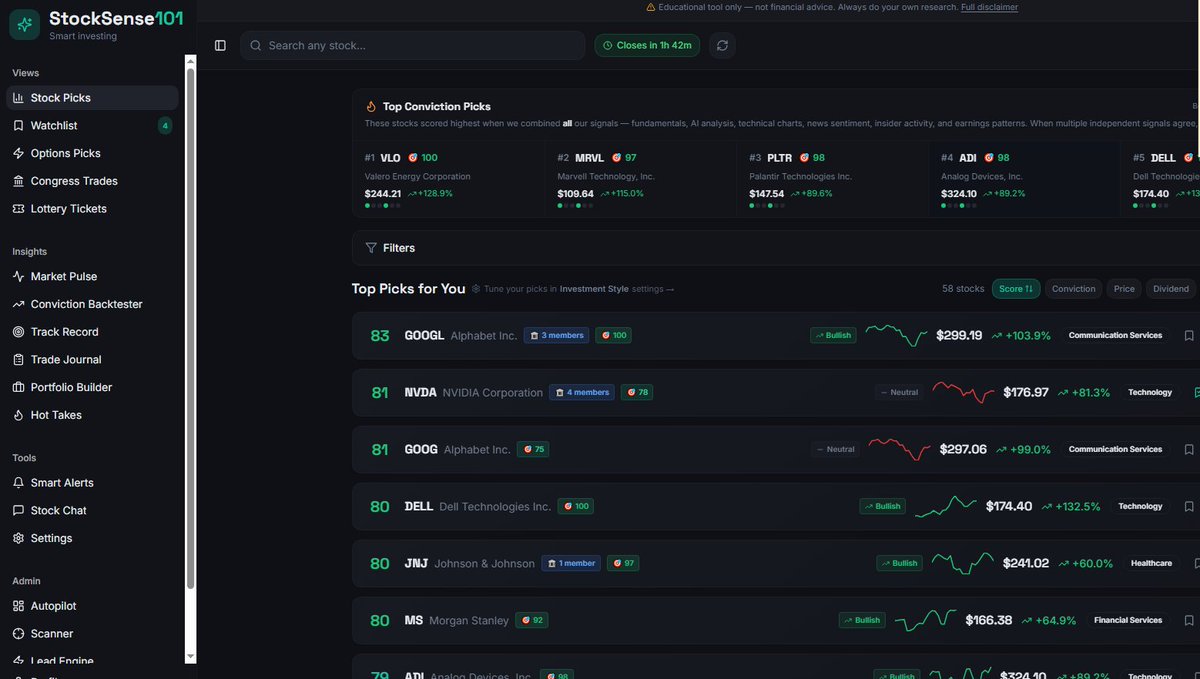
Using our AI predictions is like checking a weather forecast before a hike. It does not predict the future, but it shows potential conditions based on current data. Combine these insights with price alerts to stay informed without watching your screen all day. #Investing#Stocks
Earnings calls are like a company's seasonal check-up. While the numbers are important, the Q&A session at the end reveals how management handles tough questions from analysts. Listen for clear, direct answers rather than vague jargon to judge if the leadership is transparent.
Reading an earnings report is like checking a student's report card. You want to see if the company is actually meeting its goals and if its profits match the story it told investors. Look past the headline numbers to see if the core business is growing or just cutting costs.
New investors often confuse a stock price with the total value of a company. This is like thinking one pizza is larger than another just because it was cut into more slices. Before buying, check the market cap to understand the actual size and value of the business.
New investors often confuse a high stock price with an expensive valuation. This is like thinking a $100 bill is more valuable than two $50 bills because it is a single piece of paper. Look at the price-to-earnings ratio to see the actual value you are getting. #Investing#Stocks
Long-term investing is like planting a fruit orchard. You spend the early years nurturing the trees before they are strong enough to bear fruit. Once they mature, your harvest grows every season without extra effort. Focus on the trend over years, not the daily weather.
Think of long-term investing like growing an oak tree. You cannot rush the growth, and checking the height every hour only leads to frustration. Patience allows small, steady gains to build on each other over years. Focus on the decades ahead rather than the daily noise.
A stop loss order is like a safety belt for your portfolio. It automatically sells a stock if the price drops to a certain level, preventing a small mistake from becoming a total disaster. Set your exit point before you buy to remove emotion from the decision. #Investing#Stocks
Position sizing is like choosing how much of your luggage to put on one airplane. If you pack everything in one bag and it goes missing, you lose it all. Spreading your risk across different positions ensures that one mistake won't ruin your entire journey. #Investing#Stocks
Recency bias is the tendency to believe that what happened yesterday will keep happening tomorrow. It is like assuming a sunny day means it will never rain again, leading investors to buy at peaks or sell at bottoms. Focus on the long-term data rather than the last week.
The MACD indicator tracks the relationship between two different trends to show if a stock is gaining or losing speed. It functions like a car's speedometer, telling you if the momentum is accelerating or if it is starting to slow down. Use it to see if a trend still has fuel.
Anthropic, Google $GOOGL and Broadcom $AVGO have agreed to expand their current partnership in which
"Anthropic, beginning in 2027, will access through Broadcom approximately 3.5 gigawatts as part of the multiple gigawatts of next generation TPU-based AI compute capacity committed by Anthropic.
The consumption of such expanded AI compute capacity by Anthropic is dependent on Anthropic’s continued commercial success."
@BrianFeroldi This perfectly highlights the power of "positive skew". One hyper-grower can pay for dozens of mistakes and still drive the entire portfolio.
CPI data shows a slight cooling in core inflation, but service costs remain sticky. 📉
What does this mean for your portfolio? High-interest rates often lead to 'Sector Rotation.'
When inflation cools, investors often shift from defensive stocks to growth. #Investing101 #Markets
Confirmation bias is the habit of only looking for news that agrees with an investment you already made. It is like only reading reviews from fans of a movie while ignoring the critics. To stay objective, try to find one reason why your favorite stock might fail.
The Relative Strength Index, or RSI, measures if a stock is being bought or sold too quickly. Think of it like a rubber band; if it is stretched too far in one direction, it is likely to snap back toward the center. Use it to spot when a price move might be exhausted.
A stock index, like the S&P 500, is a thermometer for the market's health. It tracks a group of companies to show how a specific sector or the entire economy is performing. Instead of watching every individual business, use an index to see the broader direction.
Our new sector analysis tool helps you see which industries are moving together. It is like looking at the whole forest rather than just one tree to see if the entire landscape is shifting. Use this overview to spot which sectors are gaining momentum before you pick a stock.