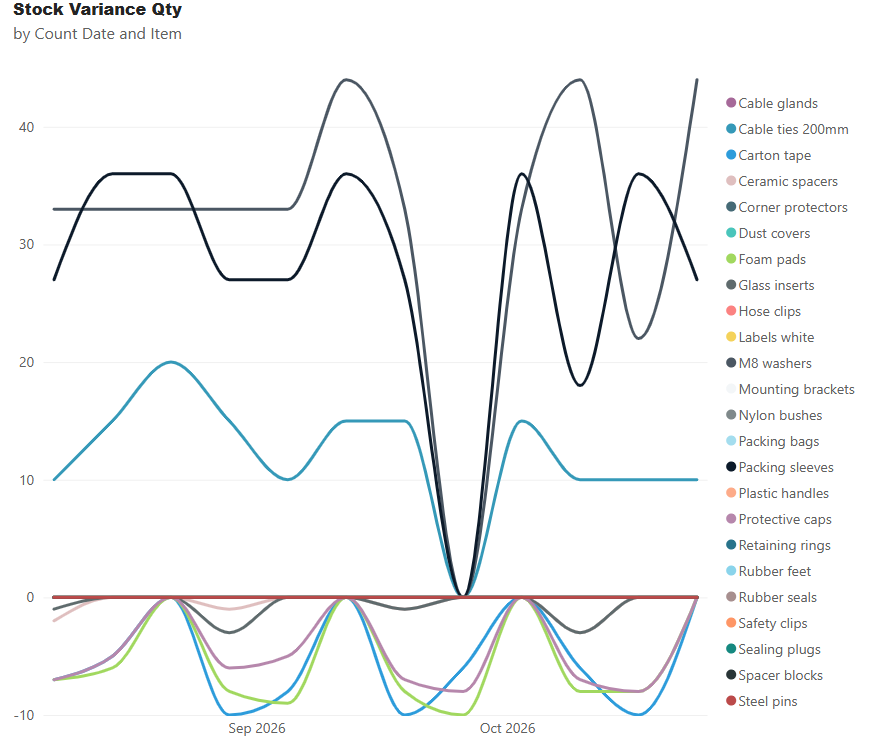
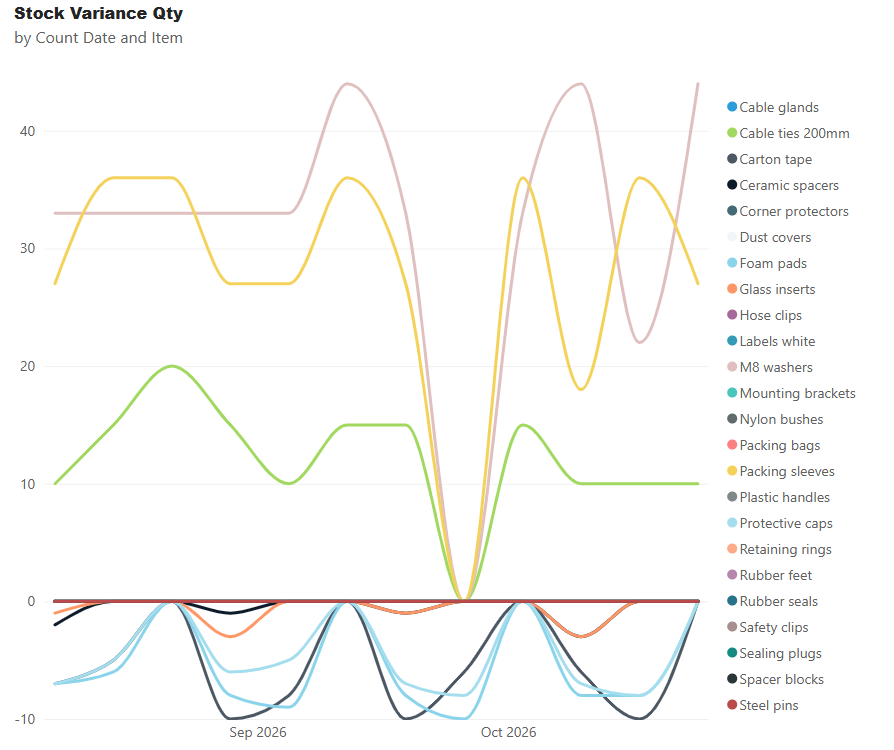
“Count reconciliation” explains the adjustment, not why the stock differed.
For one recurring item, trace the movement, check late postings and speak to warehouse staff.
Record the explanation. Give the team something to act on before the next count.
#StockAccuracy
The warehouse total agrees. The bin balances do not.
My latest synthetic case study traces recurring stock discrepancies to receipt conversions, recorded bin destinations and late postings.
Before another adjustment, check what explains the difference.
#StockAccuracy
The stock adjustment is posted. The same discrepancy returns.
This week’s synthetic case study traces receipt conversions, bin destinations and posting times to ask what could make recurring corrections unnecessary.
#StockAccuracy#SAPBusinessOne
A zero stock variance can hide bin discrepancies.
In my synthetic case study, two products' warehouse totals agreed across 12 counts, yet bin balances differed in 9.
Start with a product your warehouse team keeps checking.
#StockAccuracy#SAPBusinessOne
Zero stock variance can hide recurring bin discrepancies.
In my synthetic warehouse case study, two products show bin differences in 9 of 12 counts, while their warehouse totals agree.
A second look matters.
#SAPBusinessOne#StockAccuracy
The stock count is corrected. Next week, the same items need adjusting again.
Late postings, unit conversions or stock in the wrong bin? Each needs a different response.
My next case study explores recurring stock discrepancies using synthetic data.
#StockAccuracy
When a report flags an exception, who acts next?
October’s Insight Note connects reporting, working practices and staff understanding.
Read it here:
https://t.co/x0mEIqg2W9
Prefer to listen to the podcast based on October's Insight Note? Click on the audio file below.
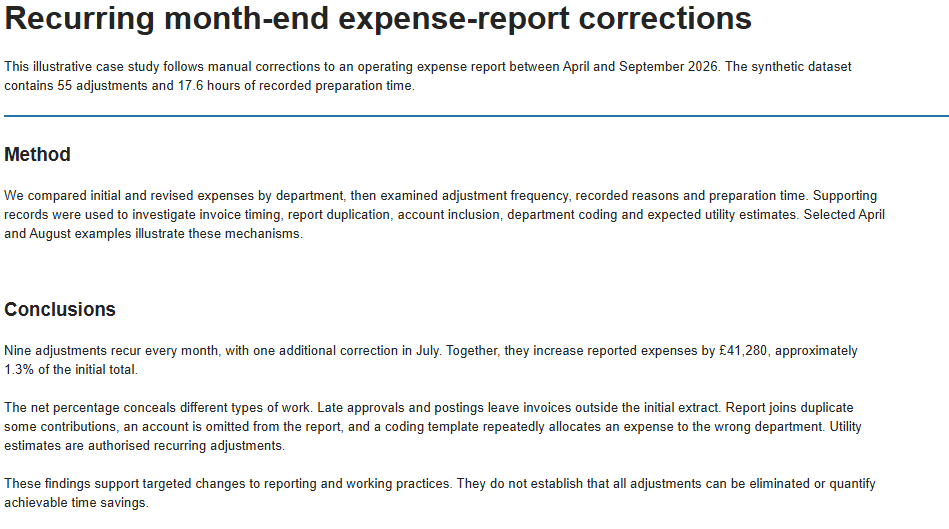
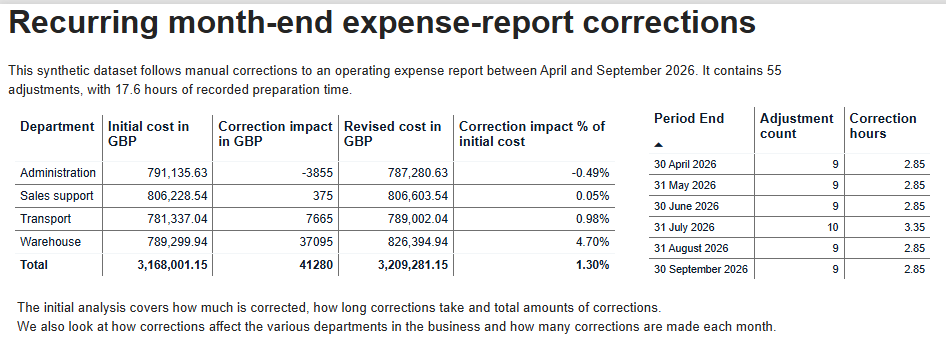
55 adjustments, 17.6 preparation hours. This synthetic case study traces recurring corrections to invoice timing, report joins and coding, alongside necessary estimates. Different explanations need different actions. Which monthly correction deserves a closer look?
#DataAnalysis
Which figure does your team still check manually before trusting it?
Start with one recurring problem. Trace the report to its source, review the working practice and agree what needs changing.
Message me to discuss a focused investigation with StraightLine Data & Training.
A dashboard can look right—and still send a manager back to Excel. What does that extra check reveal? A short extract from September’s StraightLine Insight Audio. Full episode and article: https://t.co/yiXOxvtScw
Knowing where to click is one part of using a system. Knowing when to question the result matters too.
Work through one familiar exception: what to check, who can correct it and when to ask for help.
Which recurring exception would make a useful training example for your team?
Nine expense-report adjustments recur every month in this synthetic case study. Across six months: 55 adjustments and 17.6 preparation hours. Some may be necessary; repetition is a reason to investigate. Which correction has become routine?
#DataAnalysis
Correcting the same report every month?
Choose one recurring adjustment. Record what changes, why and how long it takes. Then trace it back to the source.
The cause could lie in data entry, mapping, report logic or unclear guidance.
Which correction keeps returning?
Does “on-time delivery” mean the original promise date or the latest revision? Do partial deliveries count?
Ask two people to explain the same KPI. Do their answers agree?
Clear definitions and shared understanding help teams turn figures into practical decisions.
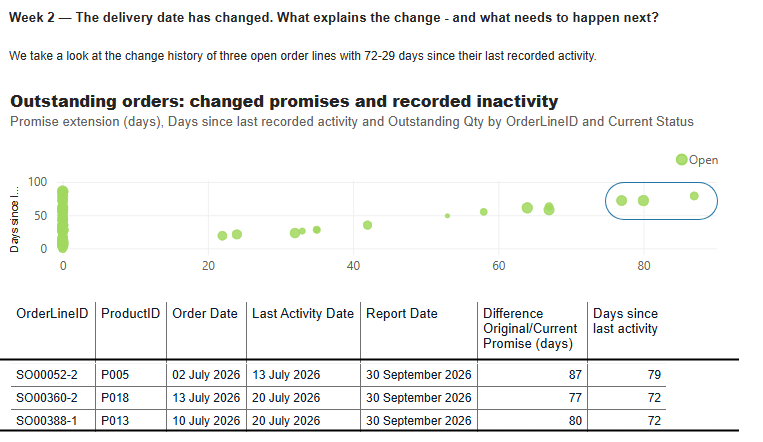
Three open order lines: promises extended by 77–87 days; 72–79 days since recorded activity. This synthetic case study flags questions, not proof of poor service. Can staff find the latest update, the action owner and the next review date? #DataAnalysis
A healthy delivery KPI can sit beside orders still needing attention.
Check outstanding quantities, changes to promised dates and last recorded activity. Is there a clear next action?
When the headline looks reassuring, can you still see which customers are waiting?
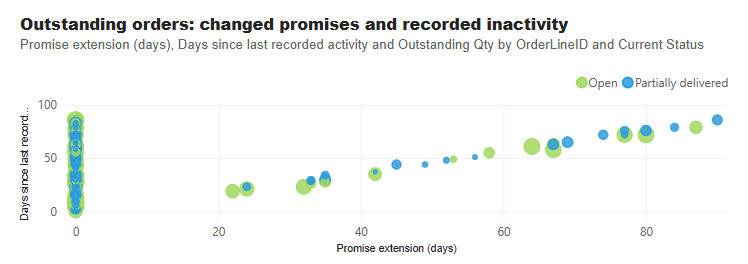
A revised delivery promise can hide an older commitment. In this synthetic case study: a 90-day extension, 80 cases outstanding and 86 days since recorded activity. Flags to investigate—not proof of poor service. Does your report keep the original promise visible? #DataAnalysis
The stock report and physical count disagree. Before adjusting the figure, trace the difference: timing, movements, locations and units.
Understanding the working practice behind the number helps the team address the cause.
How do you investigate stock discrepancies?
When the system says one thing and the operation says another, don’t start with “which one is wrong?”
Ask:
Where did the two versions of reality diverge?
September’s Insight Note looks at manual checks, stock variance and reporting trust.
Clarity makes the difference useful.
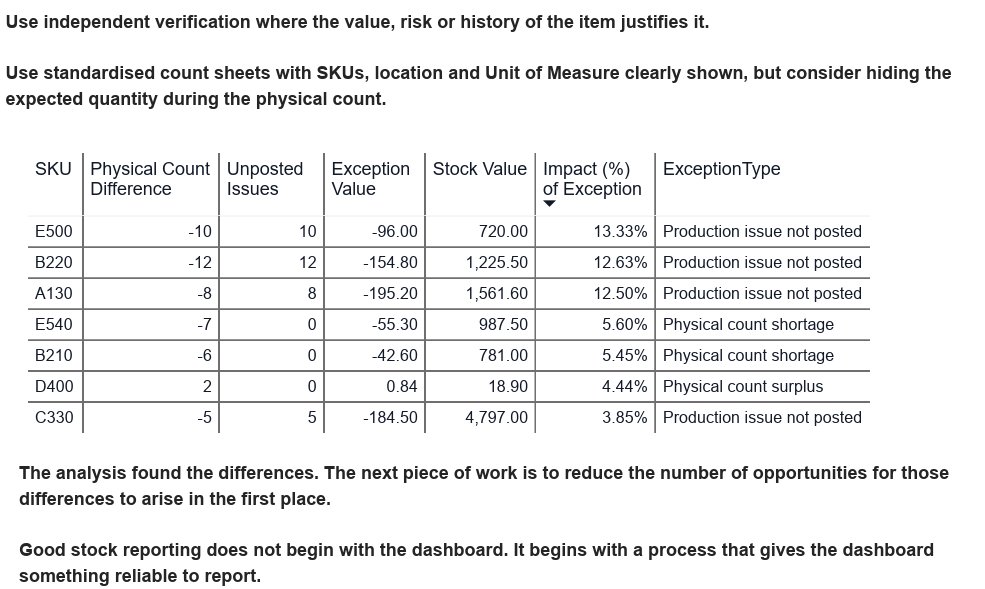
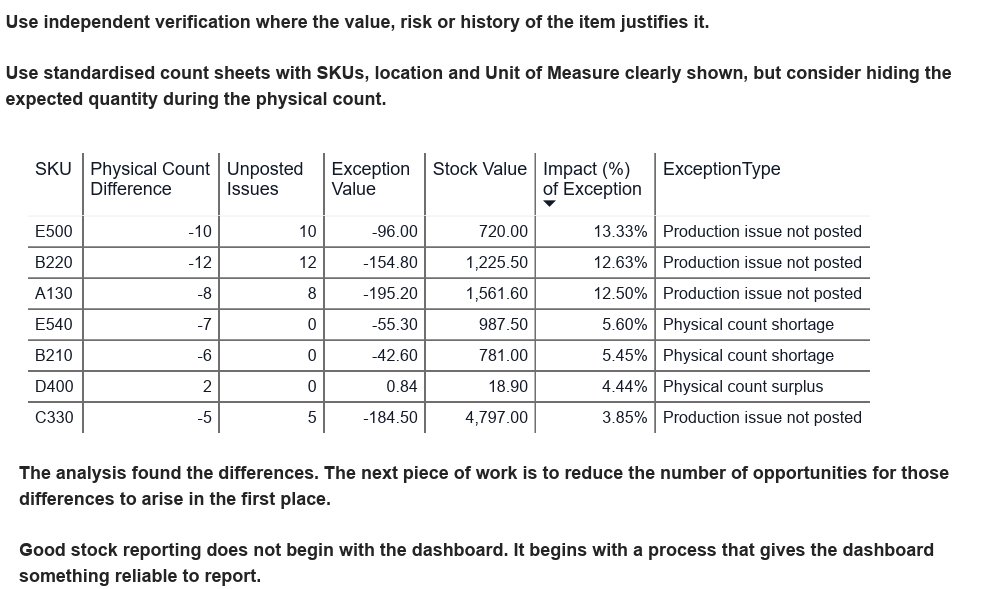
24 SKUs reviewed.
16 showed differences.
The causes weren’t just “bad data”: quarantine, unposted receipts, delayed issues, UoM and count errors all played a part.
Good stock reporting starts with a reliable process, not a prettier dashboard.