Stronghold (SHx) is pure digital gold.
Built by ex-Ripple & Stellar leads. Ripple invested. Integrated with IBM, ACH, ISO 20022 & FedNow
Not hype. Real rails, already running.
Hidden gem. Not for long
https://t.co/D2P1vJ3RFu
#SHx#Fintech#Ripple#Stellar#DePIN#ISO20022#XRP
🌪 Can you survive this? 🌪
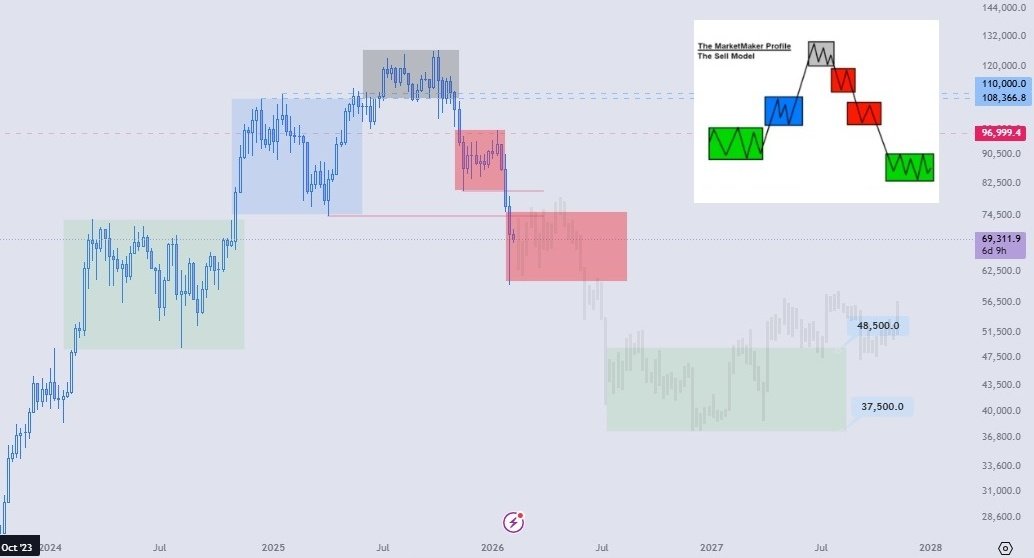
In late January 2025, my focus was on the macro structure. After a strong impulsive move higher, Bitcoin was starting to show signs of exhaustion, and the ~65k area stood out as a logical target for a correction and liquidity grab. At the time, that view felt premature to many.
What followed was only a partial version of that process. Price did correct, but only down to the ~74k area. From there, it pushed higher again and printed a new ATH (grey box). That top was meaningful, but also limited. Roughly +14% above the January ATH, without strong structural expansion or sustained acceptance above those levels.
It was precisely at that top that I highlighted a point of inflection. The market was forced to choose a path:
🔹 Either it validated real strength with continuation into a new ATH, almost in a parabolic move, a scenario I illustrated on the chart with the red candle projection.
🔹 Or it failed that validation and began a deeper corrective process towards the ~65k area, illustrated by the blue candle projection.
What followed was the full activation of the sell model. Distribution at the top gave way to a break in market structure, with key levels lost and clear imbalance and order blocks left unmitigated.
The subsequent price action, impulsive moves lower followed by consolidation, reflects a market in liquidity reorganisation, position rotation, and volume building.
⚠️ From my perspective, a correction to ~65k is no longer sufficient to complete this cycle. For the structure to resolve cleanly, price needs to work through deeper liquidity zones, located between ~48k and ~37k, where historical volume and significant fair value gaps (FVGs) converge.
---
Even if Trump already has a Powell replacement willing to turn the money printers back on and push prices to a new ATH, the market could still be engineered to trade down into this zone first.
Like I said before, price couldn’t care less about the news.
---
$SHx $XLM $XRP #Bitcoin #Economy #CryptoMarket #StockMarket
🇺🇸 TCH wants to connect US banks to tokenised deposits on-chain
Last Friday, The Clearing House announced an initiative to enable on-chain clearing and settlement of tokenised deposits between banks.
The solution aims to combine regulated banking infrastructure with blockchain native capabilities. Programmability, interoperability, richer transaction data, and 24/7 settlement.
The initiative will have two main components:
🔹 On-chain clearing and settlement of tokenised deposits between banks, within the existing banking framework.
🔹 A connectivity layer between blockchain activity and traditional fiat rails, including RTP and CHIPS.
According to TCH, the use cases include programmable treasury, real-time liquidity management, cross-border payments, agentic commerce, digital asset settlement, and automated financial workflows.
The list of institutions, for many of us, is no longer a surprise.
Names such as Bank of America, BMO, BNY, Citi, Citizens, Fifth Third, HSBC, Huntington, JPMorgan, KeyBank, PNC, Regions, Santander/Getnet, TD Bank, Truist, U.S. Bank, and Wells Fargo all appear in the announcement.
As we have seen, these banks have been looking to gain more and more exposure to the crypto world. Banks increasingly want to capture the stablecoin narrative without handing control over to crypto-native issuers.
The market is moving into a phase where regulated payments + tokenisation + interoperability + 24/7 settlement are becoming real banking priorities.
✨ And this is where projects such as Stronghold, Stellar, Ripple, Axelar, and Solana enter the conversation.
Not because this news directly validates any specific token, but because it validates the sector where these projects are trying to capture value.
A more digital, programmable, and interoperable financial infrastructure, where payments, settlement, liquidity, cross-border flows, and tokenised assets become connected to traditional rails and blockchain networks.
Although this is good news for the tokenisation thesis, it also increases competition.
If the major banks manage to build a closed network via TCH, part of the institutional volume could remain inside that banking ecosystem, without any direct need for public tokens.
This is where the difference between narrative and real utility starts to matter.
It is not enough to be exposed to payments, tokenisation, or settlement themes. Utility will have to appear in the areas where banks cannot, do not want to, or have no incentive to operate alone:
🪄 external interoperability, merchant networks, fintech rails, cross-border payments, global liquidity, compliance tooling, multi-network integration, and access to markets outside the closed banking system.
Ultimately, the more banks move towards tokenised rails, the clearer the question becomes:
Which projects will complement this infrastructure, and which ones will be replaced by it?
🌪 Can you survive this? 🌪
In late January 2025, my focus was on the macro structure. After a strong impulsive move higher, Bitcoin was starting to show signs of exhaustion, and the ~65k area stood out as a logical target for a correction and liquidity grab. At the time, that view felt premature to many.
What followed was only a partial version of that process. Price did correct, but only down to the ~74k area. From there, it pushed higher again and printed a new ATH (grey box). That top was meaningful, but also limited. Roughly +14% above the January ATH, without strong structural expansion or sustained acceptance above those levels.
It was precisely at that top that I highlighted a point of inflection. The market was forced to choose a path:
🔹 Either it validated real strength with continuation into a new ATH, almost in a parabolic move, a scenario I illustrated on the chart with the red candle projection.
🔹 Or it failed that validation and began a deeper corrective process towards the ~65k area, illustrated by the blue candle projection.
What followed was the full activation of the sell model. Distribution at the top gave way to a break in market structure, with key levels lost and clear imbalance and order blocks left unmitigated.
The subsequent price action, impulsive moves lower followed by consolidation, reflects a market in liquidity reorganisation, position rotation, and volume building.
⚠️ From my perspective, a correction to ~65k is no longer sufficient to complete this cycle. For the structure to resolve cleanly, price needs to work through deeper liquidity zones, located between ~48k and ~37k, where historical volume and significant fair value gaps (FVGs) converge.
---
Even if Trump already has a Powell replacement willing to turn the money printers back on and push prices to a new ATH, the market could still be engineered to trade down into this zone first.
Like I said before, price couldn’t care less about the news.
---
$SHx $XLM $XRP #Bitcoin #Economy #CryptoMarket #StockMarket
🧠 You think It’s late? The Smart Money hasn’t even entered yet
The bulk of institutional capital, the money that truly moves the world, has yet to enter the crypto market.
As we know, ISO20022 is the new global standard for financial messaging, defined by SWIFT and adopted by central banks, payment systems, and clearing institutions.
This standard will come into full global implementation on 22 November 2025, defining how financial data is structured and exchanged to enable seamless interoperability across institutions and platforms.
And from 1 January 2026, anyone still using MT messages will face extra fees for translation and contingency services until migration is complete.
Who’s going to want to pay more?
No one. 🤷🏻♂️
The DTCC, which clears and settles the vast majority of securities transactions in the United States, is currently adapting its systems (DTC, NSCC, FICC) to communicate using this framework.
But there’s a reason its timeline is longer.
The DTCC sits at the very end of the settlement chain, where data from exchanges, banks, and custodians converges. Before it can upgrade its own infrastructure, it must ensure that all upstream entities — exchanges, brokers, and correspondent banks — are fully stabilised in the new format.
📍 The full testing and certification phase is taking place between 2025 and 2026, with ongoing adoption expected in 2026/27.
Once this migration is finalised, settlement messages will be able to integrate with digital asset networks and ISO20022 compliant systems worldwide, creating a unified infrastructure between traditional and tokenised money.
---
We’re in the phase where the infrastructure is still being built. Just before the avalanche of liquidity 🌊
When the migration is complete, blockchain will cease to be a parallel universe. It will become the central nervous system of the new global financial market.
$SHx $XLM $XRP #RWA #DigitalAssets #ISO20022 #Economy
🇺🇸 The CLARITY Act may become one of the biggest turning points in US digital asset regulation.
The market is already moving like it knows what comes next.
🔹 JPMorgan, Citi and major US banks are preparing tokenized deposits.
🔹 Stripe, Visa and Mastercard are backing stablecoin infrastructure.
🔹 IBM has decades of deep banking infrastructure behind it. Now, with Digital Asset Haven, that same institutional layer is moving into custody, compliance and multichain digital assets.
And the OCC already opened the operational door. US banks can hold crypto assets to pay network fees, test DLT platforms and operate directly on blockchain networks when tied to permitted banking activities.
Stablecoins already got their federal framework with the GENIUS Act.
Now CLARITY could define the wider digital asset market, separate SEC/CFTC roles and give institutions the rules they need.
Looks like the biggest players already know CLARITY is getting close.
🌈 They might need to add another band to the rainbow.
Funny how every dip gets a headline, yet Bitcoin keeps following the same structure I mapped out months ago.
🌈 They might need to add another band to the rainbow.
Funny how every dip gets a headline, yet Bitcoin keeps following the same structure I mapped out months ago.
🌪 Can you survive this? 🌪
In late January 2025, my focus was on the macro structure. After a strong impulsive move higher, Bitcoin was starting to show signs of exhaustion, and the ~65k area stood out as a logical target for a correction and liquidity grab. At the time, that view felt premature to many.
What followed was only a partial version of that process. Price did correct, but only down to the ~74k area. From there, it pushed higher again and printed a new ATH (grey box). That top was meaningful, but also limited. Roughly +14% above the January ATH, without strong structural expansion or sustained acceptance above those levels.
It was precisely at that top that I highlighted a point of inflection. The market was forced to choose a path:
🔹 Either it validated real strength with continuation into a new ATH, almost in a parabolic move, a scenario I illustrated on the chart with the red candle projection.
🔹 Or it failed that validation and began a deeper corrective process towards the ~65k area, illustrated by the blue candle projection.
What followed was the full activation of the sell model. Distribution at the top gave way to a break in market structure, with key levels lost and clear imbalance and order blocks left unmitigated.
The subsequent price action, impulsive moves lower followed by consolidation, reflects a market in liquidity reorganisation, position rotation, and volume building.
⚠️ From my perspective, a correction to ~65k is no longer sufficient to complete this cycle. For the structure to resolve cleanly, price needs to work through deeper liquidity zones, located between ~48k and ~37k, where historical volume and significant fair value gaps (FVGs) converge.
---
Even if Trump already has a Powell replacement willing to turn the money printers back on and push prices to a new ATH, the market could still be engineered to trade down into this zone first.
Like I said before, price couldn’t care less about the news.
---
$SHx $XLM $XRP #Bitcoin #Economy #CryptoMarket #StockMarket
👀 It almost looks like magic, doesn’t it?
"We’ll see what unfolds over the next 5 weeks."
As promised, five weeks later, we're revisiting this discussion.
✅ Liquidity taken above ~78k
✅ Market back below ~70k
⌛ Acceptance beneath ~70k
⌛ Reject ~60k / 2025 Low
⌛ Sell-off into the 48k–37k liquidity zone
Interestingly, the structure kept to schedule. And, almost as if by magic, the headlines appeared right on cue to support the scenario I had outlined.
In my previous post, I highlighted that the ~78k area had yet to be properly tested, and that a rejection followed by acceptance below ~70k could confirm continuation of the corrective leg.
The market went a step further.
Rather than reacting at ~78k (0.5 Fibonacci), price extended towards ~82,850 (0.618 Fibonacci), where it formed the range high on 6 May.
By 13 May, just over four weeks after the original analysis, the structure began showing clear signs of change. Price started rejecting the lower boundary of the previous range and lost acceptance at the levels that had been supporting the bullish continuation thesis. As a result, the upside expansion failed to generate sufficient displacement, and the macro outlook shifted in favour of seeking liquidity at lower levels.
The most interesting part?
Since yesterday, the headlines have started to arrive.
🧸 Strategy sells 32 BTC.
🧸 Iran suspends talks with the US and threatens to block the Strait of Hormuz. Again...
🧸 Oil surges.
🧸 USDT loses more than $1B in market capitalisation.
🧸 Mt. Gox moves 10,422 BTC (~$739M).
🧸 US mega-caps erase roughly $370B in market value on the last 48h.
Coincidence? It almost seems as though the elites know how to trade and world leaders all get together to manufacture panic...
The narrative is presented as though these events are causing the sell-off. Yet, as I've been showing over recent months, the structure was already pointing in that direction way before these headlines emerged. In fact, as far back as 3 June 2025, I highlighted the possibility of this trajectory.
Soo...
For this range to retain its bullish scenario, the ~65k area MUST hold and price needs to reclaim ~70k quickly. A sustained recovery above that level would keep the possibility of structural rebuilding and bullish continuation on the table.
As you can probably guess... I'm not particularly convinced by the bullish case.
If the market begins repeatedly rejecting the ~70k region and turns it into resistance, the probability of continuation towards the liquidity zones I've been highlighting for months increases significantly.
The structure is approaching a decision point.
---
Once price reaches the 48k–37k liquidity zone, we’ll see whether the conditions for a genuine trend reversal are actually in place.
That area is probably where buying alts starts to make sense again.
Assuming, of course, another “totally unexpected” FTX style collapse doesn’t arrive right on cue.
---
📚 Here’s a small task for you:
Open a few charts on the 3/4H timeframe and mark the weekly high and low.
Check how often one of them forms on a Tuesday or Thursday.
Crypto, stocks, indices, FX. It doesn’t matter.
Don’t treat it as a rule. Treat it as a weekly pattern worth studying.
Time is the key.
#Bitcoin #Crypto #CryptoMarket #Stocks $XLM $XRP $SHx
🌪 Can you survive this? 🌪
In late January 2025, my focus was on the macro structure. After a strong impulsive move higher, Bitcoin was starting to show signs of exhaustion, and the ~65k area stood out as a logical target for a correction and liquidity grab. At the time, that view felt premature to many.
What followed was only a partial version of that process. Price did correct, but only down to the ~74k area. From there, it pushed higher again and printed a new ATH (grey box). That top was meaningful, but also limited. Roughly +14% above the January ATH, without strong structural expansion or sustained acceptance above those levels.
It was precisely at that top that I highlighted a point of inflection. The market was forced to choose a path:
🔹 Either it validated real strength with continuation into a new ATH, almost in a parabolic move, a scenario I illustrated on the chart with the red candle projection.
🔹 Or it failed that validation and began a deeper corrective process towards the ~65k area, illustrated by the blue candle projection.
What followed was the full activation of the sell model. Distribution at the top gave way to a break in market structure, with key levels lost and clear imbalance and order blocks left unmitigated.
The subsequent price action, impulsive moves lower followed by consolidation, reflects a market in liquidity reorganisation, position rotation, and volume building.
⚠️ From my perspective, a correction to ~65k is no longer sufficient to complete this cycle. For the structure to resolve cleanly, price needs to work through deeper liquidity zones, located between ~48k and ~37k, where historical volume and significant fair value gaps (FVGs) converge.
---
Even if Trump already has a Powell replacement willing to turn the money printers back on and push prices to a new ATH, the market could still be engineered to trade down into this zone first.
Like I said before, price couldn’t care less about the news.
---
$SHx $XLM $XRP #Bitcoin #Economy #CryptoMarket #StockMarket
👀 It almost looks like magic, doesn’t it?
"We’ll see what unfolds over the next 5 weeks."
As promised, five weeks later, we're revisiting this discussion.
✅ Liquidity taken above ~78k
✅ Market back below ~70k
⌛ Acceptance beneath ~70k
⌛ Reject ~60k / 2025 Low
⌛ Sell-off into the 48k–37k liquidity zone
Interestingly, the structure kept to schedule. And, almost as if by magic, the headlines appeared right on cue to support the scenario I had outlined.
In my previous post, I highlighted that the ~78k area had yet to be properly tested, and that a rejection followed by acceptance below ~70k could confirm continuation of the corrective leg.
The market went a step further.
Rather than reacting at ~78k (0.5 Fibonacci), price extended towards ~82,850 (0.618 Fibonacci), where it formed the range high on 6 May.
By 13 May, just over four weeks after the original analysis, the structure began showing clear signs of change. Price started rejecting the lower boundary of the previous range and lost acceptance at the levels that had been supporting the bullish continuation thesis. As a result, the upside expansion failed to generate sufficient displacement, and the macro outlook shifted in favour of seeking liquidity at lower levels.
The most interesting part?
Since yesterday, the headlines have started to arrive.
🧸 Strategy sells 32 BTC.
🧸 Iran suspends talks with the US and threatens to block the Strait of Hormuz. Again...
🧸 Oil surges.
🧸 USDT loses more than $1B in market capitalisation.
🧸 Mt. Gox moves 10,422 BTC (~$739M).
🧸 US mega-caps erase roughly $370B in market value on the last 48h.
Coincidence? It almost seems as though the elites know how to trade and world leaders all get together to manufacture panic...
The narrative is presented as though these events are causing the sell-off. Yet, as I've been showing over recent months, the structure was already pointing in that direction way before these headlines emerged. In fact, as far back as 3 June 2025, I highlighted the possibility of this trajectory.
Soo...
For this range to retain its bullish scenario, the ~65k area MUST hold and price needs to reclaim ~70k quickly. A sustained recovery above that level would keep the possibility of structural rebuilding and bullish continuation on the table.
As you can probably guess... I'm not particularly convinced by the bullish case.
If the market begins repeatedly rejecting the ~70k region and turns it into resistance, the probability of continuation towards the liquidity zones I've been highlighting for months increases significantly.
The structure is approaching a decision point.
---
Once price reaches the 48k–37k liquidity zone, we’ll see whether the conditions for a genuine trend reversal are actually in place.
That area is probably where buying alts starts to make sense again.
Assuming, of course, another “totally unexpected” FTX style collapse doesn’t arrive right on cue.
---
📚 Here’s a small task for you:
Open a few charts on the 3/4H timeframe and mark the weekly high and low.
Check how often one of them forms on a Tuesday or Thursday.
Crypto, stocks, indices, FX. It doesn’t matter.
Don’t treat it as a rule. Treat it as a weekly pattern worth studying.
Time is the key.
#Bitcoin #Crypto #CryptoMarket #Stocks $XLM $XRP $SHx
⚠️ A friendly reminder.
Just because price has fallen doesn't mean it's cheap.
Markets have a habit of making people feel clever right before making them feel poor.
There will be a time to buy.
The challenge is surviving long enough to recognise it.
#Bitcoin#Crypto #CryptoMarket #Stocks
$XLM $XRP $SHx bitcoin:native
⚠️ Be careful folks. Do not try to catch falling knives.
As I mentioned last Friday, a move towards 76k was very likely over the weekend, and if that level failed to hold, the next major support would be 65k, which is roughly where we are now.
During this drop, there is still the possibility of a short squeeze towards 80k.
If 65k does not hold, the next key level would be around ~48k, potentially testing the previous low/order block located near 49k. I know, WILD.
Stay safe.
$SHx $XLM $XRP #Crypto #Bitcoin #DigitalAssets #Economy