@m_jnr1@grudy_smith Let’s know this. Mr. Tieku of Star Oil, is the CEO. The board and private owners are the ones making such decisions.
William Tewiah of ZEN is the founder and managing director.
𝟴 𝗰𝗼𝗵𝗼𝗿𝘁𝘀. 𝟮𝟬𝟬+ 𝗮𝗻𝗮𝗹𝘆𝘀𝘁𝘀.
𝗢𝗻𝗲 𝘀𝘁𝘂𝗱𝗲𝗻𝘁 𝗲𝗺𝗽𝗹𝗼𝘆𝗲𝗱 𝗶𝗻 𝟱 𝘄𝗲𝗲𝗸𝘀 𝘄𝗶𝘁𝗵 𝘇𝗲��𝗼 𝗽𝗿𝗶𝗼𝗿 𝘀𝗸𝗶𝗹𝗹𝘀.
𝗖𝗼𝗵𝗼𝗿𝘁 𝟵 𝗶𝘀 𝗼𝗽𝗲𝗻.
Most programs teach you tools.
This one teaches you how to use them — with AI as part of your workflow, not an afterthought.
That’s the gap.
𝗪𝗵𝗮𝘁 𝘆𝗼𝘂’𝗹𝗹 𝗹𝗲𝗮𝗿𝗻:
→ Excel, SQL, Python, Power BI
→ Statistics, Figma, PowerPoint
→ ChatGPT & Claude — used the way real analysts actually work
𝗪𝗵𝗮𝘁 𝘆𝗼𝘂 𝗹𝗲𝗮𝘃𝗲 𝘄𝗶𝘁𝗵:
→ 8+ real projects you can show
→ 1-on-1 mentorship from start to finish
→ A way of working that shows up clearly in your output
Start: June 25
Schedule: Fri–Sun, 7–9PM WAT
₦89,999 (Local) / $89.99 (International)
50 seats.
The people who take this seriously now
are the ones with options later.
Register 👇
https://t.co/CuWAr3lKo1
Who do you know that should see this?
#Datafam
Haven’t used power BI in 3 months and decided to explore the changes today ..
Particularly Claude AI power bi integration via MCP…
And boy oh boy, this is mind blowing, i tried to do something that took me 4 hours in 9 minutes..
I’ll play with this more and make a video soon
#Datafam
𝗧𝗵𝗲 𝗶𝗺𝗮𝗴𝗲 𝗼𝗻 𝘁𝗵𝗲 𝗹𝗲𝗳𝘁 𝘄𝗮𝘀 𝗺𝘆 𝘀𝗲𝘁𝘂𝗽 𝗮𝘁 𝘁𝗵𝗲 𝗲𝗻𝗱 𝗼𝗳 𝟮𝟬𝟮𝟯.
Learning data analytics.
Earning ₦30k per month.
The one on the right is my current setup.
I’m sharing this not to flex. But to encourage you.
Have I gotten to where I envisioned? No.
Did I fail multiple times? Yes.
Did I win? Absolutely.
Success isn’t linear.
There were months I didn’t know how I’d pay bills. Projects that went nowhere. Clients who ghosted. Opportunities that fell through.
But I kept learning. I kept building. I kept showing up.
And things started compounding.
One skill led to another. One project led to the next. One person I helped came back with someone else who needed help.
It wasn’t dramatic. It was gradual.
But it was real.
Here’s what I learned:
Everything compounds.
The SQL you learn today might not pay off for 6 months. But when it does, it pays.
The portfolio project you build when no one’s watching? Someone will see it eventually.
The person you help for free? They might become your biggest advocate.
Nothing is wasted.
Hardwork pays. But smart work pays faster.
I worked hard in 2023. But I didn’t work smart.
I was learning everything. Building nothing specific. Chasing every opportunity.
Now I focus. I build in public. I teach what I learn. I help people solve real problems.
That shift changed everything.
Don’t give up.
I know it’s hard. I know it feels like everyone else is moving faster. I know the rejections hurt.
But keep going.
Learn every day. Build every day. Pray every day.
Success is inevitable if you don’t quit.
I’m still on this journey. I haven’t arrived. But I’m not where I was.
And neither will you be if you keep moving.
One step at a time.
#DataAnalytics #Datafam
𝗜 𝘄𝗼𝗿𝗸𝗲𝗱 𝘄𝗶𝘁𝗵 𝗮 𝘀𝘁𝘂𝗱𝗲𝗻𝘁 𝗼𝗻 𝗮 𝘀𝗺𝗮𝗹𝗹 𝗮𝗻𝗮𝗹𝘆𝘁𝗶𝗰𝘀 𝗽𝗿𝗼𝗷𝗲𝗰𝘁.
It turned into a surprisingly realistic case study.
The problem:
International students sign up for German health insurance months before arriving.
Then visa delays happen.
Payment issues happen.
Students switch providers.
And insurers are left with hidden operational and financial risk they can’t see coming.
So we built a dashboard to answer one question:
Where is the risk actually coming from?
𝗧𝗛𝗘 𝗗𝗔𝗧𝗔
We simulated ~5,000 student records and analyzed:
→ Early churn behavior
→ Debt accumulation before arrival
→ Payment failures (SEPA vs bank transfer)
→ Visa outcomes and inactive accounts
→ Cost shock segments (age + employment)
→ Geographic concentration of risk
Real scenarios.
Messy data.
Actual business problems.
𝗪𝗛𝗔𝗧 𝗪𝗘 𝗙𝗢𝗨𝗡𝗗
→ Early churn happens fast — average around month 3
→ Arrival delays dramatically increase debt exposure
→ Payment failures strongly correlate with churn risk
→ A small group of segments drives most cancellations
These aren’t abstract insights.
These are operational red flags.
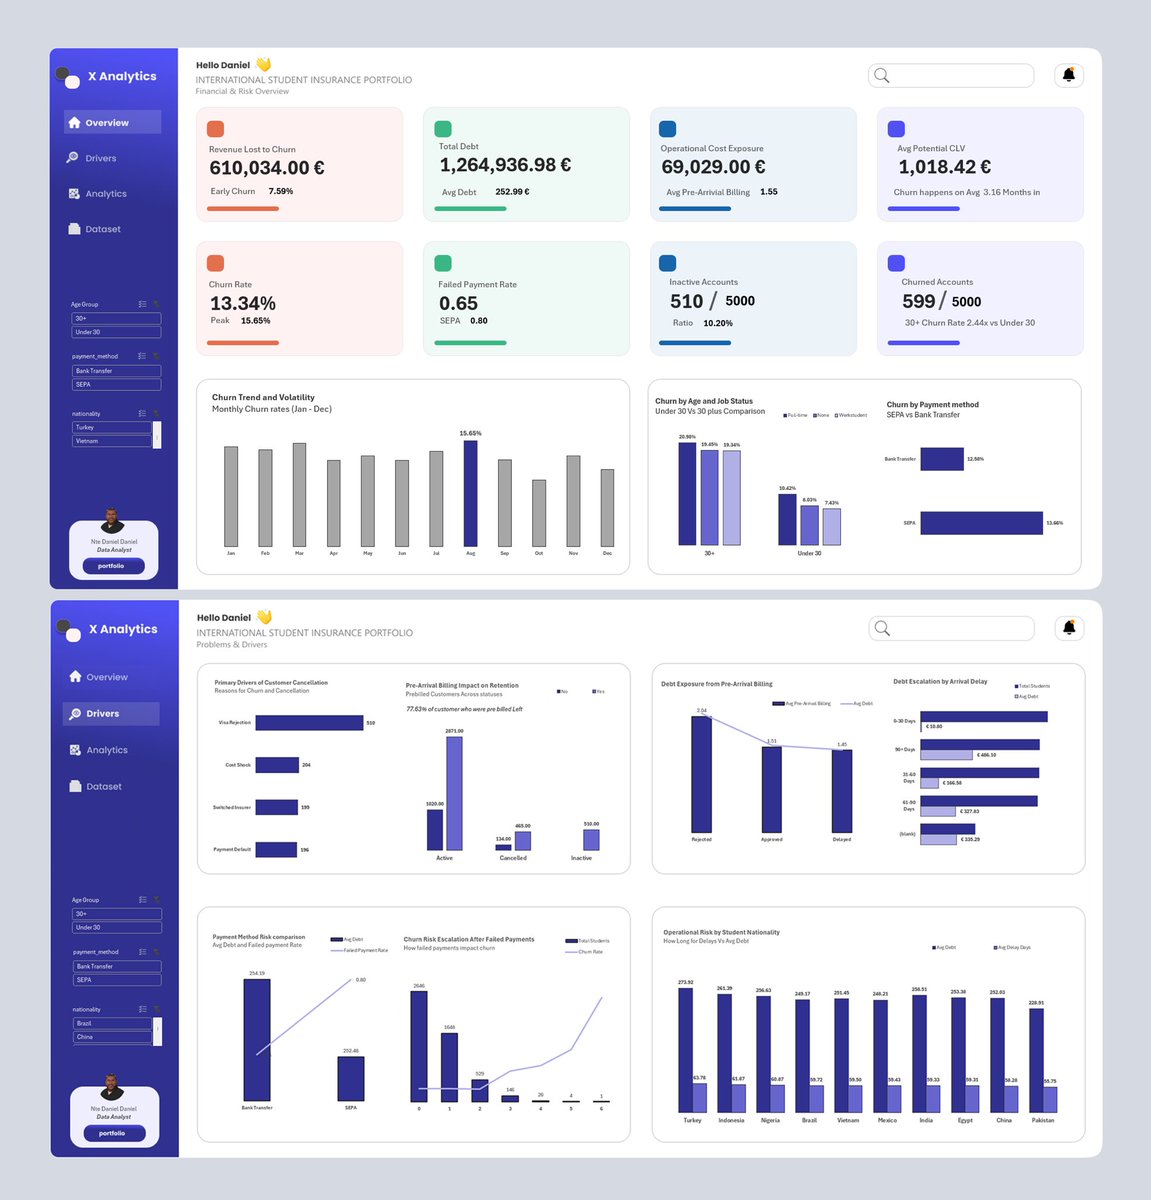
𝗧𝗛𝗘 𝗗𝗔𝗦𝗛𝗕𝗢𝗔𝗥𝗗
Built entirely in Excel using:
→ Power Pivot measures
→ Pivot-driven KPI cards
→ Segmentation analysis
→ Behavioral and operational risk drivers
Page 1: Financial exposure (debt, churn losses, operational cost)
Page 2: Drivers of churn and risk (payment behavior, visa outcomes, delay buckets, nationality clusters)
No fancy tools.
Just Excel and clean thinking.
𝗪𝗛𝗬 𝗧𝗛𝗜𝗦 𝗠𝗔𝗧𝗧𝗘𝗥𝗦
The goal wasn’t flashy visuals.
It was building something that could realistically be presented to an insurance operations team.
Something that answers:
“Where do we lose money?”
and
“Which customers are high-risk?”
This is what real analytics looks like.
You don’t need Tableau or Python for every project.
You need to understand the problem and connect the data to business decisions.
Sometimes the most interesting analytics projects aren’t about complex models.
They’re about making hidden risk visible.
#DataAnalytics #Excel #BusinessIntelligence #Datafam
*Vacancy Announcement*
These roles are required for a start-up Bulk Distribution Company (BDC - Oil & Gas) sector.
- Head of Commercial
- Sales Executive (1)
- HR & Administration Officer (1)
- Operations Manager (2; Accra & Kumasi)
- Accounts Officer (1)