here's how to steal from outside ur niche in 2 mins:
- find a winning ad from a completely unrelated niche
- upload it to gemini
- prompt: "deconstruct the core psychological framework of this ad and apply it to [my product]"
- that's it
congrats you just unlocked angles your competitors will NEVER find because they're too busy copying each other
here's how to find the best emotional triggers for your native ads:
- open gemini or manus
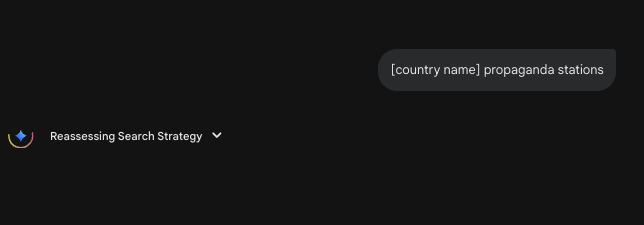
- search "[country name] propaganda stations"
- analyze the psychological frameworks they used
- adapt the emotional triggers to your copy
congrats you just tapped into 100 years of A/B tested persuasion techniques that moved entire populations
use this prompt with deep research:
You are a market research analyst specialized in psychological angle discovery.
Task:
Identify low competition marketing angles by analyzing non English discussions.
Instructions
Target niche: [insert niche]
Core pain points to search: [insert 3 to 5 common pain keywords]
Languages to analyze: [spanish, croatian, etc]
Platforms: Reddit, local forums, Facebook groups comment sections
Process:
Simulate real discussions written by native speakers in the selected languages.
Extract the exact phrases people use to describe
a. Their pain
b. Their frustration with existing solutions
c. Their doubts objections and disbelief
Do not translate literally. Preserve intent emotion and tone.
Identify recurring emotional triggers that are underused in English markets.
Output format:
- Section 1 Raw native language phrases with short context
- Section 2 Psychological meaning behind each phrase
- Section 3 English adapted angles written as ad hooks or content angles
- Section 4 Why these angles are low competition in English speaking markets
Rules:
- No generic advice
- No marketing clichés
- Focus on emotional language real objections and lived experience
If your static ads get $0 in spend on Meta
Here is the easiest way to make static ads that print.
Shouldn't be sharing this... But f*ck it.
Step 1: Go to AdSpy
Step 2: Type in any 7-9 figure brand you like that is NOT your direct competition (trust)
A few of my favorites:
Grüns
Norse Organics
Huel
Step 3: Filter in AdSpy by shares (not the longest running)
Step 4: Download 5-10 ads so you have a context library
Step 5: Go to Claude AI and make a Claude project
Step 6: Pump that Claude project full of all of your customer reviews, feedback surveys, Facebook ad comments, and any market research you've done.
Make sure you also add all of your target avatars, product information, and brand guidelines.
Step 7: Now in the chat (not the project) upload the static ads that you found from AdSpy.
Step 8: Copy and paste this prompt
-- START PROMPT --
Start here: You are going to be helping me write an ad brief to create a winning Facebook & Instagram image ad. A winning Facebook & Instagram image ad is defined as a bold and scroll-stopping image with a powerful headline that ultimately allows the company to increase advertising spend profitably, and acquire more new customers.
Please keep in mind that these image ads will need to be focused on specifically attracting NEW CUSTOMERS as ads that can attract and convert new customers are the only ads we are focused on making.
So when writing these Facebook & Instagram ads, keep in mind the target avatar we will be focusing on will likely have never heard of our brand and does not care who we are. They only care about themselves. So this image ad has to appeal to them and show them we understand them.
Using all the data and insights you have in your project, you will now write 9 headlines for the image ads. Ensure you leverage the data in the research document, are writing it for the specific avatar, the correct product.
Also, make sure the written headlines are short (6-10 words max) and are written with one key objective in mind: to stop the scroll of our target avatar and grab their attention to learn more and ultimately purchase from our company
For each ad concept:
1. Attach a small tagline/sub heading with it
2. Reference the example ad from the context images provided that you used to come up with the headline and how you made it work for my brand and avatar specifically
3. Briefly explain why this headline will stop our potential avatar’s scroll
4. Provide 2 other iterations of that main headline for me to choose from that follow the same idea.
--- END PROMPT --
Step 9: Let Claude cook 🍳
Step 10: This is where some kind of skillset is required because you have to know which headlines are 🗑️ and which ones are 🔥
But this prompt should chef up some bangers for you
Step 11: If you have a graphic designer, you're good. Send these over to him/her let them cook.
If you don't have a graphic designer (you should likely get one or give your video editor access to @karlocreates community: eComTalent)
Step 12: But, go to Canva, Adobe, Figma or whatever visual editor you want to use.
Put the headline on a CONGRUENT image in bold text and make SURE it is kept within a 1x1 window so it's visible in all formats on Meta.
If you don't have a congruent image, use a product photo.
Simple.
Step 13: Give it to Zuck and let him cook.
I've never thought I'd do this...but here we go
I thought if I shared this, I'd be giving away everything I know
But it doesn't matter
I figured out how to consistently make brands $1M/mth with Facebook Ads
I decided to film a video on the exact blueprint we use to do it
This won't get crazy engagement
But for those that find this gem, it'll supercharge your business
Bookmark this:
- MARKET STRUCTURE -
- Basics
@Moneytaur_ does not reference market structure often, not because its not important, but because these basics should be learned elsewhere. For this writeup, here’s a brief refresher before moving to some MT-specific concepts.
-------
- Trends
Trends are always relative to the timeframe.
Higher timeframe trends dominate lower ones.
Bullish Trend
Consists of a series of higher highs and higher lows.
Bearish Trend
Consists of a series of lower highs and lower lows.
📝A sideways trend is made up of smaller trends confined to a range.
-------
- Structure
Market structure is the foundation on which all key concepts in MT’s trading style are built. Liquidity, imbalances, and supply and demand are all rooted in structure.
Price action is the process that builds this foundation. PA follows liquidity, and this constant search for liquidity shapes structures.
Imbalances between buyers and sellers create directional moves (FVGs), while balance creates fair value zones (Ranges).
Balance → Imbalance → Balance → Imbalance
“If there’s no significant imbalances, there will be OBs and Supply/Demand fresh levels. If there’s no OBs and Supply/Demand fresh levels, there will be significant imbalances.
If there’s none at all it will ⚡️ into a ‘fresh’ level and build a new trading range.
Few…” https://t.co/UOSYiuqJrm
The higher the timeframe, the more robust the structure and the more reliable the signal. HTF > LTF.
Structure defines supply and demand, premium & discount, and creates liquidity zones. It also defines ranges. When price action moves beyond these range boundaries, there are four main possible outcomes:
• Break out/down: price breaks through the range and keeps moving.
• Rejection: price fails to break the range.
• Break out/down plus retest: price closes relevant candle bodies past the range and continues after retracing back into key liquidity.
• Fake-out: price breaks out/down, and then reverses.
Outcomes 3 and 4 differ clearly.
Fake-outs are usually sharp and aggressive, often leaving large wicks from stop hunts or liquidity grabs.
Retests tend to be slower and more deliberate, usually following higher timeframe candle closes past the prior range boundaries.
“Look for HTF body close above previous most significant swing highs. If not, it’s likely a false breakout. If it does, the highest probability play is waiting for a pullback into key level before continuation into the next HTF liquidity level, and if there’s none to take it will likely go to new ATH.”
https://t.co/0DG6h2dw79
- Internal vs. External Structure
External Structure
• The overall trend visible on a higher timeframe (relative to a lower timeframe).
• A weekly chart is made up of seven daily candles; compared to the daily, the weekly is external structure.
Internal Structure
• The smaller movements within the higher timeframe, seen on lower timeframes.
• Shows smaller trends inside the larger move.
Internal structure can shift short-term without changing the external trend. Always let the external (HTF) structure guide your HTF bias; internal structure offers early clues.
Example: (📈 in comments)
This 2W chart is external structure and clearly in an uptrend.
On this daily chart of the grey box, we are in a downtrend. This is internal structure.
The examples highlight the importance of always seeing structures in relation to each other.
M > W > D > H > M > S
Internal structure shifts can be the early clue that external structure may change. Let the higher timeframes define the macro structure and watch for early signs on lower timeframes.
-------
- Market Phases
The Four Market Phases
Accumulation
• Typically follows a downtrend but can appear anywhere market makers prepare for markup.
• The range lets market makers accumulate while pushing news to fit the narrative.
Buy Program (Bull Market/Markup)
• Follows accumulation or re-accumulation.
• The asset appreciates in value.
Distribution
• Typically follows an uptrend but can appear anywhere market makers prepare for markdown.
• The range lets market makers offload while pushing news to fit the narrative.
Sell Program (Bear Market/Markdown)
• Follows distribution or re-distribution, depending on context.
• The asset depreciates in value.
(📈 in comments)
- The Psychology of the Phases
Accumulation
Emotion: Skepticism, disbelief, apathy
Psychology: Most traders are fearful or disinterested. Market makers are quietly buying.
Behaviour: Retail avoids the market; volume is low; sentiment is bearish or indifferent.
Media manipulation: The most bearish news marks the bottom. “Markets are dead.”
Bull Market (Markup/Buy Program)
Emotion: Optimism, excitement, euphoria
Psychology: Confidence builds as prices rise. Retail starts buying in; FOMO.
Behaviour: Volume increases; media turns positive; public participation grows.
Media manipulation: Coverage increases and sentiment turns bullish in line with price.
🔺Intensifies with trend
Distribution
Emotion: Greed, overconfidence, denial
Psychology: Retail believes the trend will continue; smart money is offloading.
Behaviour: Volatility increases; price chops; bullish sentiment remains high.
Media manipulation: News remains bullish; influencers push FOMO narratives.
Bear Market (Markdown/Sell Program)
Emotion: Anxiety, fear, panic, capitulation, despair
Psychology: Retail sells in panic. Smart money prepares to accumulate again.
Behaviour: Heavy selling; negative news cycle; retail sells at loss.
Media manipulation: After the initial selloff, fear-driven headlines dominate.
🔺Intensifies with trend
🔺Understand that the system runs on predictable human behaviour. Stay hyper-aware of your own emotions and learn to flip them into signals instead of traps.
“When you feel you will make a lot of money by holding, it is close to the top. When you feel you will lose all your money by holding, it is close to the bottom.
Your own fear and greed emotions are two of the most powerful indicators you will ever find.” https://t.co/oHAxhgJtCy
-------
- Market Structure Shifts
Changes in structure are vital for gauging the probabilities of the next move. Understanding these shifts and the patterns that reveal them is essential for becoming consistently profitable.
BOS – Break of Structure
A BOS occurs when price closes relevant candle bodies past a significant high or low. It confirms a change in structure.
CHoCH – Change of Character
A CHoCH happens when price breaks structure in the opposite direction of the current trend. It’s the first signal of a possible trend reversal.
BOMS – Break of Market Structure
A BOMS is a clear break of market structure, usually on higher timeframes and significant levels. It confirms a shift in intent when validated and often shows higher volume and leaves FVGs behind.
- Trend Changes
Using trends, BOS, CHoCH, and BOMS helps identify key structural shifts in the market. Knowing when the market transitions from a buy to a sell program is crucial for being profitable.
“Buy program: Bullish BBs work wonders.
Buy program: Bearish BBs can often fail, unless optimal.
Sell program: Bearish BBs work wonders.
Sell program: Bullish BBs can often fail, unless optimal.” https://t.co/CWKVFBwZSe
Putting all learned concepts together helps us spot potential tops forming. Using the ideas above gives us further confirmation.
(📈 in comments)
-------
- MT’s 1,2,3 System (Squiggles)
For MT, structural shifts are an essential part of his setups. The system has three parts:
• A valid break of a key level (BOS)
• A retrace into liquidity
• Entry at the refined level to ride the reversal
This approach ensures we get the optimal entry after fuel is taken, letting us ride the trade longer with clearer invalidation and better RR.
“There’s no MTF or HTF candles closing above key PSH, so you don’t long here. For the highest probability long it’s the squiggle on the chart, with MTF (at least) close above key PSH plus pullback (the entry) before bullish continuation.” https://t.co/DwsTmv5NUI
“All “squiggles” mean the strategy is to wait for close above or below HTF key levels as stage 1 of 3, pullback or retracement into key levels if you can find them, and most of the time you can because bots always leave such levels with fuel behind, to come back later and reverse price again as stage 2 of 3 and this is your entry, and then continuation into the direction of the first move, stage 3. This is how these liquidity games work.”
https://t.co/20IM2XZU8d
Breakout trading is popular, but charts like the one below, and the effectiveness of squiggles, show its weakness clearly.
“You can always choose to long the breakout, but this isn’t going for high probability as it’s what all retail traders do, and the game’s designed to stop or liquidate them all, collecting fuel, and then proceed in the direction retail traders expected, which will then make them start revenge trading as they were ‘right but wrong’.”
-------
- Using Liquidity as a Guide
Market makers leave footprints that help us assign probabilities to the next move. Liquidity is key. When key levels are left behind and price action approaches a level without taking the liquidity first, chances are high, it will revisit to grab that fuel before continuing.
“A helpful hint to determine if a breakout will reverse into a key level before trend continuation is to check if there’s a key level left behind in the previous range that price is attempting to break out from. If the key level is present, especially on HTF and you can refine it into lower timeframes, the probability of a pullback into that level before continuation becomes significant, as price tends to gravitate toward such levels. Additionally, if there’s a key level above the swing high that can be taken, it could act as fuel for a drop into the lower level, setting up for a subsequent pump.” https://t.co/dLb32EUytJ
Alternatively, when no such levels exist, the probability is higher that the breakout/down is real and price action will continue in the direction.
“If you cannot find such, the probability for breakout into price discovery, without looking back for a while, is higher.” https://t.co/uxu7gczPIQ
-------
- Confirming a BOS
In general, higher timeframe structures need higher timeframe confirmations. Use timeframes relevant to the trade. For higher timeframe levels MT often looks for closures 12h or higher. Further HTF closures add confluence and reinforce the likelihood the break is real.
Always watch for body closes above or below the swing high or swing low.
(📈 in comments)
Without a confirmed BOS, we risk falling for fake moves. A confirmed BOS marks clearer intent. Wait for the signal, place orders where the fuel sits, and ride the continuation.
🔺Lately, more HTF closes have resulted in reversals. Market makers are aware that retail is looking at daily closes.
“Don’t fall for false moves. Learn to identify confirmed BOS on HTF and you will level up instantly.”
(📈 in comments)
There’s no single timeframe that automatically invalidates every setup. The last five minutes of a HTF candle can close below a level without any real prior price action in that area. Zoom in on lower timeframes and check what’s happening. Look for signs of strength or weakness to support your decision. Stay flexible and weigh all factors.
Things to consider:
• How optimal is the level?
• Where is the level located?
• Is the asset high volume?
• What are majors doing?
• How does price behave around the level?
• Are newly formed LTF structures being respected?
• Is there spoofing?
• What is order flow showing?
MT has posts calling for 12H+ closes to confirm or reject a level; others rely on 2H. This is closer to an art than a rule, an edge that only comes through screen time and real experience.
“Take notes on this PA, because it will change your game. You can go through timeframes up until 2H and you will notice there’s no candle bodies closing below the level where the 2D BB is at. The hint is there. From here I’ll wait for key SH or SL to be taken and find an entry on pullback or retracement. 0 candle bodies closed below 2D BB. Body, not whisker. At least a 2H full body, specifically for SOL as it’s a high TV coin.” https://t.co/NWU3jY4LnM
-------
- Timeframes
Moneytaur has his own definitions of timeframes. You can either adopt his schematics or come up with definitions that are a better fit for you.
“micro TF: 5min and lower
LTF: 15min > 2H
MTF: 2H > 12H
HTF: 12H > M+” https://t.co/ddmUmlaFK9
HTF (12h+)
• Hold the most liquidity and are the most reliable.
• The higher the TF, the clearer the signal of the predominant trend.
• 1W+ are macro timeframes.
• HTF plays = up to 3% of trading account, max 5% if optimal.
MTF (2h–12h)
• First reliable validations of BOS, CHoCH, BOMS.
• Key for refining levels.
• MTF plays = up to 2% of trading account.
LTF (5m–2h)
• Super-refined entries, exits, and stops.
• First possible signs of BOS, CHoCH, BOMS.
• Less reliable as they hold less liquidity.
• LTF plays = up to 1% of trading account.
mTF (<5m)
• Ultra-refined entries, exits, and stops.
• Entries or exits based on micro structure reactions to key levels.
“In micro timeframes, you can better see when a price reversal is likely, since the ⚡️ at key levels is a powerful sign of that. If you spend time in those timeframes when the price is reaching key levels where you expect a reaction, you’ll start to notice a pattern and better understand whether a reversal can actually occur or if the reaction is too weak. As for the ‘ping-pong’ at key levels, it’s the same, but weaker than in lower timeframes and harder to read, since you don’t see proper candle bodies, so you just have to get used to it.”
📝Note on Timeframes and TradingView
• TradingView anchors all intraday timeframes to the daily close.
• Timeframes that do not evenly divide into 24h will produce one partial candle at the end of each daily session.
• This shorter candle is always the last candle before the session reset at 00:00 UTC.
• So a 23h candle is 1 x 23h + 1 x 1h candle. When trading a 23h level, the chance is high that you are in reality taking a trade based off a 1h hOB.
Announcement - Hidden Liquidity for everyone
We are very pleased to tell you, that we have officially released two new versions of our Hidden Liquidity indicator inclunding a FREE and a BASIC model.
The FREE version includes:
•Current timeframe HOB detection
•2 additional timeframes
•Partial HOBs
•HOBs
•Multiple colour options
•EQ- mode (Equilibrium)
Here is the link: https://t.co/OOZP9hCUdy
Alongside this, we have also released a BASIC version, which is more affordable and includes the following features:
•Extended boxes
•Multiple colours
•Merging labels
•Individual range
•Custom minimum HOB size
•Custom engulfing settings
•8 custom timeframes
•Partial HOBs
•Mitigated HOBs
•Custom name
•Clustering engine
You can find more information on https://t.co/SHXBonPswX
Our intention with these releases is to make Hidden Liquidity tools accessible to everyone.
We believe that every trader, regardless of experience or income, should have the opportunity to use high-quality liquidity indicators.