For 11 months I posted consistently and got nowhere.
Not because I was lazy. Because I had no real strategy.
That changes now.
The plan is simple. Document everything I learn about finance and building online. No fluff. No recycled advice. Just real progress in public.
Goal: 1,000 followers. One year. Starting today.
Watch this.
DAY 27 | Finance Unlocked | What Actually Happens Inside a Mutual Fund Every Single Day
You invest in a mutual fund. The NAV moves. Your portfolio value changes.
Most people stop there.
They never ask the more interesting question.
How does a fund manager make sure that a person who invested Rs. 1,15,000 and a person who invested Rs. 15,000 both get exactly the same percentage return?
The answer is units.
Here is how it works.
Five family members pool their money into a single fund. Total capital: Rs. 2,75,000.
To divide ownership fairly, the fund manager issues units at a starting notional value of Rs. 10 per unit.
Aunt invested Rs. 1,15,000. She gets 11,500 units. Father invested Rs. 55,000. He gets 5,500 units. Uncle invested Rs. 65,000. He gets 6,500 units. Brother invested Rs. 25,000. He gets 2,500 units. Nephew invested Rs. 15,000. He gets 1,500 units.
Total units issued: 27,500. Each unit worth Rs. 10 at the start.
Now the fund manager deploys the entire Rs. 2,75,000 across 10 stocks. Rs. 27,500 into each position equally.
Day 2 arrives. The market moves. Total portfolio value rises from Rs. 2,75,000 to Rs. 2,77,844.
Absolute profit: Rs. 2,844. Daily return: 1.034%.
Now here is where the unit system does its job.
Instead of manually calculating each investor's share of Rs. 2,844 separately, the fund manager simply updates the NAV.
New NAV = Old NAV multiplied by (1 + Fund Return Percentage). New NAV = Rs. 10 multiplied by (1 + 0.01034). New NAV = Rs. 10.1034.
Every unit in the fund is now worth Rs. 10.1034.
Aunt has 11,500 units. Her investment is now worth Rs. 1,16,189. Nephew has 1,500 units. His investment is now worth Rs. 15,155.
Different absolute profits. Identical percentage return.
That is the elegance of the unit system. It does not matter how much you put in. The percentage gain is always the same for every investor in the fund.
And this is what NAV actually is.
NAV = Market Value of All Portfolio Assets minus Total Operating Expenses, divided by Total Outstanding Units.
It is not a stock price. It is the per unit value of the entire fund recalculated at the end of every single trading day.
One more thing worth knowing before you go.
There is an important rule about how NAV works when someone new wants to join a fund that is already running.
If a new investor joins on Day 3, they cannot buy units at Rs. 10.
The fund has already grown. Issuing units at the old Rs. 10 rate would silently dilute the existing investors' returns.
New investors must buy units at the live NAV of Rs. 10.1034.
Every new rupee entering the fund gets priced at today's value. Not yesterday's. Not the starting value. Today's.
Follow along for Day 28.
DAY 26 | Finance Unlocked | Where Does Your Money Actually Go When You Invest in a Mutual Fund?
Most people have invested in a mutual fund at some point.
Or at least thought about it.
But here is something almost nobody actually knows.
What happens to your money after you click buy?
Not the returns part. Not the NAV part. The actual journey your capital takes from your bank account to a diversified portfolio.
Let me walk you through it.
Step 1. You transfer your capital into the mutual fund structure.
Your money does not go directly into stocks. It enters a collective pool alongside thousands of other retail investors. That pool is the mutual fund vehicle itself.
Step 2. The pool reaches the Asset Management Company.
The AMC is the operational engine behind every mutual fund you have ever heard of. HDFC Mutual Fund. SBI Mutual Fund. Mirae Asset. Each one is an AMC. They house the research teams, the analysts, and most importantly, the fund manager.
Step 3. The Fund Manager takes over.
This is where the professional management actually happens.
The fund manager does not just pick stocks. The job involves exhaustive corporate research, building an investment thesis for each target company, deciding how much capital weight each holding deserves, constructing the full portfolio, monitoring every position, measuring performance, and filing official disclosures.
Seven distinct responsibilities. All running simultaneously.
Step 4. The securities land with the Custodian.
When the fund manager executes a buy order, the resulting shares do not sit with the AMC. They are transferred to an independent custodian. A separate entity whose only job is to hold those securities safely.
Think of the custodian as the vault. The fund manager decides what goes in. The custodian makes sure it stays there securely.
Step 5. Your investor records go to the RTA.
The Registrar and Transfer Agent handles everything on your side of the transaction. Your folio number. Your account records. Your redemption requests. They are the administrative layer between you and the fund.
Now here is why this entire structure exists.
SEBI does not let one entity control everything.
The sponsor who sets up the fund cannot run it. The trustees who oversee the fund must remain completely independent from the sponsor. The custodian who holds the assets is separate from the AMC that manages them. The RTA that handles your records is separate from everyone else.
Every layer exists to eliminate one specific conflict of interest.
Your money passes through five independent entities before it reaches a stock. Not because the process is complicated. Because each layer is a protection mechanism designed to make sure no single party can mishandle your capital without accountability.
Follow along for Day 27.
DAY 25 | Finance Unlocked | The Two Levers That Actually Get You to Rs. 7.2 Crores
We know the target. Rs. 7.2 crores.
We know how portfolio returns are calculated.
Now the real question.
How much do you actually need to invest every month to get there?
To simplify this, consider equities as your primary growth engine.
Long term equity CAGR, conservatively estimated at 11% per annum.
Invested through a Systematic Investment Plan.
With a 10% step up every year to match your rising income.
Here is what that looks like in practice.
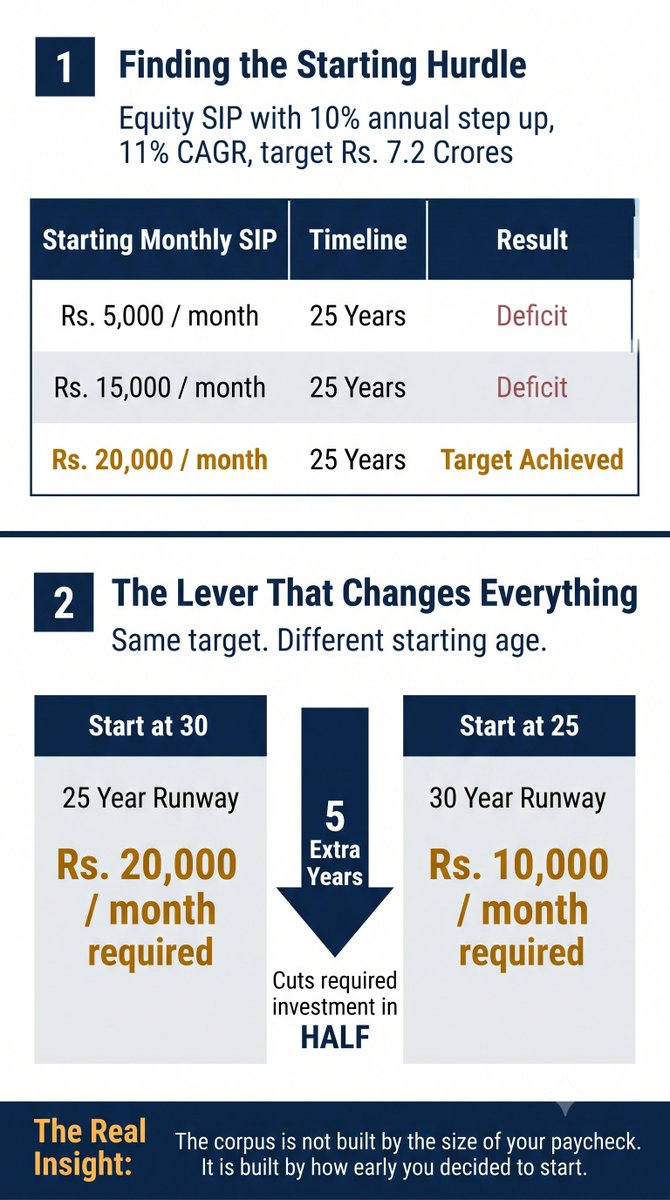
A Rs. 5,000 monthly SIP, even with the 10% annual step up, falls significantly short of Rs. 7.2 crores over 25 years.
Push it to Rs. 15,000 a month. Still short. Closer, but not enough.
Push it to Rs. 20,000 a month. Now you hit the target. Approximately Rs. 7.2 crores at the 25 year mark.
So the number that matters is Rs. 20,000 a month, starting today, stepping up 10% every year, for 25 years.
But here is the insight that changes everything.
What if you started 5 years earlier.
Same target. Same Rs. 7.2 crores.
Except now your timeline extends from 25 years to 30 years.
The required starting investment drops from Rs. 20,000 a month to just Rs. 10,000 a month.
Half.
Same destination. Half the monthly burden.
Simply because you gave your money 5 extra years to compound.
This is the entire game.
Most people think reaching a large number requires a large income.
It does not.
It requires time.
Starting early is not a nice to have.
It is the single most powerful lever in this entire framework.
That closes out this arc.
The corpus is not built by the size of your paycheck.
It is built by how early you decided to start.
DAY 24 | Finance Unlocked | How to Actually Calculate Portfolio Returns
Rs. 7.2 crores sounds impossible until you understand how a portfolio actually generates returns.
Most people think portfolio return means picking one asset and hoping it performs well.
That is not how it works.
Your portfolio return is the weighted average of every asset class you hold.
The formula is simple.
Portfolio Return = Sum of (Weight of each asset multiplied by its expected return).
Let me show you with a real breakdown.
Assume your net worth is distributed like this.
Real Estate: 30% of your portfolio at 10% CAGR. Contributes 3.0%.
Fixed Deposits: 8% of your portfolio at 7% CAGR. Contributes 0.56%.
Gold: 8% of your portfolio at 9% CAGR. Contributes 0.72%.
Equities: 13% of your portfolio at 11% CAGR. Contributes 1.43%.
Liquid Cash: 4% of your portfolio at 0% CAGR. Contributes 0%.
Asset Class X: 37% of your portfolio at 7% CAGR. Contributes 2.59%.Total weights: 100%.
Aggregate Portfolio Return: 8.3%.
One thing to flag here. In a real portfolio, that remaining allocation would be distributed across whatever other assets you hold. The concept remains exactly the same regardless.
Notice something important. No single asset class is doing all the work.
Each one contributes a small slice based on how much capital you have allocated to it.
This is why diversification is not just about reducing risk.
It is a calculation. A deliberate design. You are not hoping for 8.3%.
You are engineering it through allocation.
Change the weights, the return changes with it.
Increase equity allocation, expected return rises but so does volatility.
Increase fixed deposits, return stabilizes but slows down.
Every portfolio is a trade off you are actively making whether you realize it or not.
Follow along for Day 25.
Your portfolio return is not luck.
It is the direct mathematical output of the decisions you already made.
Day 23 | Finance Unlocked | Why Your Retirement Math Is Probably Wrong
Most people calculate retirement using simple multiplication.
I need Rs. 50,000 a month.
Multiply that by 20 years of retirement.
Rs. 1.2 crores. Done.
That calculation is dangerously wrong.
It assumes the cost of living 25 years from now will be exactly what it is today.
It will not.
Inflation is the part everyone forgets.
A fixed Rs. 50,000 today buys a certain basket of goods.
The same Rs. 50,000 decades from now buys a fraction of that basket.
So the real question is not what you need today.
It is what today's lifestyle will cost when you actually retire.
Here is the real math.
Current annual requirement: Rs. 6,00,000.
Inflation rate: 5% annually.
Time until retirement: 25 years.
Run that through the Future Value formula.
FV = Rs. 6,00,000 multiplied by (1.05) to the power of 25.
FV = Rs. 20,31,813.
It is not a typo.
Your Rs. 50,000 a month lifestyle today costs Rs. 20,31,813 a year by the time you retire.
Now apply that inflated number across all 20 years of retirement.
The real corpus you need is not Rs. 1.2 crores.
It is Rs. 7.2 crores.
That is the gap between what most people assume and what is actually required.
Follow along for Day 24.
Retirement planning is not about today's number.
It is about what today's number becomes by the time you need it.
Day 22 | Finance Unlocked | The Number That Decides If an Investment Is Worth It
Yesterday we learned how to bring future money back to today.
Today we go the other direction.
If you have money right now, how much will it be worth in the future?
That is Future Value.
The formula is straightforward.
FV = Principal multiplied by (1 + R) to the power of n.
Where n is time in years and R is your opportunity cost rate.
Now here is the distinction that most people miss completely.
Future Value uses the same algebraic structure as the compound interest formula.
But R means something completely different in each one.
In compound interest, R is the actual realized growth rate your asset generated.
How much the investment literally grew.
In Future Value, R is your opportunity cost.
The rate your money could have earned if you had deployed it into the next best available option instead.
Why does this distinction matter?
Because Future Value is not just a calculation.
It is a decision making tool.
Before committing capital to any investment, you run Future Value using your opportunity cost as R.
That tells you the minimum your investment needs to return to be worth doing at all.
If the investment cannot beat your opportunity cost, you are better off putting the money into a risk free government bond and going home.
Here is a simple example.
You have Rs. 1,00,000 today.
Your opportunity cost is 9% annually.
You are evaluating an investment over 10 years.
FV = Rs. 1,00,000 multiplied by (1.09) to the power of 10.
FV = Rs. 2,36,736.
That is your hurdle.
Any investment you consider over 10 years must return more than Rs. 2,36,736 to justify the risk of not just sitting in a government bond.
Most people evaluate investments by asking "can I make money on this?"
The right question is "can this beat what my money would have earned anyway?"
Follow along for Day 23.
Every investment competes with your best alternative.
If it cannot win that race, it is not worth the risk.
@AlexHormozi Yes that is the thing most people try to do as a beginner but what I have learned is all the rich people have earned their wealth from one significant source of income and then diversified.
Day 21 | Finance Unlocked | Why Rs. 7,50,00,000 Tomorrow Is Not Worth Rs. 7.50,00,000
Most people think money is money.
Same number. Same value. Whenever you receive it.
That is one of the most expensive misconceptions in personal finance.
Here is the reality.
Rs. 100 in your hand today is worth more than Rs. 100 promised to you a year from now.
Not because of inflation.
Not because you do not trust the person promising it.
But because of opportunity cost.
The moment you have Rs. 100 today, you can deploy it.
Put it into a government bond. Let it compound.
By the time that promised Rs. 100 arrives next year, your Rs. 100 has already grown.
That is the Time Value of Money.
Money today is structurally more valuable than the same money tomorrow.
Now here is where it gets interesting.
If money loses value as it travels into the future, then future money needs to be discounted back to what it is actually worth today.
That is called Present Value.
Let me show you exactly how this works with a real example.
Someone offers you a piece of real estate.
It will be worth Rs. 7.5 crores when you sell it in 15 years.
The question is not what it will be worth in 15 years.
The question is what that Rs. 7.5 crores is actually worth to you right now.
To find that, you need a discount rate.
Discount Rate = Risk Free Rate + Risk Premium.
The Risk Free Rate is what your money can earn with zero risk.
A 15 year government bond in India yields around 7.5%.
That is your baseline. The government does not default.
The Risk Premium is the extra return you demand for taking on the specific risk of this asset.
For real estate, add around 1.5%.
Total discount rate = 9%.
Now run the Present Value formula.
PV = Rs. 7,50,00,000 divided by (1 + 0.09) to the power of 15.
PV = Rs. 7,50,00,000 divided by 3.64.
PV = Rs. 2,05,90,353.
That is the insight.
Receiving Rs. 2.05 crores today is financially identical to receiving Rs. 7.5 crores in 15 years.
Provided your money can compound at 9% annually.
That one number changes how you evaluate every long term financial decision you will ever make.
Follow along for Day 22.
Future cash flows are not worth their face value.
They are worth what your money could have done in the meantime.
Day 20 | Finance Unlocked | The Wonder Einstein Talked About
Most people think compounding is about the rate of return.
It is not.
It is about what you do with the return after you earn it.
Here is the simplest way I can show you this.
Take Rs. 100. Put it to work at 20% a year.
After Year 1 you have Rs. 120.
Now two people make two different decisions.
Person A reinvests the Rs. 20 profit and lets it sit.
Person B withdraws the Rs. 20 and feels smart about it.
Year 2.
Person A earns 20% on Rs. 120. Ends up with Rs. 144.
Person B earns 20% on Rs. 100 again. Ends up with Rs. 120.
Year 3.
Person A earns 20% on Rs. 144. Ends up with Rs. 173.
Person B earns 20% on Rs. 100 again. Ends up with Rs. 120.
Total profit after 3 years.
Person A made Rs. 73.
Person B made Rs. 60.
The difference is Rs. 13.
That does not sound like much.
And that is exactly the problem.
In the early years, compounding does not feel like a superpower.
It feels like patience with a small bonus attached.
The gap looks almost identical in Year 1.
Slightly different in Year 2.
A little more in Year 3.
So most people look at that small gap and think the reinvestment is not worth it.
They withdraw. They redeploy. They chase something faster.
And they exit right before the curve bends.
Einstein reportedly called compound interest the eighth wonder of the world.
The reason it feels like a wonder is because it does not reveal itself early.
It builds quietly for years and then accelerates in a way that feels almost unfair.
Follow along for Day 21.
Compounding does not reward the most aggressive investor.
It rewards the most patient one.
Day 19 | Finance Unlocked | 10 point checklist.
Yesterday we built the watchlist.
Now every company on that list needs to pass a test before you spend serious time researching it.
A 10 point checklist.
Not every company will clear all 10.
But the ones that do are worth your full attention.
Here we go.
1. Gross Profit Margin above 20%
This tells you if the business has real pricing power.
A company that cannot maintain margins above 20% is vulnerable to any input cost shock.
Raw materials go up. Profits collapse.
2. Revenue Growth in line with Operating Profit
Revenue growing but operating profit lagging behind is a red flag.
It means growth is coming from accounting adjustments, not actual market expansion.
Both need to move together.
3. EPS tracking with Net Profit
If net profit is growing but EPS is flat or falling, the company is quietly issuing more shares.
That dilutes your ownership.
Every rupee of profit gets split across more shares.
You own less of the growth than you think.
4. Low Debt
High debt means high finance costs.
High finance costs eat directly into net profit.
A business that earns well but carries heavy debt is one bad quarter away from serious trouble.
5. Consistent Inventory Days
If inventory is piling up, products are not moving.
Obsolete stock sitting in a warehouse is not an asset.
It is a liability waiting to be written off.
Consistent or tightening inventory days signal a healthy operation.
6. Sales growing faster than Receivables
If receivables are growing faster than sales, the company is forcing products onto distributors without actually collecting cash.
This is called channel stuffing.
The revenue looks real on the P&L.
The cash never arrives.
7. Positive Operating Cash Flow
This connects directly to what we covered on Day 16.
A business can be profitable on paper and cash flow negative in reality.
Operating cash flow above zero confirms the core business is generating actual liquidity.
Not just accounting profit.
8. Return on Equity above 25%
ROE above 25% means the business is generating strong returns on every rupee shareholders have put in.
But always cross check this with the debt level.
High ROE driven by high leverage is not the same as high ROE driven by operational excellence.
9. One or Two Focused Business Areas
A company trying to do everything usually does nothing well.
Focused businesses have focused management.
Focused management makes better capital allocation decisions.
Conglomerates spread thin rarely outperform over the long term.
10. Clean and Simple Subsidiary Structure
Complex subsidiary networks are where corporate capital quietly disappears.
Shell structures. Related party transactions routed through subsidiaries.
The simpler the structure, the harder it is to siphon value away from the parent company and away from you as a shareholder.
Now here is the most important thing about this checklist.
It is not a rigid rulebook.
It is a starting framework.
As your market experience deepens, you will refine it.
Some filters will tighten. Some will get nuanced.
That is how it is supposed to work.
No company will clear every single point perfectly.
Your job is to find the ones that come closest.
Follow along for Day 20.
The checklist does not find you great companies.
It filters out the ones quietly destroying your wealth before you even notice.
Day 18 | Finance Unlocked | How to build a Watchlist
We now know how to read financial statements.
We know what ratios to look at.
We know how to evaluate a company at a basic level.
But here is the question nobody asks next.
Which companies do you even research in the first place?
That is where the watchlist comes in.
And most people build it completely backwards.
They research first, then decide whether to track.
The right way is the opposite.
Put companies into your watchlist first.
Research them after.
The watchlist is not your portfolio.
It is your pipeline.
Now here is how you actually build one.
1. Your Own Observation
Peter Lynch built his entire investing philosophy around this.
He wrote about it in One Up On Wall Street.
The idea is simple.
You are already a consumer.
You notice which brands are expanding.
Which restaurants are always packed.
Which products your friends are switching to.
That observation is your first filter.
Use it.
2. Stock Screeners
You do not need to research every company from scratch.
Set filters based on what you already know matters.
ROE above 25%. PAT Margin above 20%. Clean cash flows.
The screener does the first cut for you.
You only deep dive into what survives the filter.
3. Macro Trends
When the government announces a massive infrastructure push, cement companies benefit.
You do not need to predict the future.
You just need to align with what is already moving.
Identify the trend first.
Then find the companies that sit directly in its path.
4. Sectoral Shifts
Industries do not stay the same forever.
Consumers shifting from traditional teas to functional energy drinks is a sectoral shift.
The companies that catch that shift early grow disproportionately.
Your job is to spot the transition before it becomes obvious.
5. Circle of Competence
Warren Buffett has said this for decades.
Invest in what you understand.
A doctor tracking pharmaceutical pipelines has an edge most analysts do not.
A banker reading credit variations sees things others miss.
Your professional knowledge is an investing asset.
Most people never use it that way.
You do not need to track 500 companies.
You need 20 that you genuinely understand.
Follow along for Day 19.
A great watchlist is not about finding every good company.
It is about finding the ones you can actually evaluate well.
Day 17 | Finance Unlocked | Financial Ratios
For 16 days, I broke down how to read a company.
What the market is.
How prices move.
What indexes track.
How to read an annual report. The P&L. The Balance Sheet. The Cash Flow Statement.
All of it was building toward one thing.
The moment you stop reading financial statements and start understanding them.
That moment is financial ratios.
Ratios are what turn raw numbers into answers.
Not “the company made ₹500 crore.” But “is ₹500 crore actually good for this company?”
That question is what separates a reader from an analyst.
Today we start answering it.
4 categories. Every ratio that matters. Zero textbook language.
Read the thread. 👇