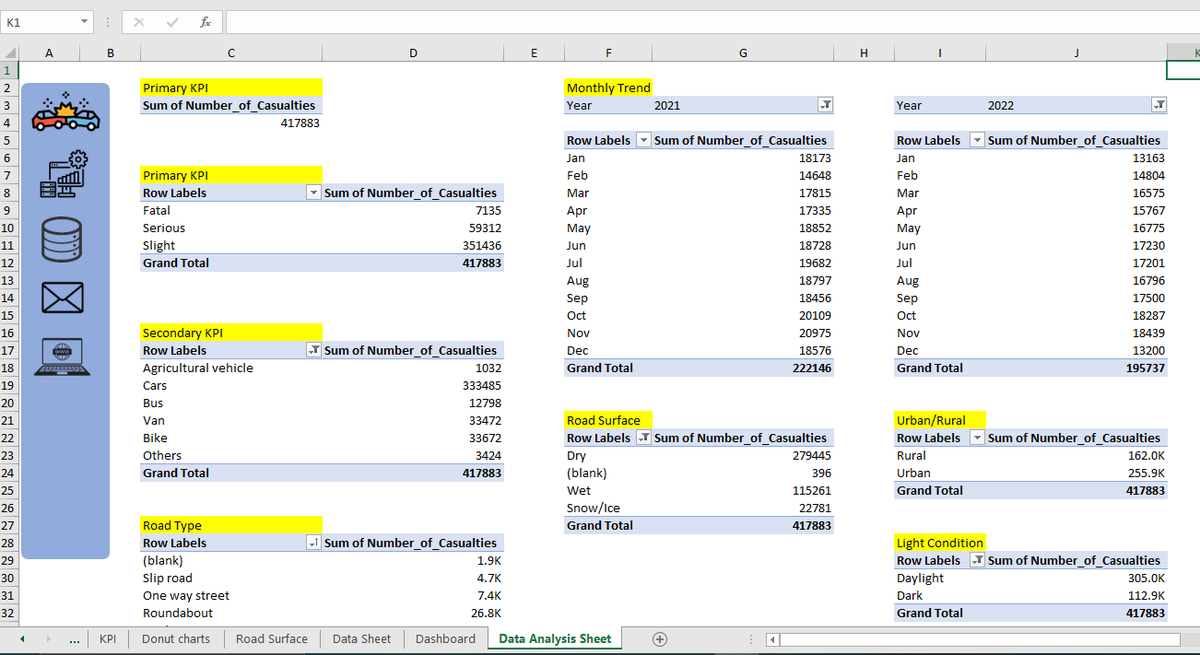
Each click on the side icons either takes you to the dataset, pivot table, email template, or the website that contains details about the incidents.
Excel is a cool tool with diversities. Still exploring Excel in visualization...I believe more can be done with it.
What do you use Excel for?
It might be a tool to store or enter data for you... however, it could be pretty much more than for other folks,
Yeah, folks like Data Analyst.
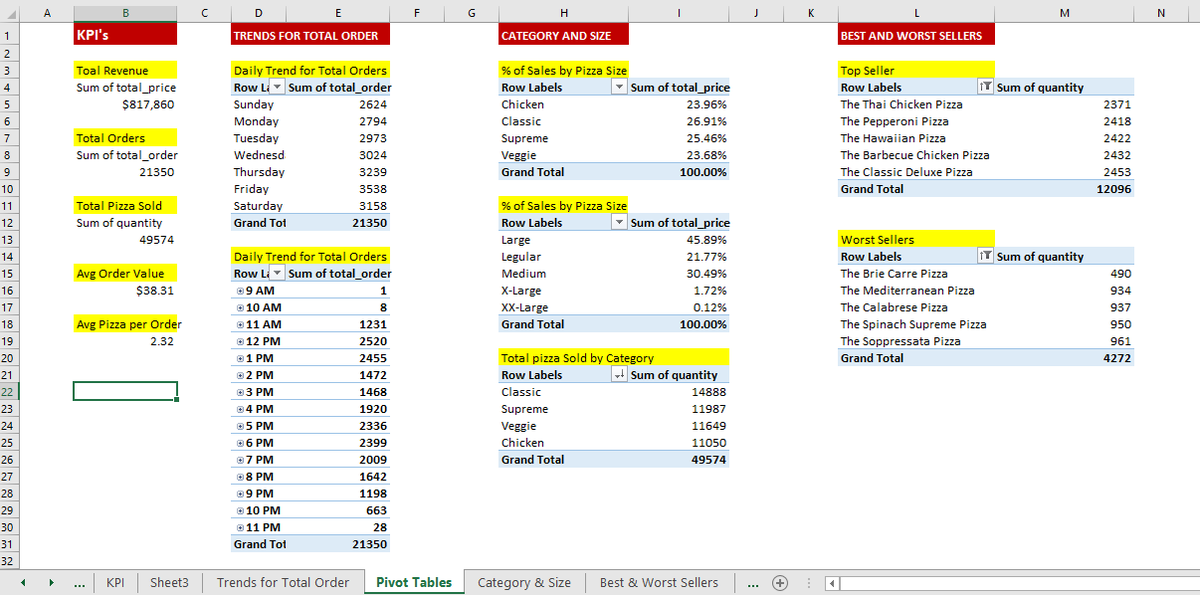
The above Dashboard was completely designed with Excel...one of my recent projects. It's highly responsive.
A highly responsive Excel Dashboard for a Pizza e-commerce brand.
Working with Excel in Data analytics, especially in visualization can be daunting, but it's interesting too!
What can you say about the Dashboard?
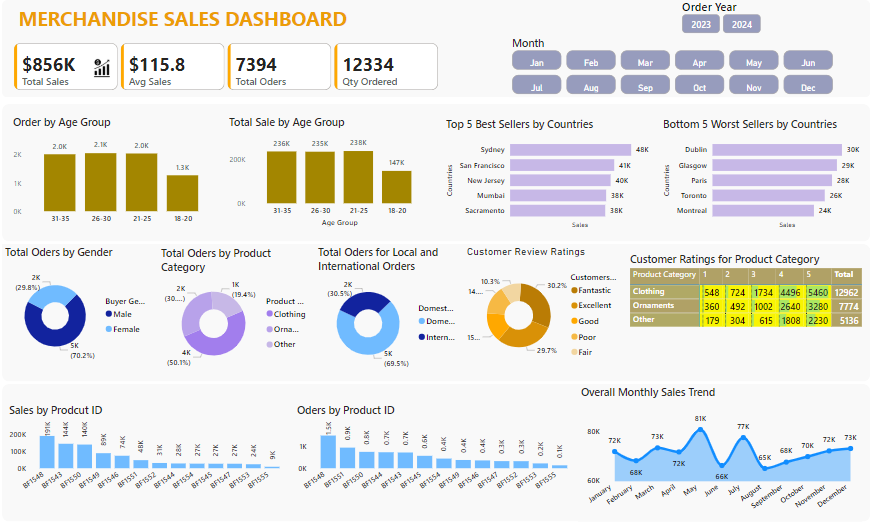
Recently participated in the Data Challenge for January 2025 organized by @OnyxData ...
It was an interesting ride, as I learned a couple of new and easy tricks in PowerBI.
This is what I drive satisfaction and joy doing...let's connect and do more.
#DataAnalytics