Excited to share my latest project: Football Match Analysis ⚽📊
Football Match Analysis is an end-to-end Python toolkit that transforms raw WhoScored/Opta match-event data into a complete post-match tactical analysis package.
Starting with a single WhoScored match URL, the project automatically collects the available match data, processes the event stream, calculates advanced metrics, generates tactical visualizations, creates individual player radar profiles, and assembles everything into a structured PDF report with data-driven English commentary.
Data collection and reliability
The project uses multiple data-collection methods to improve reliability:
• cloudscraper
• requests with rotating headers and session handling
• Beautiful Soup for HTML parsing
• Selenium and undetected-chromedriver as browser fallbacks
• DOM-based extraction for official WhoScored/Opta statistics when available
The pipeline extracts and processes match events, players, teams, formations, substitutions, dismissals, shots, passes, goals, assists, qualifiers, coordinates, and official match statistics.
Match and tactical analysis
The project generates around 40 individual analytical visualizations, including:
• Expected Goals (xG) analysis
• xG flow and match-momentum charts
• Home and away shot maps
• Shot-quality and finishing comparisons
• Goal and shot-type breakdowns
• Expected Threat (xT) maps
• xT generated per minute
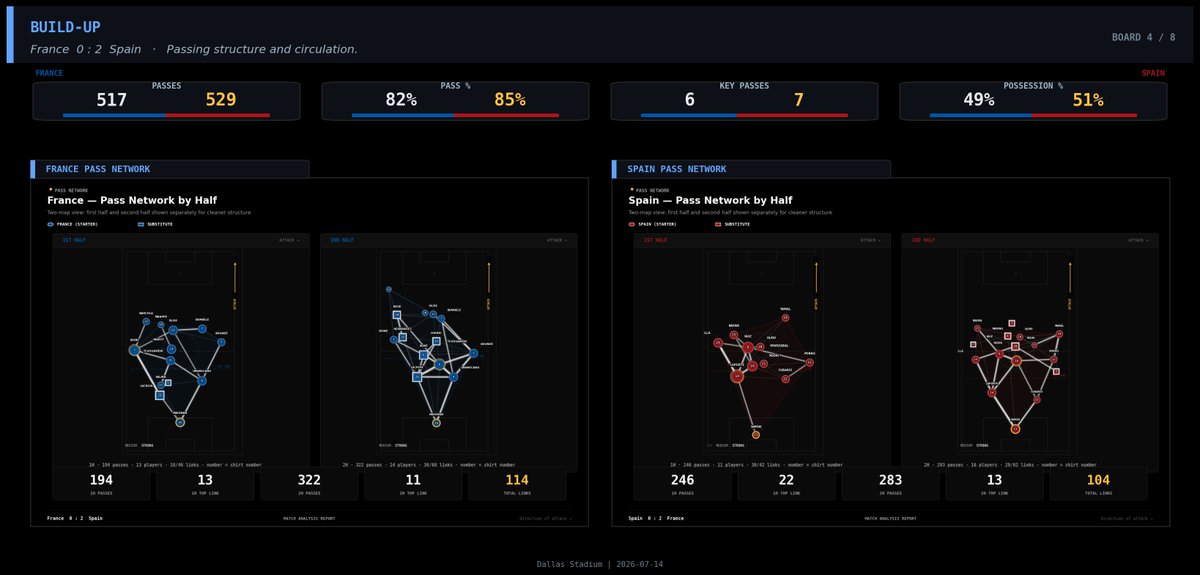
• Passing networks
• Progressive-pass maps
• Pass distribution by thirds
• Pass target zones
• Zone 14 analysis
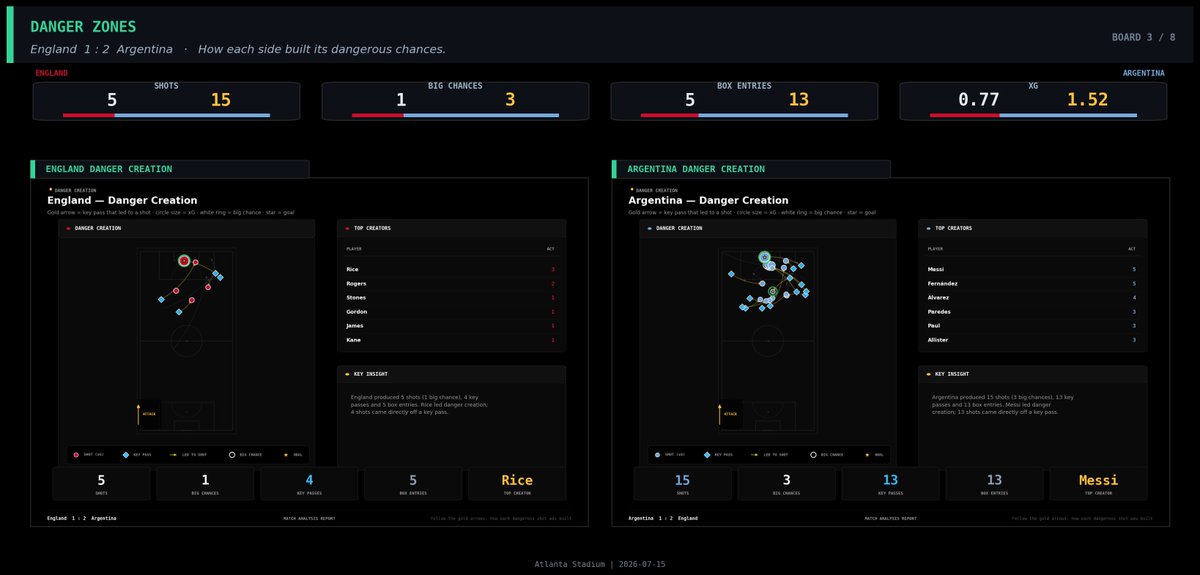
• Penalty-area entries
• Cross and wide-delivery analysis
• Average player positions
• Possession and territorial-control analysis
• Dominating-zone maps
• Defensive heatmaps
• Defensive-action summaries
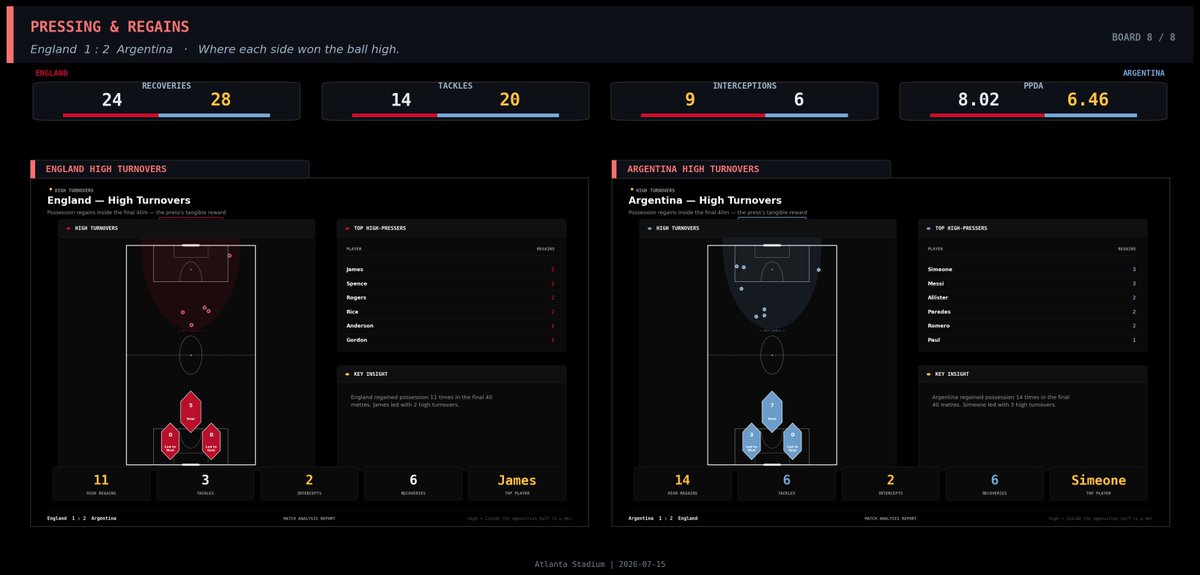
• High turnovers and pressing regains
• PPDA and pressing-intensity analysis
• Goalkeeper save analysis
• Match-stat comparison panels
Locally calculated advanced metrics
The project includes transparent, locally implemented analytical models rather than relying only on displayed totals.
These include:
• Expected Goals (xG)
• Expected Threat (xT)
• Expected Assists (xA)
• Post-shot expected-goal proxies
• Progressive passes and carries
• Shot-creating actions
• Key passes and big chances created
• Box touches and box entries
• Defensive actions and recoveries
• Ground, aerial, and total duels
• Passing accuracy and progression metrics
• Pressing intensity through PPDA
The xG and xT calculations are open approximations based on the available event data. They do not attempt to reproduce proprietary Opta or StatsBomb models.
Player radar profiles
The project generates an individual radar chart for every participating player.
Each radar groups performance metrics into areas such as:
• Attack
• Passing
• Expected threat and chance creation
• Defence
• Duels
• Ball progression
The chart compares each player with everyone who participated in the same match. It displays both percentile-based visual scaling and the player’s raw match values.
Player participation is reconstructed directly from the event stream using substitutions, dismissals, period endings, and player actions.
The playing-time system calculates the exact time each player spent on the pitch, including:
• First-half added time
• Second-half added time
• Both extra-time periods when played
• Substitutions accurate to the recorded second
• Red-card dismissal time
• Exclusion of penalty shootouts
For example, the radar can display 96′ 08″ played instead of simply limiting a full-match player to 90 minutes.
Reports and exports
For every match, the pipeline can produce:
• Approximately 40 standalone tactical images
• Eight grouped summary boards
• Individual player radar images organized by team
• A multi-page PDF match-analysis report
• Data-driven English tactical commentary
• Player, event, goal, and calculated-metric CSV files
• Individual report pages suitable for publishing
The PDF follows a structured analytical narrative, covering the match story, territorial control, chance creation, buildup, progression, defence, pressing, player performance, methodology, and the final tactical verdict.
Visual design
The project uses a unified visual-design system featuring:
• Team-specific colors
• Automatic kit-color selection
• Contrast and kit-clash protection
• Consistent typography and spacing
• Reusable visualization components
• Dark AMOLED-style presentation
• Publication-ready dashboards and report pages
Windows and memory optimization
Rendering dozens of high-resolution Matplotlib figures and combining them into one PDF can consume a significant amount of memory.
To make the project more stable on Windows, I implemented:
• Memory-safe image-resolution settings
• Progressive DPI fallback during memory pressure
• Explicit release of Matplotlib Agg renderer buffers
• Disk-backed PDF visual loading
• Lazy loading of report images
• Automatic closing of live figures before PDF generation
• Lower peak memory usage during summary-board creation
• Reliable PDF finalization without bad allocation failures
The project has been tested by generating all 40 visualizations, all eight summary boards, player radar profiles, and a complete 56-page PDF report in a single run.
Technology stack
The project is built with:
Python · pandas · NumPy · Matplotlib · SciPy · Rich · requests · cloudscraper · Beautiful Soup · Selenium · undetected-chromedriver · pypdf · PyMuPDF
The objective was not just to create attractive football charts. It was to build a complete and reusable workflow that converts raw match-event data into structured tactical insight—from data collection and metric calculation to visualization, player evaluation, and final reporting.
GitHub:
https://t.co/hxYVGav971
I would be happy to hear your feedback, technical suggestions, or ideas for future analytical features! ⚽
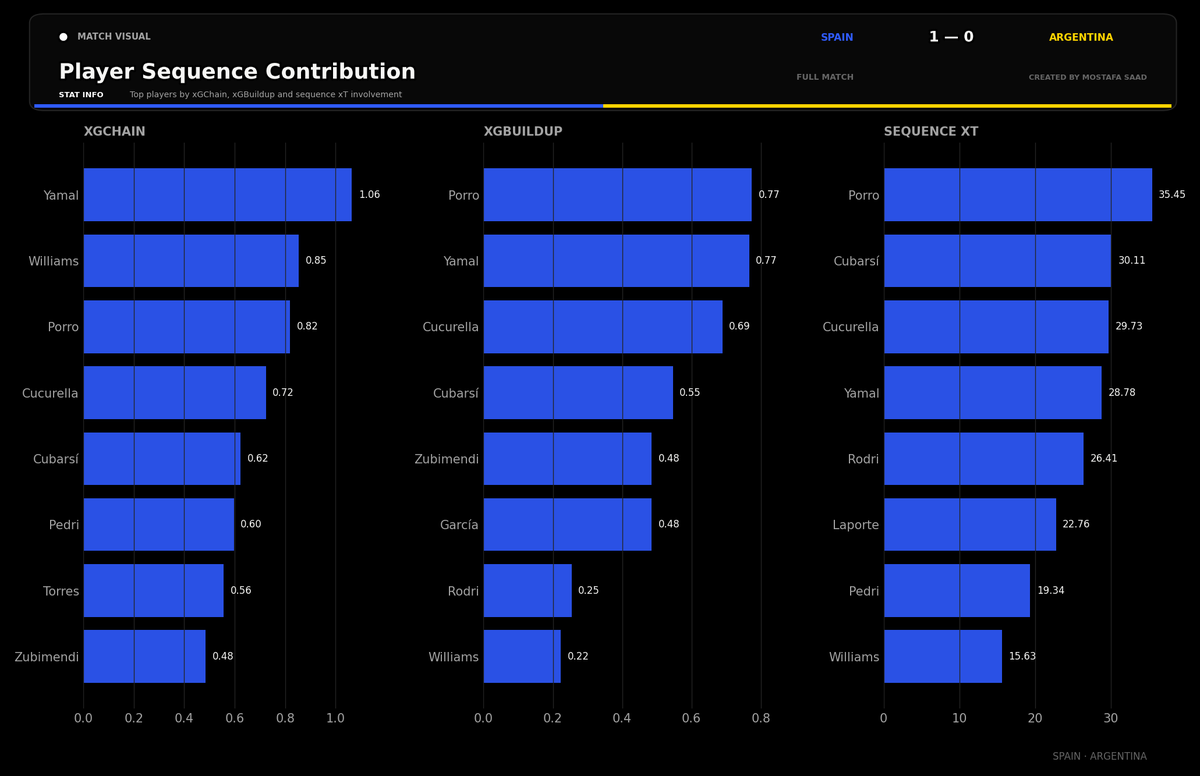
Spent a few minutes with Spain's Player Sequence Contribution chart from the Argentina game, and one thing jumps out before you even get to the individual numbers: every name on it is Spanish. Not most of them — all of them, across all three panels.
Quick context on what's actually being measured, because it matters here. xGChain credits a player for the total xG of every possession he touched, whether he played the final pass or just moved the ball through — it's a presence stat, not a finishing stat. xGBuildup strips out the key pass and the shot entirely, so what's left is pure circulation: who was actually moving the ball through the dangerous moments. Sequence xT swaps xG for pitch value — it's rewarding whoever advanced the ball into more threatening zones, sequence by sequence, regardless of whether a shot ever came off it.
Three different lenses on the same question — who was actually involved when Spain threatened — and Argentina answers "no one" on all three.
Individually the numbers read like you'd expect from a team that dominated the ball: Yamal tops xGChain at 1.06, Porro somehow leads both xGBuildup (0.77) and Sequence xT (35.45), which is notable in itself — a fullback outproducing the midfield on pure buildup value usually means the attack is running through a specific channel repeatedly, and here it's the right side. Cucurella and Cubarsí both sit inside the top four on every measure, which tells you the buildup wasn't just funneled through two or three creators — it had real width and layers to it. Even Rodri and Laporte, both centre-backs, land in the Sequence xT top six, meaning Spain's back line wasn't just launching attacks and disappearing, they stayed inside the sequences that actually generated threat.
But it's the Argentina blank that's the real headline. This isn't a "the data's incomplete" situation — a leaderboard cut like this pulls from anyone who touched the ball anywhere near a dangerous sequence. Zero Argentina players clearing that bar on three separate metrics isn't noise, it's a pattern: whatever buildup Argentina had, it never generated enough combined value for a single player's contribution to register alongside Spain's XI. That's a heavier verdict than 1-0 usually implies. The scoreline says a close game. This chart says Spain ran the sequences almost uncontested.
This goal is far more than just a clinical finish. It is a complete showcase of Declan Rice’s elite football intelligence, positional awareness, and his ability to execute a rapid defensive-to-offensive transition in a matter of seconds. 1. Reading the Play & Positioning (Pre-Action Phase)From the very first moment, Rice is not moving randomly. He demonstrates constant scanning and high-level game reading. He anticipates the opponent’s intended pass before it is played by observing body orientation and head movement. He positions himself intelligently to cover the passing lane while remaining in the “shadow of the ball.” This allows him to stay compact defensively yet spring into action instantly. His body shape remains open, giving him the flexibility to react in multiple directions. This is a masterclass in proactive positioning rather than reactive running. 2. The Interception (Ball-Winning Phase)The moment of winning possession is technically and tactically excellent:Angle of approach is perfect — he attacks the ball from the side rather than straight on, preventing the opponent from shielding it. Body shape is low, balanced, and strong, allowing him to win the ball cleanly with his nearest foot. The interception is decisive yet controlled, with no reckless diving or fouling. This reflects his ability to dominate duels in transition zones while maintaining composure. This clean recovery immediately flips the phase from defensive to attacking. 3. Transition & Ball Progression (The Most Impressive Phase)This is where Rice’s quality truly stands out:First touch is directional and purposeful. It doesn’t just control the ball — it takes him away from pressure and opens his body toward goal. He executes a quick half-turn / body rotation, instantly facing forward and scanning the pitch again. Instead of playing a safe sideways or backward pass, he makes a progressive decision to carry the ball himself into the central channel or half-space. This exploits the space created by the opponent’s disorganization after losing possession. His speed of decision-making under pressure is elite. While progressing with the ball, he continuously scans, identifies the lack of immediate pressure, and chooses the most direct route forward. This is the modern midfielder’s dream profile: winning the ball high up and immediately becoming a threat in transition. 4. The Finish (Execution Phase)Rice maintains perfect composure and balance right until the end. He doesn’t rush the shot. He selects the right technique based on the angle and situation — whether it’s power, placement, or a combination of both. The contact is clean, the body remains over the ball, and the finish is confident and accurate.Why This Goal Is Tactically SignificantRice exemplifies the hybrid modern midfielder:Elite ability to win the ball in advanced areas Immediate switch from defensive actions to progressive play High-quality decision-making in transition Technical composure to finish under pressure This is exactly why he is widely regarded as one of the top 3 midfielders in the world right now (if not the best in his profile). He influences every phase of the game within a few seconds — from reading the opponent’s intention to putting the ball in the net.
Arsenal’s centre-back shortlist is not a search for one universally “best” defender. Ezri Konsa, Maxence Lacroix and Jon Martín represent three very different recruitment strategies.
Konsa is the safest structural fit: Premier League-ready, secure in the first phase and capable of covering both RCB and RB. The question is whether his unusually low aerial-event profile would hold up with greater back-post responsibility.
Lacroix is the high-line specialist. His recovery power, aerial workload and ability to defend large spaces make him the strongest option if transition protection is the priority. Arsenal would still need to test his receiving, scanning and decision-making against an organised press.
Martín is the succession bet. At 20, he offers the most attractive age curve, strong aerial potential and a balanced progression profile. But the Premier League translation, recovery speed and immediate readiness remain unproven.
Using advanced data, tactical role modelling and Big Five league benchmarks, the report reaches a mandate-dependent conclusion:
• Best all-round senior option: Konsa
• Best high-line specialist: Lacroix
• Best long-term development option: Martín
Three defenders. Three different solutions. The right choice depends entirely on the job Arsenal want the signing to perform.
Full comparative scouting report b
https://t.co/btnf0EOsIR
Elijah Upson has signed his Arsenal contract. 18yo centre-back joins #AFC on a free transfer after the end of his contract with #THFC. Official announcement to follow in the coming days.
🟣INTRODUCING PLAYERPRINT
Every facet of a footballer. One app.
Top 5 Leagues | 23/24, 24/25, 25/26 | 4,396 players | 321 metrics
12 concepts on one player page:
Passing | Carrying | Shooting & Footedness | Aerial Duels | Hold-Up | Decision Making | Final Third | Half-Spaces | Tempo Control | Defending | Post-Recovery | Link-Up & Synergy
THE SCOUT. Build the player you're looking for.
Pick up to 10 metrics from any concept. Weight each 0-5 by how much you care. Get the top 50 ranked by Fit, with the percentile behind every column, so you see why he fits and not just that he does.
Nothing is pre-baked. Every percentile, rating and role is computed live against your pool: season, league, position, minimum 90s. Move the pool and the numbers move.
Maps you won't find anywhere else:
Angle Bias Index | Decision Bloom | half-space entries | injectors vs resets | post-carry take-ons | aerial duel quality | link-up synergy
Passes are comets. Carries are dotted. Every visual downloads at 300 DPI.
Link below!
Arsenal and Aston Villa are engaging in club to club talks for the transfer of Morgan Rogers. Senior members from both clubs are in direct contact. Personal terms are no issue.
Christos Tzolis should be evaluated first through his league profile, not through a mixed competition sample.
In the Belgian Pro League 2025/26, the numbers point to a very specific tactical idea: a left-sided winger who is not only producing output, but repeatedly arriving in the actions that end attacks.
17 goals.
23 assists.
3,072 minutes.
1.17 goal involvements per 90.
0.98 xG+xA per 90.
But the real Arsenal question is not just “does he produce?”
It is: what type of wide attacker is producing these numbers, and does that profile solve a real tactical need for Arteta?
That is where the thread starts.
Μια ανάσα από τη συμφωνία Άρσεναλ κ Μπριζ για την αγορά του Τζόλη.
Στα 40Μ το deal, ποσό ρεκόρ (net) στην ιστορία για Έλληνα ποδοσφαιριστή.
Συμφωνία Άρσεναλ - Τζόλη, ακόμη, δεν υπάρχει.
https://t.co/Ne6ko9UOYx
Sometimes a player’s importance becomes clearest only after he leaves the pitch.
That was the case with Declan Rice against Argentina.
Gordon scored England’s goal, but Rice was my pick for their best all-round performer. He was the player holding together the different parts of a team that spent most of the match under pressure: protecting the defence, helping England escape after recoveries and supplying some of their limited creativity.
England had only 36% possession, so Rice was never going to produce huge passing numbers. What mattered was how he used the ball when England finally recovered it.
He completed 24 of his 29 passes at an 83% rate, made three passes into the final third and delivered two key passes—half of England’s total. He also registered two shot-creating actions, two deep completions and completed two dribbles.
Those are not the numbers of a midfielder who was only sitting in front of the centre-backs. Rice was one of the few England players capable of turning a defensive recovery into the beginning of an attack.
Without the ball, he made two interceptions, three recoveries, three clearances and one block. Argentina were repeatedly playing around England’s defensive third, so Rice’s job was not simply to chase the ball. He had to protect the inside channels, read the next pass and then make himself available when possession changed.
His performance was not perfect. He won only two of his six ground duels and did not complete a successful tackle. But his influence was built more on anticipation and positioning than physical dominance.
England were already struggling to connect their midfield with Kane. When they regained possession, the first pass was often played toward an isolated forward or winger. Rice was one of the few players who could secure that first action, carry through the pressure or find a progressive option.
Then came the decisive sequence.
Fernández equalised in the 84th minute. Rice was withdrawn in the 85th. Martínez scored Argentina’s winner in the 91st.
England did not lose simply because Rice went off. Argentina had already established control through their possession, territory and pressure, and the equaliser had arrived before the substitution.
But the change removed an important stabiliser at the exact moment England needed to regain their balance.
After conceding, England needed someone who could compete for the next loose ball, protect the space ahead of the defence and help the team keep possession long enough to move away from Pickford’s goal.
Rice had been doing all three.
Without him, England became even more dependent on clearances and isolated direct passes. Argentina could recover the ball, rebuild the attack and keep England’s defensive line close to its own penalty area.
The substitution was not the only reason for the defeat, but it made England less equipped to survive the most unstable period of the match.
Gordon gave England their best moment.
Rice provided much of the structure that allowed them to protect it.
Once he left, England lost one of the few players still capable of connecting their defensive work to an attacking exit.
Día de semifinal del mundial y vamos a hablar del xT (Expected Threat), otra de las métricas más interesantes del mundo del fútbol. ⚽
Si te fijas en las estadísticas de televisión de la semifinal de hoy, verás datos del tipo porcentaje de posesión, pases completados o kms recorridos.
Datos estáticos incapaces de explicar lo que ocurre realmente en el campo.
El fútbol, como ya sabéis, es un juego dinámico de transición espacial.
Un pase de seguridad de 5 metros entre tus centrales vale cero, pero un pase filtrado de 5 metros que rompe la línea del centro de campo rival vale oro.
Ambos cuentan como un pase completado en la estadística típica.
Para solucionar esta ceguera, la analítica moderna usa el xT.
El Expected Threat es una métrica basada puramente en Cadenas de Márkov y teoría de decisión dinámica.
¿Cómo funciona la lógica de este modelo?
1) La cuadrícula de estados
El modelo divide el campo de juego en una cuadrícula (típicamente de 12 columnas por 8 filas, generando 96 celdas).
Cada una de estas celdas se trata como un "estado" dentro de un proceso de transición.
Históricamente, cada celda del campo tiene una probabilidad base de terminar en gol en las próximas jugadas.
Si tienes el balón en tu propia área, tu probabilidad de gol es cercana a cero.
Pero si lo tienes en la frontal del área rival, tu probabilidad es mucho más alta.
2) La decisión: mover o tirar
Cuando un jugador recibe el balón en una celda, tiene que tomar una decisión que el modelo evalúa constantemente:
a) Puede tirar a puerta (y ahí entra la probabilidad de que el tiro sea gol).
O b) puede mover el balón (ya sea dando un pase o conduciendo él mismo).
Si decide mover el balón, el modelo calcula a qué nueva celda lo envía y qué probabilidad tiene esa nueva zona de acabar en gol, ponderando el riesgo de perder la posesión por el camino.
3) El cálculo de la ganancia de amenaza
Aquí es donde se mide el valor añadido del jugador.
Cuando un futbolista recibe el balón en la zona A y lo mueve con éxito a la zona B, el sistema resta la probabilidad de la zona inicial a la de la zona de destino.
Si mueves el balón de una zona de baja probabilidad a una de alta probabilidad, inyectas una ganancia de amenaza neta al equipo.
Pero si das un pase hacia atrás que reduce la probabilidad de gol, inyectas una pérdida de amenaza.
Al sumar todo el progreso acumulado de un jugador a lo largo de un partido, obtienes una métrica limpia que cuantifica la amenaza de gol real que un jugador es capaz de fabricar para su equipo con sus decisiones de pase y regate.
¿Para qué se usa en el fútbol real?
Para encontrar a los "arquitectos silenciosos" del juego.
Los directores deportivos de los clubes de primer nivel no buscan jugadores mirando solo la tabla de goleadores.
Buscan al centrocampista que sistemáticamente lidera la ganancia de amenaza por cada 90 minutos.
El jugador que es capaz de acelerar la transición del equipo de zonas seguras a zonas letales de forma constante.
El fútbol no es un juego de fotos fijas, sino de transición de estados y gestión de la incertidumbre en el espacio (como los mercados).
El gráfico muestra cómo el modelo divide el campo y cómo mover el balón del centro a la frontal (vector negro) inyecta un progreso de amenaza neto positivo.
El pase de hoy no se mide por la precisión, sino por la amenaza que inyecta.
Por supuesto, está métrica es una más de tantas, y aislada nos da un foto incompleta.
Pases hacia atrás que descongestionan al equipo o que generan huecos que después van a ser aprovechados son invisibles al xT.
**England 1–2 Argentina — Tactical & Data Analysis, Part II**
England’s defensive problem was not that they never recovered the ball.
It was that they could not keep it long enough to move the match away from their own goal.
England recorded 11 high regains, only three fewer than Argentina. None produced a shot. Argentina turned three of theirs into attempts.
That difference connects the progression, territory, defensive and pressing data.
## Argentina progressed through several lines
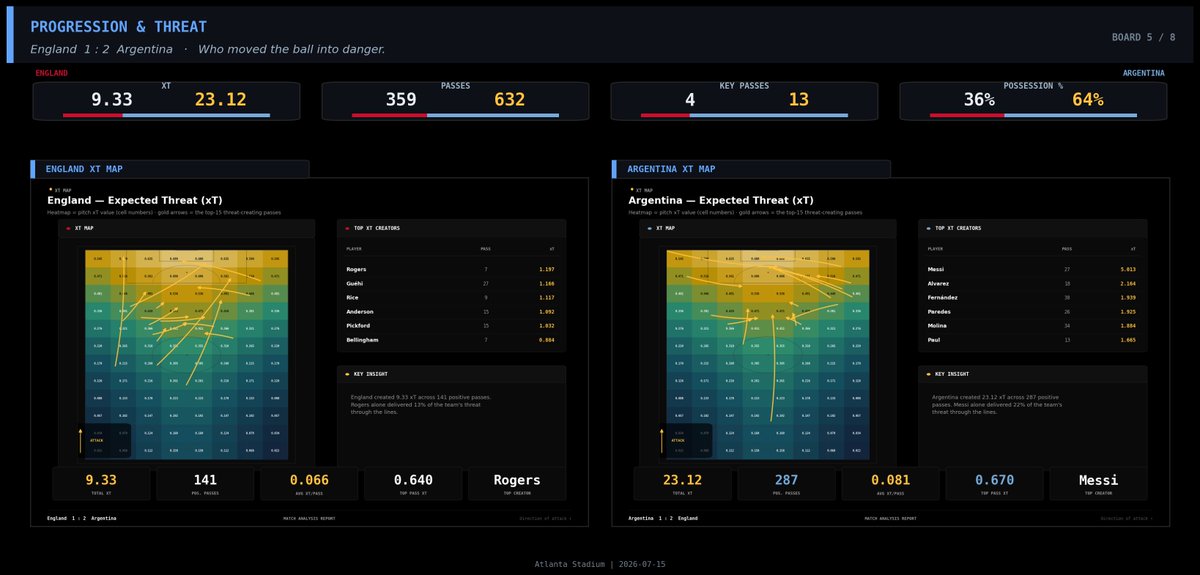
Argentina generated 23.12 Expected Threat, compared with England’s 9.33. They completed 287 positive-value passes—more than twice England’s total—and also produced more xT per progressive action.
This was not the result of one repeated route.
Paredes could progress from the base of midfield. Fernández and De Paul carried the possession into higher zones, Molina advanced from the outside, and Álvarez provided an option beyond England’s midfield.
Messi was the central figure. His passing alone generated 5.01 xT, more than half England’s team total and approximately 22% of Argentina’s threat.
His value came from where he connected the phases of possession. He could move away from the forwards, receive behind England’s midfield pressure and then find the next runner before the defensive line had time to adjust.
England could not treat him as a fixed attacker. Following him created space elsewhere; allowing him to receive gave Argentina control of the next pass.
## England’s progression started too far from Argentina’s goal
England’s leading xT creators included Rogers, Guéhi, Rice, Anderson and Pickford.
That profile is revealing.
Rogers gave England an outlet between or outside Argentina’s lines, but much of the remaining threat came from defenders, a deep midfielder and the goalkeeper. England were often trying to transform a defensive recovery into an attack with the first forward pass.
There is nothing inherently wrong with progressing directly. Against an aggressive press, a well-timed pass into space can remove several opponents at once.
The problem was the lack of support around the receiver.
If Gordon or Rogers controlled the first pass, Kane was often isolated centrally and the midfield still had a large distance to cover. If Argentina won the first duel or collected the second ball, England’s attack ended before the team could move forward as a unit.
England’s progressive actions were therefore more isolated. Argentina’s were usually followed by another nearby connection.
One team was using progression to continue possession. The other was using it to escape pressure.
## Argentina controlled every third of the pitch
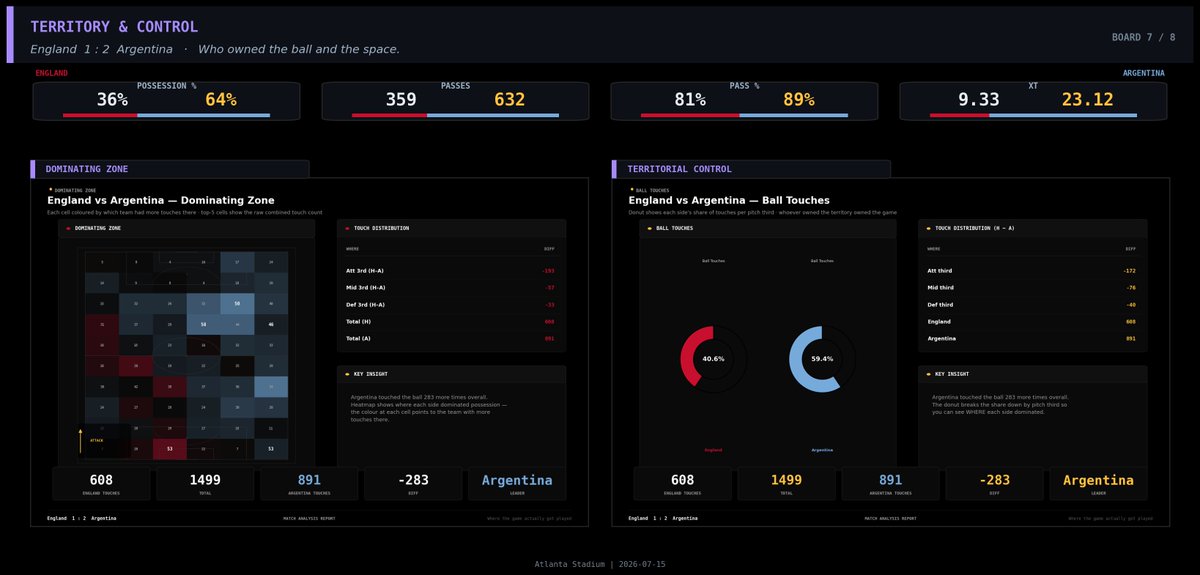
The territorial map is even more decisive than the possession percentage.
Argentina recorded 891 touches to England’s 608—a difference of 283—and held the greater share of activity in the defensive, middle and attacking thirds.
This was not possession concentrated safely around their own centre-backs. Argentina moved the match into England’s half and kept it there for extended periods.
Their midfield positioning allowed them to collect clearances and second balls underneath the attack. The centre-backs could remain high enough to restart possession, while the full-backs protected the width required to prevent England from escaping easily.
After Gordon’s goal, that territorial control intensified. England’s defensive line moved deeper, the distance to Kane increased and the wide outlets had further to travel before they could support a counterattack.
England were protecting the penalty area, but each clearance often began another Argentine possession.
That is how a team can survive individual attacks while gradually losing control of the match itself.
## England’s defensive structure nearly survived
The final result should not erase the work England did without the ball.
They completed 127 defensive actions, including 31 clearances, nine interceptions and three blocks. Argentina did not create a clear chance from every spell of possession; several of their shots came from low-value locations.
Anderson led England with 21 defensive actions, followed by Bellingham, Spence, Stones and Guéhi. That distribution shows how much work was required from the midfield and defensive lines.
England protected the centre, defended deliveries and competed well in the air. For long periods, they forced Argentina to recycle possession or attempt shots from outside the best scoring areas.
That is why the equaliser came from a 0.03 xG shot rather than a clear opening. Fernández produced an exceptional outcome from a difficult situation.
The defensive plan was close to working. The issue was its sustainability.
England could complete one defensive action but rarely control the phase that followed it. The midfield cleared the box, Argentina recovered outside it, and England had to organise again without enjoying a meaningful spell on the ball.
Defending the next attack became more difficult because the team had never escaped the previous one.
## Argentina defended proactively despite dominating possession
Argentina actually completed slightly more defensive actions than England: 133 to 127. They also made 20 tackles and 28 recoveries.
For a side with 64% possession, that is significant. It suggests their defending was not restricted to protecting their own penalty area. Much of it occurred while trying to keep England inside the pressure.
Romero led the match with 24 defensive actions. His role was important whenever England attempted to play directly: step toward the receiver, contest the first ball or collect the loose possession before Kane and the wide players could connect.
Simeone recorded 16 actions from a much higher role, while Paredes, Fernández, Tagliafico and González contributed across different zones.
Argentina’s defensive work was spread from the first line to the centre-backs. The press slowed England’s exit, the midfield attacked the second ball and the defenders protected the space behind them.
Their 31 clearances also show that England’s direct attacks and deliveries did require defending. Argentina were not immune to pressure. They were simply better at ensuring that those defensive moments did not develop into sustained English possession.
## The pressing data explains why England could not escape
Argentina’s PPDA was 6.46, compared with England’s 8.02. The lower figure shows that Argentina allowed fewer passes before attempting a defensive action.
More importantly, their leading high regainers were attacking players.
Simeone and Messi each recorded three high turnovers. Mac Allister, Paredes and Romero also contributed.
That tells us the first line was not pressing alone. When one Argentine player approached the ball, the midfield and defensive line moved behind him. The receiver might escape the initial challenge only to meet the next defender immediately.
Argentina recovered possession 14 times inside the attacking 40 metres. Six of those regains came through tackles, demonstrating how often they arrived close enough to challenge the receiver rather than merely waiting for an inaccurate pass.
Three high regains became shots.
England also recovered possession high 11 times. James, Spence, Rogers and Rice were all involved, but none of those situations produced an attempt.
Their regains were more likely to happen around the outside lanes and were not supported by enough immediate attacking options. England could win the ball, but the next pass often went backward or toward an isolated forward.
The two teams were not separated only by how often they regained possession. They were separated by the structure available after the regain.
Argentina’s recovery became another attack.
England’s recovery often became another attempt to escape.
## The comeback contained variance, but the pressure was structural
Argentina’s equaliser was a low-probability finish. England were only a few minutes away from surviving the pressure and reaching the final despite the territorial imbalance.
The result was not inevitable.
The conditions that produced the comeback, however, were not accidental.
Argentina controlled possession, generated more than twice England’s xT, occupied every third more heavily, pressed with greater aggression and repeatedly recovered the ball before England could connect their exits.
England’s defensive block delayed the breakthrough, but it could not change the geography of the match. Once Fernández equalised, England had no stable possession structure to slow Argentina down or move play toward the opposite end.
The winner then came from the type of opportunity Argentina had spent the match trying to create: Martínez receiving a clear central chance worth 0.56 xG.
England defended the lead for 30 minutes.
Argentina controlled the process that kept bringing the ball back.
That is why the comeback felt late on the scoreboard but logical in the data.
England 1–2 Argentina — Tactical & Data Analysis, Part I
England’s goal changed the score. It did not change the direction of the match.
Gordon put England ahead in the 54th minute with their only genuinely clear opportunity. From there, the question was whether England could use the lead to gain control, escape Argentina’s pressure and force the game away from their own defensive third.
They could not.
Argentina’s two late goals made the comeback dramatic, but the underlying performance had been building toward it for much longer.
Argentina controlled possession through structure
Argentina finished with 64% possession, 632 attempted passes and 89% passing accuracy. Those numbers describe a clear advantage on the ball, but the pass network explains why that advantage existed.
Their build-up had several connected layers. The centre-backs provided the base, Paredes offered a route through the first line, and Fernández, Mac Allister and De Paul operated at different heights around him. Messi could move away from the last line to receive between England’s midfielders, while Álvarez threatened the space ahead of the ball.
That spacing gave Argentina more than one answer whenever England pressed.
If an English forward jumped toward a centre-back, Argentina could find the pivot or recycle through the opposite defender. If Rice or the next midfielder stepped forward, space opened behind him for Messi or another interior player.
England’s press was active, but Argentina’s support angles made it difficult to lock the possession onto one side. Their 89% completion rate was not produced by empty passing between the defenders; they also completed 13 key passes and repeatedly moved the ball into the penalty area.
Argentina were keeping the ball and progressing with it.
England’s network contained too few connections into the attack
England’s possession structure looked much less connected.
Rice and Anderson supported the defensive line, James and Spence provided the outside routes, and Gordon and Rogers started from higher positions around Kane.
The problem was the space between those groups.
Kane was not consistently connected to the deeper circulation, while Gordon and Rogers often received after England had already been pushed toward the touchline. England could play away from the first pressure, but the next forward pass was much harder to find.
Their most realistic attacking route was direct: recover the ball, release one of the wide players early and attack before Argentina restored their shape.
Gordon’s goal came from England’s best attacking moment and was worth 0.59 xG. It was a well-created, high-quality chance—but it also accounted for most of England’s total 0.77 xG.
England had found a decisive moment. They had not established a repeatable attacking pattern.
The second-half networks show what happened after the goal
Argentina completed 275 passes in the first half and increased that figure to 357 after the break.
England moved in the opposite direction: from 196 first-half passes to 159 in the second. Their strongest passing relationship also fell from 14 combinations to nine.
That matters because England were not simply defending with less possession; they were losing the connections required to leave their defensive shape after regaining the ball.
The network became deeper and more fragmented. Kane remained separated from the first pass, the wide outlets were difficult to find, and Argentina could quickly recover possession around England’s attempted exits.
Argentina’s second-half network became larger, higher and more interconnected. The centre-backs operated closer to the halfway line, the midfield collected second balls underneath the attack and Messi continued appearing in the spaces around England’s midfield block.
England protected the area in front of goal, but they struggled to move the match away from it.
Argentina created pressure through repetition and variety
The difference in chance creation was not simply 15 shots against five.
Argentina entered the box 13 times, supplied 13 key passes and created three big chances. England recorded five box entries, four key passes and one big chance.
Argentina’s creative work was also distributed across several players.
Messi and Fernández led the danger-creation actions, with Álvarez, Paredes, De Paul and Mac Allister all contributing. That distribution shows an attack capable of finding the final pass from different positions.
Messi did not need to be the player taking every shot. His movement could draw a midfielder, connect the central combinations or release the next player toward the box. Fernández could progress from deeper areas, while Álvarez occupied the centre-backs and attacked the spaces created around them.
England’s creation was far more limited. Rice led their danger actions, with Rogers providing the next-highest contribution. That suggests much of England’s attacking play began from deeper recoveries or early forward passes rather than sustained possession around Argentina’s box.
Once the first attacking route was stopped, England had few alternative ways to continue the move.
The shot map shows both Argentina’s strength and their imperfection
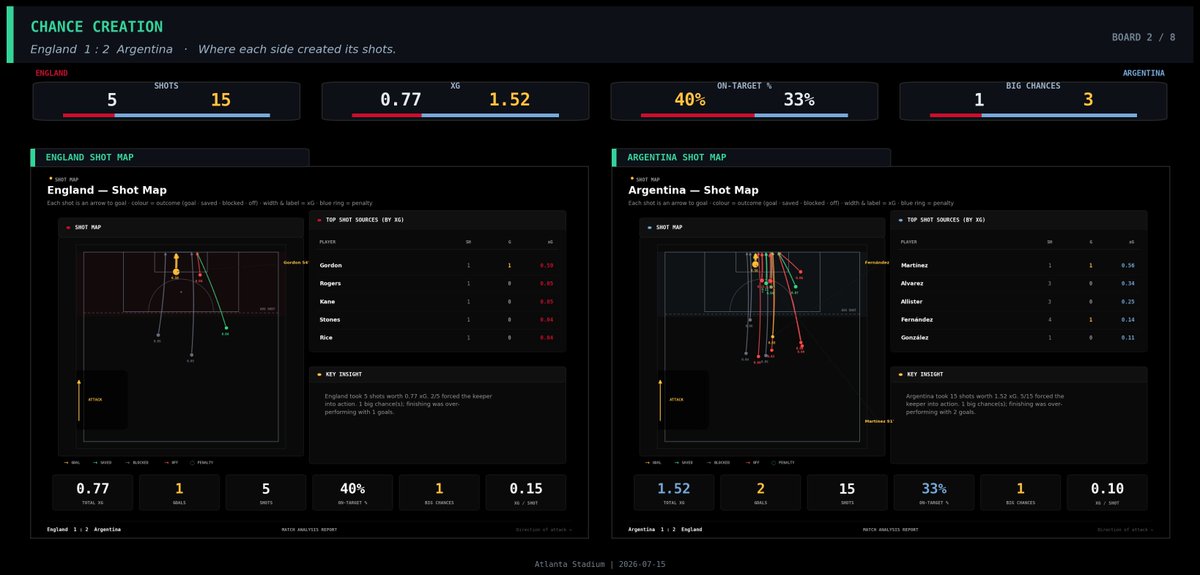
Argentina’s 15 shots produced 1.52 xG. England’s five generated 0.77.
The difference was clear, but Argentina were not flawless in their shot selection. Several attempts came from low-probability positions, and Fernández’s four shots were worth only 0.14 xG in total.
His equaliser in the 84th minute was valued at just 0.03 xG. It was an exceptional outcome from a difficult attempt rather than the clearest chance Argentina created.
That detail matters. Argentina’s overall performance deserved an equaliser, but the particular shot that produced it was unlikely to become a goal.
The winner was different.
Martínez’s 91st-minute goal came from a 0.56 xG opportunity—the kind of central, high-value chance Argentina’s sustained pressure had been trying to produce. After generating volume through crosses, combinations and second balls, they finally opened England enough to create a decisive finish.
England’s five-shot profile was almost entirely dependent on Gordon’s goal. Their other four attempts combined for only 0.18 xG.
Once Argentina equalised, England had no established attacking structure to help them regain control or create another clear opportunity.
One team produced a moment; the other produced a mechanism
England’s plan came close to surviving. They defended the central areas for long periods, competed well in the air and converted their best transition into the opening goal.
But the goal left them protecting a lead without enough possession or attacking connectivity to change the rhythm.
Argentina controlled the ball through a more connected build-up, pushed their network higher after half-time and created danger through several players rather than one route. Their equaliser required an unlikely finish, but the late pressure that surrounded it was not accidental.
England produced the first decisive moment.
Argentina produced the structure that kept generating the next one.
🇳🇴Captain Ø - WC 2026
Looks healthy and back to his best. It's noticeable when he's on form, because you'll see him baiting and playing with his prey. His decision making is 2/10 sec faster and it makes such a big difference in his press restistance.
The most interesting analytical paradox in this match is that France generated more Expected Threat than Spain, yet Spain created far better chances and won 2–0.
That apparent contradiction explains the game better than the possession numbers.
Expected Threat measures how much value a pass or carry adds by moving the ball into a more dangerous zone. It does not guarantee that the receiving player will be facing forward, that the defence has been disorganised, or that the possession will end with a good shot.
France moved the ball into threatening territory. Spain created the conditions required to exploit it.
France accumulated 12.27 xT from their positive passes, compared with Spain’s 8.95. But that territorial advantage produced only 0.48 xG, while Spain converted their lower progression volume into 1.67 xG.
In performance-analysis terms, France progressed effectively between zones but inefficiently between phases. Their build-up could become progression, but their progression rarely became controlled chance creation.
Dembélé was France’s leading xT creator, followed by Olise, Koundé, Lacroix, Barcola and Doué. That distribution is significant. Much of France’s threat was generated by wide attackers, full-backs and defenders moving the ball forward rather than by central midfielders breaking Spain’s structure from inside.
France’s most valuable passes often carried the ball from a low-value area into a higher-value wide or advanced zone. The model correctly rewards that movement, but the tactical context after the pass was less favourable.
The receiver was frequently close to the touchline, with Spain’s block already shifting toward him. There was limited support underneath, no consistent central runner occupying the next defender and insufficient presence between the penalty spot and the edge of the six-yard box.
France therefore reached dangerous coordinates without necessarily creating dangerous situations.
Dembélé could advance the attack, but he was often asked to perform several actions within the same possession: receive, eliminate his direct opponent, protect the ball from the covering defender and then deliver the final pass. Spain’s structure distributed those responsibilities among several players. France concentrated them in the individual action of the winger.
Olise faced a similar problem between the lines. When he received centrally, Spain’s midfield could collapse around him because France did not consistently pin the defenders on both sides of the ball. When he moved wider to find space, he became easier to contain against the touchline.
Koundé’s position among France’s leading threat creators also illustrates the same pattern. France could progress down the right through the full-back, but progression through the full-back is not automatically penetration. Spain were often prepared to concede that outside pass because it moved the ball away from the centre and gave their defensive block time to slide across.
Spain’s xT profile looked completely different.
Simón, Ruiz, Laporte and Rodri were among their leading threat creators. Simón appearing at the top should not be interpreted as the goalkeeper being Spain’s main playmaker in the traditional sense. It shows that Spain generated significant territorial value from the beginning of their possessions.
Their deeper players identified when France had pushed forward, then used passes that bypassed several opponents at once. Instead of progressing through a long chain of marginally valuable actions, Spain could move directly from the first phase into an advanced receiving position.
Simón’s distribution helped Spain escape the first pressure. Laporte could break the initial line from the left side of the defence. Rodri and Ruiz provided the angles to receive, turn or redirect the ball, while the advanced players maintained the width and depth needed to stretch France’s second line.
That is an important difference between progression and controlled progression.
France frequently advanced because an individual player carried the ball or completed a difficult pass. Spain advanced because their positional structure had already created the next free player.
For Spain, the pass was often the final consequence of the movement. For France, the movement frequently began only after the pass had arrived.
The territorial map adds another layer to the analysis.
Spain finished with only a small overall advantage in touches, so this was not territorial domination in the conventional sense. France were able to establish possession in advanced areas, especially after falling behind, while Spain had a stronger presence through the central and middle zones from which possession could be controlled.
This distinction matters because occupying the attacking third and controlling the route into it are not the same thing.
France had more of the ball in some advanced areas because Spain were willing to defend those spaces after taking the lead. Spain protected the centre, maintained compact distances and directed France toward the wings. France could accumulate touches outside the block without forcing Spain to abandon its preferred defensive shape.
Spain controlled the access points. France occupied some of the territory beyond them.
The scoreline also changed the meaning of every touch. At 0–1 and then 0–2, France had to keep more players in advanced positions and recycle possession around Spain’s defensive block. Spain no longer needed to compete for every harmless pass. They could prioritise protecting the penalty area, the central lane and the space behind their midfield.
Consequently, France’s advanced territorial presence grew as their control over the match declined.
This is why territorial data must always be interpreted alongside game state. A team chasing the result can have more touches near the opposition’s box without becoming the tactically dominant side. The opponent may be deliberately trading low-value territory for control of high-value space.
Spain’s defensive heatmap supports that interpretation.
They completed more defensive actions than France, with particularly high involvement from Rodri, Ruiz, Laporte, Baena, Porro and Cucurella. Crucially, those actions were distributed across different lines and different areas of the pitch.
Rodri and Ruiz protected the space in front of the defence. Baena contributed from the attacking line. Porro and Cucurella defended the wide channels, while Laporte dealt with the final action closer to the box.
That distribution is the signature of a layered defensive system. The first player delayed the attack, the second closed the inside option and the last line defended the cross or final pass.
Spain’s 25 clearances should not automatically be read as evidence that they were under uncontrolled pressure. In context, many were the predictable final action of France being forced outside. Spain accepted deliveries into an organised penalty area because their centre-backs were set, their midfielders had recovered and France rarely had a numerical or positional advantage inside the box.
Spain were defending volume rather than emergency.
France’s defensive activity was more concentrated around Rabiot and Upamecano. Rabiot led the team by a considerable margin, while Upamecano was the most active defender behind him. This suggests that France relied heavily on individual players to repair situations once Spain had progressed.
Rabiot was required to cover lateral spaces, support the press and recover toward his own penalty area. Upamecano then had to step forward or defend the depth when that midfield pressure was bypassed.
France’s defensive actions often looked like responses to Spain’s progression. Spain’s actions looked like components of a predefined defensive plan.
The pressing data makes the contrast even clearer.
The PPDA values were relatively close, with Spain pressing slightly more aggressively. Both teams also recorded the same total number of recoveries. On the surface, that could suggest two equally effective pressing performances.
But pressing effectiveness is not measured only by how frequently possession is recovered. It is measured by where the ball is won, what the team can do immediately afterwards and whether the structure remains protected if the press is broken.
Spain produced more high regains and, more importantly, turned two of those situations into shots. France’s high recoveries did not produce a shot.
That is the difference between winning the ball and winning the next action.
Spain’s leading high regainers were Pedri, Olmo and Ruiz. This indicates that the press was functioning through the midfield and attacking midfield lines rather than depending only on the centre-forward chasing the centre-backs.
The first Spanish player guided the pass. The next player anticipated it. The surrounding players closed the escape routes. When possession was recovered, Spain already had several players positioned close enough to combine before France could restore their defensive shape.
Their press and their attack were therefore part of the same mechanism.
France’s high regains were led by Rabiot, with contributions from Olise, Koundé, Tchouaméni and others. France could force turnovers, but the recoveries were more scattered across different roles. The player winning the ball did not always have an immediate forward option, and the attacking line was not consistently positioned to exploit the moment of disorganisation.
France often recovered possession and then restarted the attack.
Spain recovered possession and continued the attack.
Spain’s seven tackles among their high regains, compared with France’s three, also points toward a more confrontational pressing style. They were not simply waiting to intercept an inaccurate pass; they were arriving close enough to challenge the receiver as the ball reached him.
France recorded more high interceptions, which suggests that their pressure had moments of good anticipation. But interceptions alone did not create the same attacking reward because the distances between the ball-winner and the next receiving options were less favourable.
This match therefore demonstrates four important analytical distinctions:
Progression is not penetration.
Territory is not control.
A recovery is not automatically an effective press.
And defensive volume is not automatically defensive weakness.
France led the Expected Threat numbers because they moved the ball into valuable areas repeatedly. But the low quality of their shots shows that Spain controlled what happened after those entries.
Spain’s deeper players broke pressure, their midfield protected the centre, their press created immediate attacking opportunities and their defensive block guided France toward low-value endings.
France generated more theoretical danger.
Spain controlled the chain that turns danger into goals.
That is why the performance can appear balanced through possession, passes, territory and recoveries, while still producing a tactically convincing 2–0 victory for Spain.
France 0–2 Spain — Tactical & Data Analysis, Part I
Spain’s victory was not built on overwhelming possession or a dramatically higher number of attacks. It was built on something more important: a superior relationship between possession structure, the location of the final pass and the quality of the resulting shot.
The headline numbers make the match appear balanced. Possession was split 51–49, both teams attempted ten shots and France actually entered the penalty area more frequently.
But the game was not tactically balanced.
France reached Spain’s box more often. Spain reached the situations from which goals are actually scored.
## The opening phase: Spain established the terms of the match
The xG flow shows that Spain’s most productive early spell came between the 12th and 22nd minutes. That period culminated in Oyarzabal’s opener, a chance worth approximately 0.79 xG.
This was not a speculative finish or an isolated shot from distance. It was the consequence of Spain repeatedly moving France’s defensive block until a central opening appeared.
Oyarzabal’s movement was essential. He did not remain permanently fixed between the centre-backs. He moved toward the midfield, offered himself between the lines and forced France’s defenders to decide whether to follow him.
If a centre-back stepped forward, Spain could attack the depth behind him. If the defender remained in the last line, Oyarzabal could receive and connect with the players arriving around him.
His goal rewarded Spain’s strongest early spell, but it also changed the tactical direction of the match. France could no longer wait for transition opportunities. They had to become more proactive in possession, which gradually moved the game toward Spain’s preferred scenario: France circulating against an organised block while leaving more space behind their own attacking structure.
Porro’s second goal in the 57th minute reinforced that advantage. From that moment, France’s possession volume increased, but Spain had even less reason to contest every pass. They could protect the centre, allow safer circulation outside the block and concentrate on controlling the final action.
## France’s possession shape: a platform disconnected from its forwards
France’s first-half pass network often resembled a 4-2-4 structure in possession.
The centre-backs circulated underneath Tchouaméni and Rabiot, the full-backs provided the outside routes, and Mbappé, Dembélé, Olise and Barcola occupied a high attacking line.
On paper, that gave France width, speed and several players capable of receiving between the lines. In practice, the distances between the deeper platform and the attacking line were too large.
France had players in advanced positions, but not enough connections into them.
Tchouaméni and Rabiot could support the first phase, yet neither was consistently able to receive beyond Spain’s pressure and immediately connect with a forward-facing attacker. France’s centre-backs could move the ball around the first line, but playing around Spain was easier than playing through them.
The ball was consequently directed toward Digne and Koundé or played early into one of the wide attackers. Spain were comfortable with that route because it made the next action predictable.
Once the ball travelled outside, the Spanish winger could press from the outside, the nearest midfielder protected the inside lane and the full-back confronted the receiver. The touchline reduced the space available to France and removed one direction of escape.
Mbappé and Dembélé were therefore receiving the ball, but not in the conditions France wanted to create for them.
Instead of collecting possession while facing a retreating defender, they often received with Spain’s block already shifted across. The direct opponent could delay them, a midfielder could close the inside route and another defender could protect the space behind.
There is a difference between passing to an attacker and activating him.
France did the first far more often than the second.
## Spain’s network created the free player before the pass
Spain’s first-half structure was more compact and contained stronger, more repeatable passing relationships.
Their centre-backs provided a stable starting point, the midfielders remained within supporting distance and the advanced players occupied different vertical lines. That allowed Spain to circulate possession without placing several players on the same horizontal line.
The structure always attempted to provide the ball-carrier with three types of option:
- A safe pass behind or alongside the ball.
- A progressive pass into the midfield.
- A higher option capable of pinning or displacing the defensive line.
On the right, Yamal’s high position stretched France’s left side, while Porro provided a deeper supporting route. The nearest midfielder could then occupy the inside channel.
That relationship gave Spain width, depth and an interior connection on the same side.
If France’s winger pressed Porro, the inside pass could open. If the midfielder moved outward to close that route, space appeared centrally. If the full-back stepped toward Yamal, Spain could attack the gap behind him.
Spain’s circulation was not designed merely to retain possession. It was designed to create a decision for France and then exploit the space produced by that decision.
The same principle appeared on the opposite side. Baena and the left-sided outlet did not simply occupy the same lane. One could provide width while the other moved into the half-space, allowing Ruiz or another midfielder to connect the two.
Spain’s first-half passing volume and stronger main combinations reflected that structural clarity. Their players knew where the next support would appear before receiving the ball.
For France, the pass frequently determined the next movement.
For Spain, the movement determined the next pass.
## Why France’s second-half passing volume was misleading
France’s network became much denser after half-time. They completed considerably more passes in the second period and involved substitutes such as Doué and other attacking players more frequently.
That increased activity should not automatically be described as control.
France were chasing the result, while Spain were protecting it.
Spain could retreat slightly, narrow the distances between midfield and defence, and allow France to circulate in areas that did not immediately threaten the goal. France therefore connected with more teammates, but many of those connections occurred outside Spain’s defensive block.
The substitutions gave France more dynamism between the lines. Doué, in particular, became their most active danger creator. His willingness to receive, turn and carry the ball added unpredictability that had been missing from the original structure.
But his impact also revealed France’s underlying problem.
Their threat depended increasingly on a substitute producing an individual solution against an established block. Doué could improve the entry into the final third, but he could not by himself guarantee the positioning of the players around the final action.
France’s network became busier and more aggressive.
Spain’s remained more controlled.
## Eleven box entries, no big chances
The clearest illustration of the tactical difference is found in the danger-creation map.
France recorded 11 box entries. Spain recorded only five.
France still finished with no big chance. Spain created three.
That contrast demonstrates why counting penalty-area entries without examining their origin, direction and defensive context can be misleading.
France entered the box more frequently, but many of those entries came from wide positions or after Spain had already recovered into a compact shape. The player receiving inside the area often faced away from goal, had a defender between him and the central lane, or lacked a supporting runner capable of removing the covering defender.
Some entries finished with a backward pass. Others produced a cross against a set defence or a shot from an unfavourable angle.
The location of the entry was advanced. The condition of the attack was not.
France’s six key passes produced six shots, showing that they did manufacture final actions rather than simply circulating harmlessly. However, the value of those actions remained low because the key pass did not consistently eliminate the final defensive line.
A pass can qualify as a chance-creating action while still leaving the shooter with several problems to solve.
Spain entered the penalty area less frequently, but their entries were more selective. Their attacking movements displaced defenders before the final pass, allowing the receiver to attack a clearer central space.
Spain did not require repeated access. They required the correct access.
That is why five entries could produce three big chances while France’s eleven produced none.
## Doué created activity; Baena connected the mechanism
Doué led France’s danger-creation actions, with Dembélé and Mbappé also heavily involved. This profile reflects France’s dependence on individual attacking players to generate the decisive moment.
The pattern was usually sequential: one player received, attempted to beat an opponent and then searched for the final pass.
Spain’s creation was more distributed.
Baena led their creative activity, but Ruiz and Olmo were similarly involved, while Oyarzabal, Porro and Torres also appeared among the main contributors.
This distribution is tactically significant. Spain could create from several positions and through different lines. The chance did not depend on one winger eliminating his opponent.
Baena could connect the left half-space. Ruiz could progress from a deeper position. Olmo could receive between midfield and defence. Oyarzabal could drop or attack the penalty area, while Porro provided width and an arriving threat from deeper on the right.
The final pass came from different players because the same positional principles were functioning across the team.
France had several creators.
Spain had a chance-creation system.
## The shot count concealed the real attacking difference
Both teams attempted ten shots, but France generated only 0.48 xG compared with Spain’s 1.67.
France’s average attempt was worth approximately 0.05 xG. Spain’s was worth approximately 0.17.
The problem was not that France refused to shoot. It was that Spain controlled where and under what conditions those shots were taken.
Mbappé attempted three shots but accumulated only 0.13 xG. Dembélé’s two attempts were worth 0.11, while none of France’s players generated an individually significant opportunity.
This is evidence of Spain successfully controlling France’s main finishers, not merely France suffering from inaccurate shooting.
France had three efforts on target, one more than Spain, but “on target” does not measure how difficult a shot is to save. A low-probability attempt directed at the goalkeeper still counts exactly the same as a clear one-on-one in the basic shot-on-target total.
Spain put only two efforts on target and scored both. That finishing was efficient, but the shot map shows that the efficiency was supported by chance quality.
Oyarzabal generated Spain’s highest-value shooting contribution, while Ruiz and Porro also reached more valuable central locations than France managed to create for their forwards.
Spain’s attempts were clustered closer to the central scoring corridor. France’s were more scattered across difficult angles and lower-value zones.
Ten shots against ten therefore describes volume, not attacking performance.
France produced attempts.
Spain produced solutions.
## The tactical story
Spain did not dominate through possession percentage. They dominated the relationship between structure and outcome.
Their build-up maintained short supporting distances. Their wide and interior players occupied complementary positions. Oyarzabal’s movement disrupted the centre-backs’ reference points, while Baena, Ruiz and Olmo connected possession to the final third.
France’s first-half structure placed considerable attacking quality on the pitch but did not consistently connect that quality to the build-up. Their second-half changes increased activity and territorial pressure, yet much of that possession occurred against a Spanish block prepared to defend the outside spaces.
The decisive difference was not ten shots against ten, or even eleven box entries against five.
It was what the two teams had done to the defence before reaching those moments.
France entered the box more often without disorganising Spain.
Spain disorganised France before entering the box.
France moved the ball toward danger.
Spain created the conditions that made danger decisive.
Julian Alvarez
- From my last update, every single point still remains true
- Arteta sees Julian as a major marquee transformational signing
- There are direct fresh contacts between the ownership at Arsenal and Atleti regarding a possible transfer. There is still a gap in the valuation of the Argentine. Story with @LucaBendoni
- Again, respect to every journalist and their work, but I remain adamant that the player is open to a move to North London IF his dream move to Barca fails
- Atleti remain adamant they will not sell to Barca but my understanding is Barca will engage in talks for one final attempt post World Cup.
- A deal remains difficult but it has not deterred Arsenal from trying to position themselves for an opportunity to sign a top tier forward should Atleti sanction a sale.
- Berta is currently in the capital of Madrid with his family. One source said he has also taken the opportunity to meet with Atleti officials directly but I am waiting on further confirmation on this.
Bruno G
- My understanding is club to club talks have NOT taken place except a phone call from Newcastle asking Arsenal about their stance, which didn’t clarify anything between the parties.
- Berta is still wanting Kia to handle all the negotiations until / if a fair valuation can be reached between BOTH parties.
- Newcastle are aiming to secure a fee within the £80-£85m range as a minimum
- Bruno is fully sold on the project and is awaiting his agents and Kia to handle the situation respectfully.
Rogers
- Currently I am not obliged to update on this current file, when I can I will be sure to explain things in detail.
- People at Arsenal maintain he is the top target for the winger / central attacker role
- For now, all I can say is Spurs showed some interest but as of today Morgan’s focus is Arsenal if a deal can be agreed
Others
- I saw reports about the UAE interest in Norgaard, my understanding is that the player wants to stay in London for at least another year if he is able to.
- I also asked contacts at Fenerebace about Jesus who say currently there is no major interest as of TODAY.
- People around the Tzolis deal on both sides expect it to progress soon.
Excited to share my latest project: Football Match Analysis ⚽📊
Football Match Analysis is an end-to-end Python toolkit that transforms raw WhoScored/Opta match-event data into a complete post-match tactical analysis package.
Starting with a single WhoScored match URL, the project automatically collects the available match data, processes the event stream, calculates advanced metrics, generates tactical visualizations, creates individual player radar profiles, and assembles everything into a structured PDF report with data-driven English commentary.
Data collection and reliability
The project uses multiple data-collection methods to improve reliability:
• cloudscraper
• requests with rotating headers and session handling
• Beautiful Soup for HTML parsing
• Selenium and undetected-chromedriver as browser fallbacks
• DOM-based extraction for official WhoScored/Opta statistics when available
The pipeline extracts and processes match events, players, teams, formations, substitutions, dismissals, shots, passes, goals, assists, qualifiers, coordinates, and official match statistics.
Match and tactical analysis
The project generates around 40 individual analytical visualizations, including:
• Expected Goals (xG) analysis
• xG flow and match-momentum charts
• Home and away shot maps
• Shot-quality and finishing comparisons
• Goal and shot-type breakdowns
• Expected Threat (xT) maps
• xT generated per minute
• Passing networks
• Progressive-pass maps
• Pass distribution by thirds
• Pass target zones
• Zone 14 analysis
• Penalty-area entries
• Cross and wide-delivery analysis
• Average player positions
• Possession and territorial-control analysis
• Dominating-zone maps
• Defensive heatmaps
• Defensive-action summaries
• High turnovers and pressing regains
• PPDA and pressing-intensity analysis
• Goalkeeper save analysis
• Match-stat comparison panels
Locally calculated advanced metrics
The project includes transparent, locally implemented analytical models rather than relying only on displayed totals.
These include:
• Expected Goals (xG)
• Expected Threat (xT)
• Expected Assists (xA)
• Post-shot expected-goal proxies
• Progressive passes and carries
• Shot-creating actions
• Key passes and big chances created
• Box touches and box entries
• Defensive actions and recoveries
• Ground, aerial, and total duels
• Passing accuracy and progression metrics
• Pressing intensity through PPDA
The xG and xT calculations are open approximations based on the available event data. They do not attempt to reproduce proprietary Opta or StatsBomb models.
Player radar profiles
The project generates an individual radar chart for every participating player.
Each radar groups performance metrics into areas such as:
• Attack
• Passing
• Expected threat and chance creation
• Defence
• Duels
�� Ball progression
The chart compares each player with everyone who participated in the same match. It displays both percentile-based visual scaling and the player’s raw match values.
Player participation is reconstructed directly from the event stream using substitutions, dismissals, period endings, and player actions.
The playing-time system calculates the exact time each player spent on the pitch, including:
• First-half added time
• Second-half added time
• Both extra-time periods when played
• Substitutions accurate to the recorded second
• Red-card dismissal time
• Exclusion of penalty shootouts
For example, the radar can display 96′ 08″ played instead of simply limiting a full-match player to 90 minutes.
Reports and exports
For every match, the pipeline can produce:
• Approximately 40 standalone tactical images
• Eight grouped summary boards
• Individual player radar images organized by team
• A multi-page PDF match-analysis report
• Data-driven English tactical commentary
• Player, event, goal, and calculated-metric CSV files
• Individual report pages suitable for publishing
The PDF follows a structured analytical narrative, covering the match story, territorial control, chance creation, buildup, progression, defence, pressing, player performance, methodology, and the final tactical verdict.
Visual design
The project uses a unified visual-design system featuring:
• Team-specific colors
• Automatic kit-color selection
• Contrast and kit-clash protection
• Consistent typography and spacing
• Reusable visualization components
• Dark AMOLED-style presentation
• Publication-ready dashboards and report pages
Windows and memory optimization
Rendering dozens of high-resolution Matplotlib figures and combining them into one PDF can consume a significant amount of memory.
To make the project more stable on Windows, I implemented:
• Memory-safe image-resolution settings
• Progressive DPI fallback during memory pressure
• Explicit release of Matplotlib Agg renderer buffers
• Disk-backed PDF visual loading
• Lazy loading of report images
• Automatic closing of live figures before PDF generation
• Lower peak memory usage during summary-board creation
• Reliable PDF finalization without bad allocation failures
The project has been tested by generating all 40 visualizations, all eight summary boards, player radar profiles, and a complete 56-page PDF report in a single run.
Technology stack
The project is built with:
Python · pandas · NumPy · Matplotlib · SciPy · Rich · requests · cloudscraper · Beautiful Soup · Selenium · undetected-chromedriver · pypdf · PyMuPDF
The objective was not just to create attractive football charts. It was to build a complete and reusable workflow that converts raw match-event data into structured tactical insight—from data collection and metric calculation to visualization, player evaluation, and final reporting.
GitHub:
https://t.co/hxYVGav971
I would be happy to hear your feedback, technical suggestions, or ideas for future analytical features! ⚽