Unique Quantitative Macro Analysis
Providing critical data points, not opinions, to a sophisticated futures trading community for over 20 years.
#GlobalMacro
Weekly chart in Silver: there is an overbought condition. The RSI is above 87; an extremely inflated level. Prior setups via purple lines. This condition should not last much longer; presenting a form of a cooling off period at the least in the coming weeks.
https://t.co/rmC8R5uQdx #silver
Z25 Mini S&P: the 50 day ave (blue line at 6748) is support. A close below may attract some technical selling interest and path to the 100 day ave (red line at 6591.25), but a downward turn in the slope is needed to define a longer-term bear window.
https://t.co/zoKss89xCI #spy
Z 25 WTI: 200 hour average (blue line at 59.82) is a key area of support. A top of the hour close below may attract some selling. However, the slope of the line is still in an upward fashion, with a rollover downward needed for more of a bear window. https://t.co/rmC8R5uQdx #oott #wti
Bitcoin vs. USD: our model driven 4/28 long (purple line) will flip short on a close below 113275. The orange line (trigger) represents an optimized smooth moving average; when a change in slope hits an optimized period, a signal is yielded. https://t.co/zoKss89xCI #BTC
Z 2025 Mini S&P: the 3rd test of the 50 day average in a week (blue line at 6623.75). This is a key support area, with a close below leaving the door open to the 20 week average near 6450; until then a buy zone. https://t.co/zoKss88ZNa #SPY
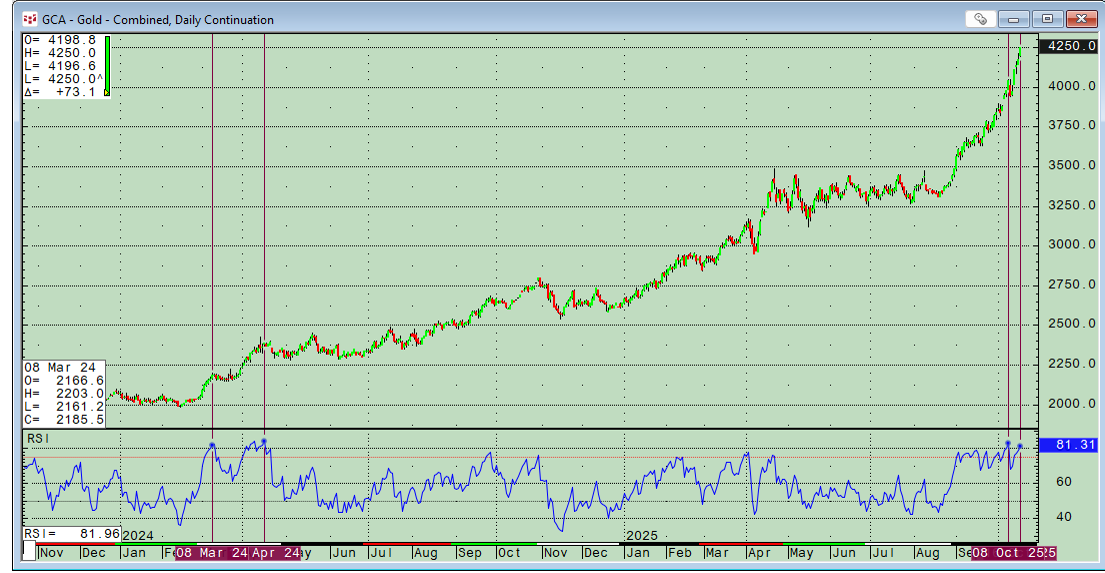
Continuation chart in Gold: there is an historic overbought condition via an RSI (lower pane) above 81. Essentially, that the market is at an historic overbought level, and that should not last much longer resulting in a pause in the pending sessions. https://t.co/zoKss88ZNa
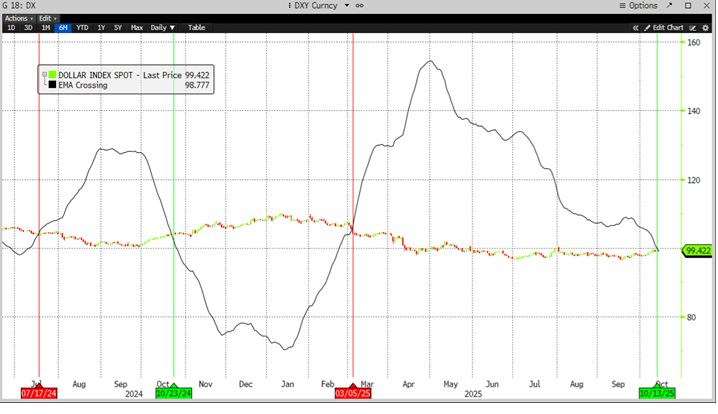
Dollar INDEX: monitor for a close above (black line; optimized group of moving averages) for a buy signal via our trend model on a close over 98.777. Previous buy signal via green line, bears in red.
https://t.co/zoKss88ZNa
#globalmacro#DXY
Z25 WTI: monitor for a positive mean reverting condition via a close above the lower Bollinger Band towards 58.71. Prior similar bullish setups denoted with green vertical lines. https://t.co/zoKss89xCI #wti#oil#oott
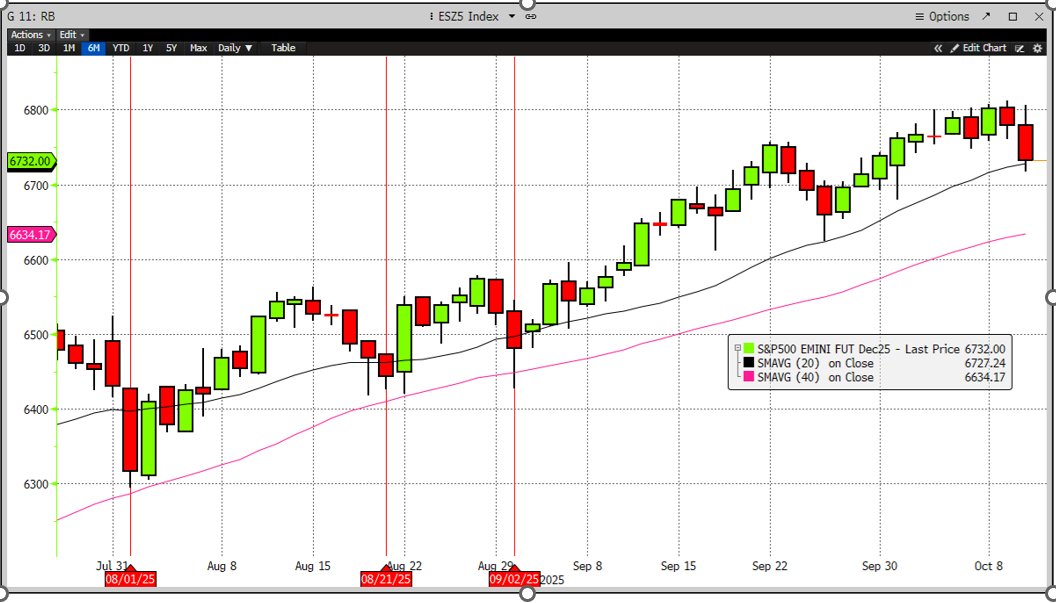
Z 2025 Mini S&P futures: the 20 day average (black line at 6727.25) is a pivotal area of support being probed. Recent new closes below (red lines) have given way to tests of the 40 day average currently at 6634.25 (pink line). https://t.co/zoKss89xCI #spx#globalmacro
H26 WTI: on 10/8, a negative crossover of the 50 day average (red line) below the 100 day average (blue line) was seen. Since longer term used, looking at the H contract. Prior similar bear via purple line, with bull in green. https://t.co/zoKss88ZNa #oott#wti
Continuation chart of Bitcoin futures: monitor for a negative mean reverting condition via a close below the upper Bollinger Band towards 125880. Prior similar bearish setups denoted with red vertical lines.
#btc#crypto
https://t.co/zoKss89xCI
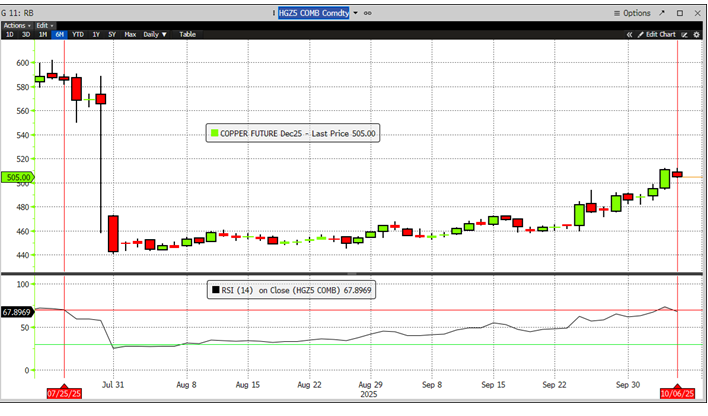
Z25 Comex Copper: monitor for a negative RSI close below 70 (lower pane). Prior similar bearish setup denoted with a red vertical line.
#metals#ooat
https://t.co/zoKss89xCI
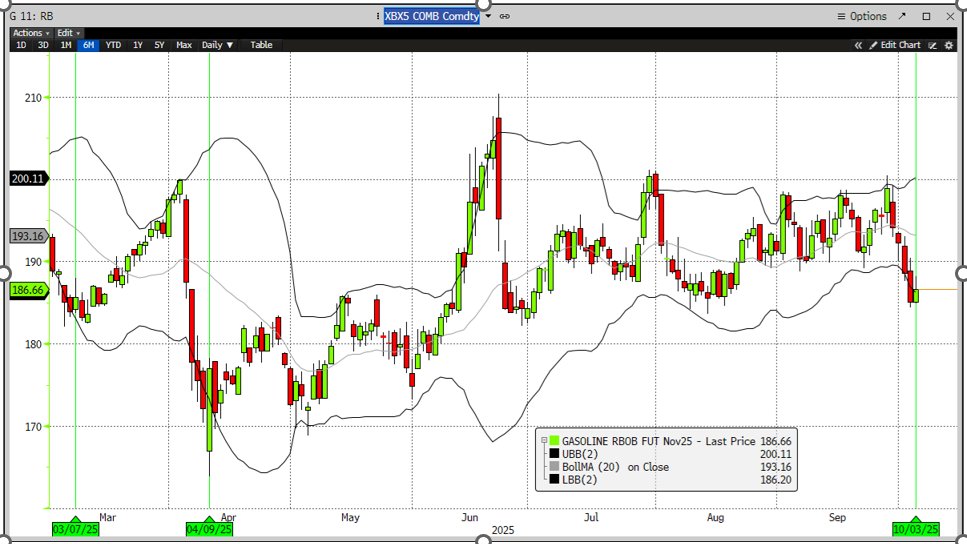
X25 RBOB: monitor for a positive mean reverting close above the lower Bollinger Band of 1.8619. Prior similar bullish setups denoted via green vertical lines.
https://t.co/zoKss89xCI #oott#Oil
Ethereum vs. USD cross: monitor for a positive MACD crossover from below the Zero Line of 4256.563 (lower pane; bullish Ethereum ). Prior setups denoted with green vertical lines. https://t.co/zoKss89xCI #crypto#ethr
Continuation chart in Five Year futures: a positive mean reverting close above the lower Bollinger Band occurred on 9/26 (also in Z25 contract). Prior similar bullish setups denoted with purple vertical lines.
https://t.co/zoKss89xCI #rates#macro
USD vs Japanese Yen: monitor for a negative mean reverting close below the upper Bollinger Band of 149.50 (bearish USD). Prior similar setups denoted via red vertical lines.
https://t.co/zoKss89xCI
#fx
Continuation chart of Bitcoin futures: the 100 day average (red line at 111191) is a key area of support. A settlement below may encourage technical selling (prior setup highlighted with a red vertical line). https://t.co/zoKss89xCI #crypto#btc