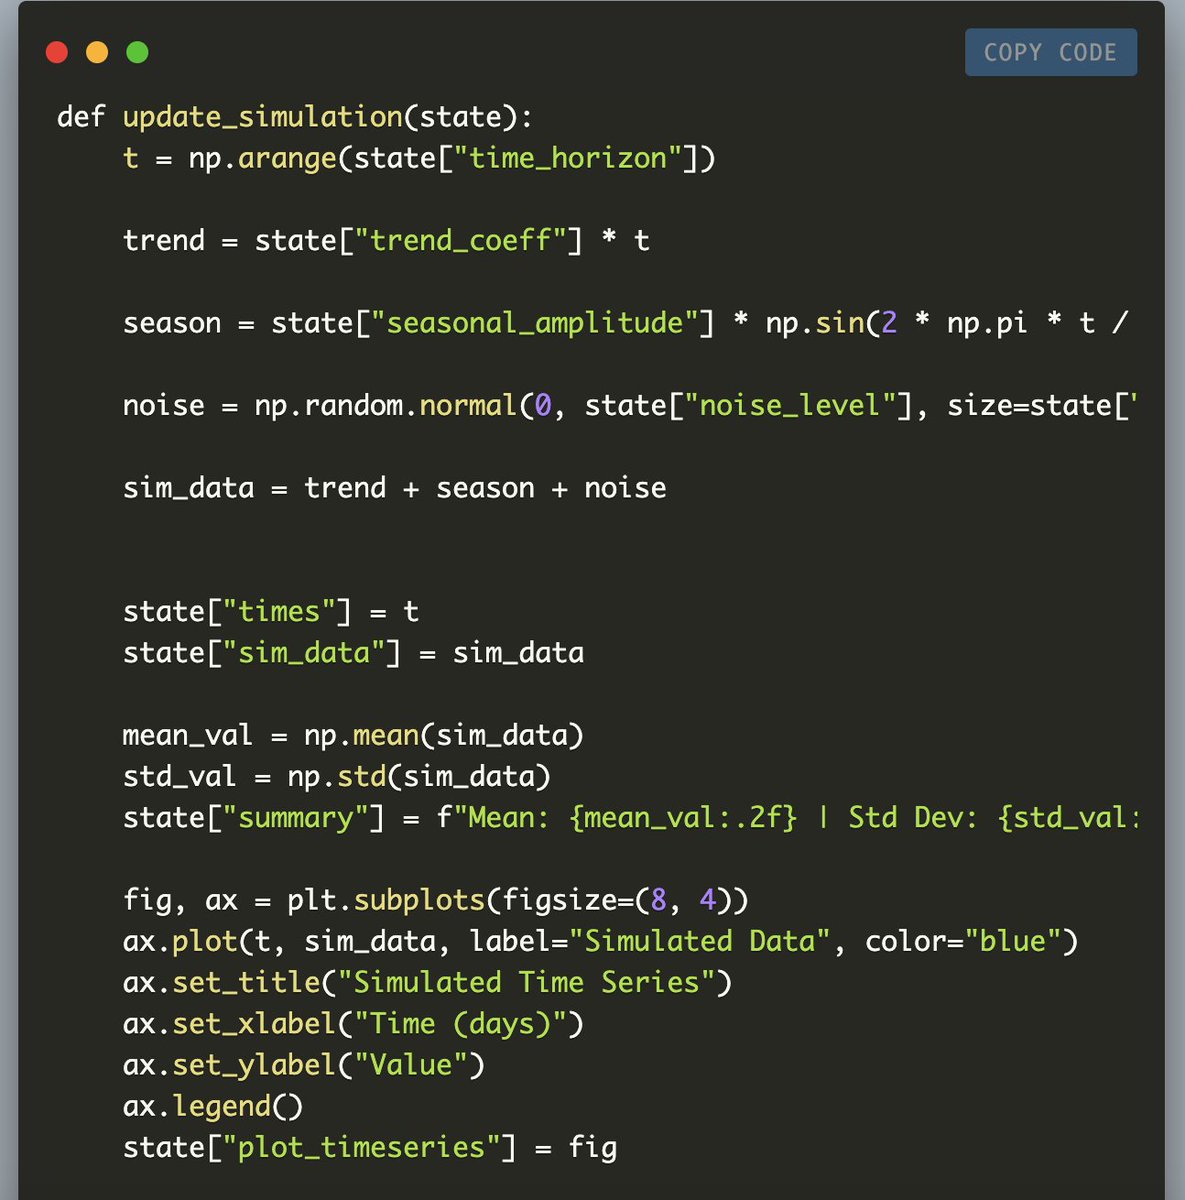
A Coding Implementation for Building Python-based Data and Business intelligence BI Web Applications with Taipy: Dynamic Interactive Time Series Analysis, Real-Time Simulation, Seasonal Decomposition, and Advanced Visualization [Notebook Included]
In this comprehensive tutorial, we explore building an advanced, interactive dashboard with Taipy. Taipy is an innovative framework designed to create dynamic data-driven applications effortlessly. This tutorial will teach you how to harness its power to simulate complex time series data and perform real-time seasonal decomposition. By leveraging Taipy’s reactive state management, we construct a dashboard that allows seamless parameter adjustments, such as modifying trend coefficients, seasonal amplitudes, and noise levels, and updates visual outputs instantaneously. Integrated within a Google Colab environment, this tutorial provides a step-by-step approach to exploring the simulation and subsequent analysis using statsmodels, demonstrating how Taipy can streamline the development of rich, interactive visual analytics.....
Full Tutorial: https://t.co/rcinpujWVX
Colab Notebook: https://t.co/0oFKUTz9ZB
@Taipy_io
Discover Taipy through this complete tutorial and learn how to create a dashboard from scratch all within the Python ecosystem.
https://t.co/4Ye2YPh7LR