Price Action doesn’t need 47 indicators.
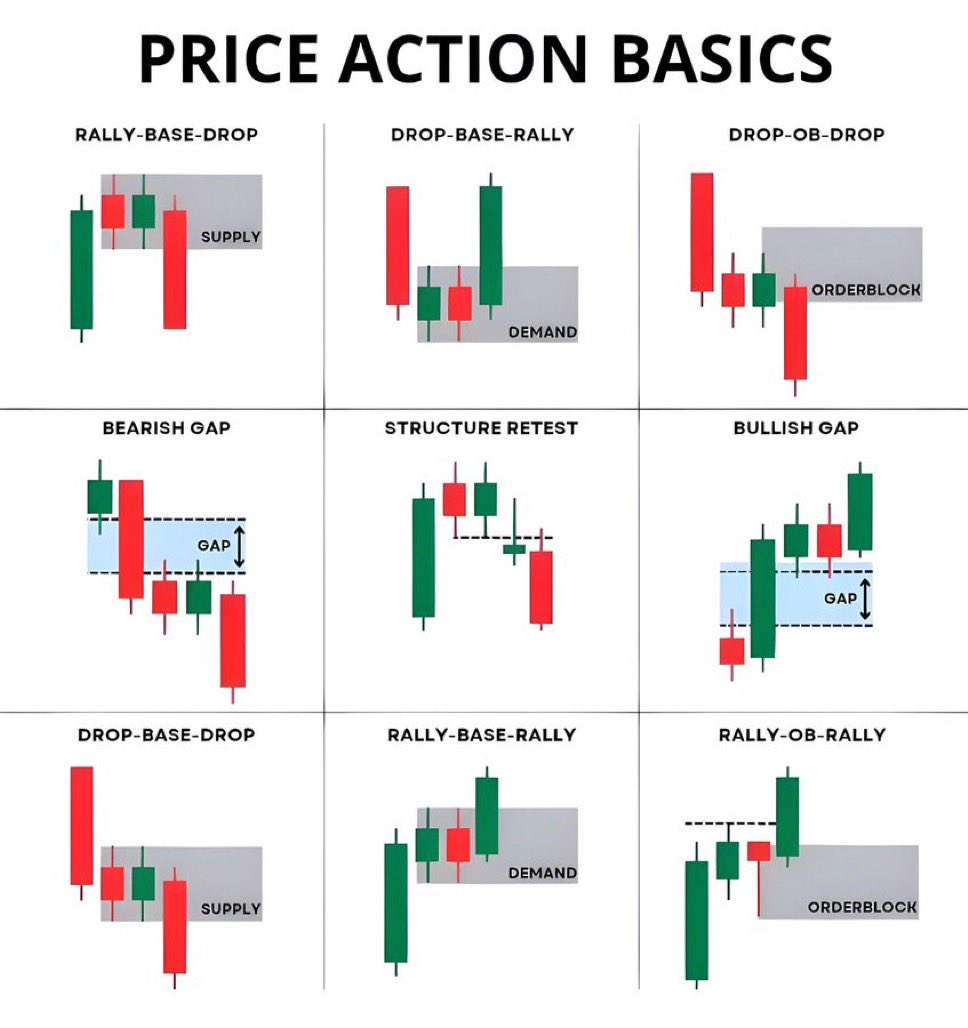
It only needs to understand 9 basic sequences that repeat 80-90% of the time.
Save this cheat sheet – it’s literally how banks & smart money move price:
1️⃣ Rally → Base → Drop = Supply zone created
2️⃣ Drop → Base → Rally = Demand zone created
3️⃣ Drop → Order Block → Drop = Bearish continuation
4️⃣ Rally → Order Block → Rally = Bullish continuation
Bearish Gap = Trapped buyers getting wrecked
Bullish Gap = Trapped shorts getting squeezed
Structure Retest = The highest probability setup in the game
Once you see these 9 patterns, the chart stops looking random and starts looking rigged (because it kind of is).
99% of retail loses because they trade candles.
The 1% trades the sequence behind the candles.
Drop a 🔥 if you’re done overcomplicating trading in 2026.
Follow for daily no-BS price action breakdowns (I only post setups I actually trade).
95% of X is focused on semis, photonics, and memory it seems?
What about the AI drug discovery theme?
-> $ABCL +55% in a week.
-> $TEM still wildly undervalued, especially post $MSFT partnership.
-> $LLY as the $1.1T (future -> $4T drug discovery leader).
What about the critical minerals/materials/metals theme everyone on X went crazy about last year and then forgot about?
-> $COPX is likely no longer a cyclical metal imo post global shift towards EVs, renewables, grid modernization, and data centers.
-> $SLV probably is still one of the more under discussed metals as part of the AI revolution.
-> Rare earths ($MP, $USAR, $UUUU) is still one of the biggest national security risks ahead of the robotics revolution. The US is still 100% reliant on imports for niobium.
-> Scandium / $SRL / $SREMF is actually the most underdiscussed metal here for how vital it is.
Going to just include $TAN in this section too.
What about the AI application layer? The layer that wins in the end will be the layer closest to the end user.
-> It's why $LMND is a big position for me.
What about LatAm?
What about Uranium?
What about the layers to robotics? Actuators/bearings/perception.
Just a friendly reminder that there are big gains elsewhere than just photonics (also very bullish on).
$NVDA
JENSEN IS LIVE WITH THE CEOS OF GOLDMAN SACHS, BLACKROCK, BLACKSTONE KKR, BROOKFIELD, AND APOLLO TO EXPLAIN THIS NEW $500B DEAL:
“Compute is becoming an asset class.”
A TON OF THINGS HAPPENED IN THE STOCK MARKET TODAY.
Here's a full recap:
1. Nvidia $NVDA announced partnerships with Apollo, BlackRock, Blackstone, Brookfield, Goldman Sachs, and KKR to create independent AI compute financing platforms designed to mobilize more than $500 billion of third-party capital over time. The goal is to turn Nvidia compute and full-stack AI infrastructure into an investable asset class, helping fund the global buildout of AI factories while giving Nvidia customers access to large pools of capital at attractive rates. Jensen: “In AI, compute is revenue. NVIDIA compute is uniquely suited for this role. It is broadly adopted, flexible across models and workloads, fungible and transferable across customers and operators, and continuously improved through CUDA software. That is why we are bringing the world’s leading long-term capital providers together to independently underwrite AI infrastructure. These financing platforms will help customers access scarce compute at scale and build the DSX AI factories that will power every industry and country in the age of AI.”
2. Meta $META released Muse Glimmer, a new 30B-parameter dense AI model with open weights that can run locally, with weights for Muse Spark 1.2 expected to follow soon. Meta CEO Mark Zuckerberg also said he believes everyone will eventually have a personal AI agent that understands them and what they care about.
3. Chinese humanoid robot makers accounted for more than 97% of global shipments in 1H26, with volumes more than tripling to 19,100 units. Agibot led the market with a 44% share, while industrial and commercial use cases made up over 70% of shipments. Unitree Robotics is also going public on the Shanghai Stock Exchange at a $9 billion valuation, with its IPO oversubscribed by retail investors by 8000%.
4. Microsoft $MSFT plans to unveil its next-generation Maia 300 AI chip in September, according to The Information, marking progress after a slower start for its in-house silicon program. Microsoft reportedly plans to expand internal use of Maia while also targeting major external customers. The move could give Microsoft more control over the AI infrastructure powering its services as demand for compute continues to surge.
5. Rocket Lab $RKLB reported Q2’26 revenue of $234M, slightly ahead of estimates of $231M, up 62% YoY. EPS came in at -$0.08 versus -$0.07 expected, while backlog reached a record $2.36B, up 137% YoY. For Q3, Rocket Lab guided revenue to $250M–$265M, above estimates of $239M, with non-GAAP gross margin expected at 35%–37%. Non-GAAP gross margin in Q2 was 41.5%, while net loss was $49.3M. Business highlights included the announced Iridium acquisition and the launch of GHOST, a globally deployable launch system. Management said backlog growth, combined with new Q3 deals, represents more than $1B in new contracts across launch and space systems, positioning Rocket Lab to become a self-launching, tier-1 space power.
6. The top 10 most active options today by contracts traded were $NVDA with 3.6M contracts, $TSLA with 1.9M contracts, $AAPL with 1.2M contracts, $SPCX with 1.2M contracts, $MSFT with 1.1M contracts, $MU with 945K contracts, $INTC with 880K contracts, $PLTR with 803K contracts, $AMZN with 778K contracts, and $META with 704K contracts.
7. Hims & Hers $HIMS reported Q2’26 revenue of $753.2M, beating estimates of $700M, up 38% YoY. Adjusted EBITDA came in at $60.3M versus $47.2M expected, while subscribers rose 19% YoY to 2.891M. U.S. revenue grew 16% YoY to $621.8M, while Rest of World revenue surged 1,641% YoY to $131.4M, helped by the close of the Eucalyptus acquisition in June. For Q3, Hims guided revenue to $880M–$900M, well above estimates of $793M. For FY26, the company raised revenue guidance to $3.1B–$3.3B versus $2.93B expected, while reiterating increased conviction in its 2030 targets of at least $6.5B in revenue and $1.3B in adjusted EBITDA.
8. Earnings season is nearly complete, and results have been much stronger than expected. With almost 90% of S&P 500 companies reported, Q2 EPS is now projected to rise 30% YoY excluding investment mark-ups from Alphabet and Amazon, well above the 22% consensus forecast from July 1. Including those one-time gains, EPS growth jumps to nearly 50% YoY. Meanwhile, 76% of companies have beaten EPS expectations, matching last quarter’s beat rate, which was the highest since 2021.
9. Intel $INTC announced a proposed $15B underwritten public offering of common stock, with proceeds intended for general corporate purposes, including CapEx and working capital. The company said customer demand remains strong, driven by major investment in AI compute, with growth opportunities across physical AI, purpose-built silicon, advanced packaging, and external wafers. Intel also expects to give underwriters a 30-day option to buy up to an additional $2.25B of common stock, while emphasizing that the raise is meant to support growth opportunities, maintain balance sheet strength, and preserve its investment-grade rating.
10. Trading volume across the 7 leveraged ETFs tied to $SKHY SK Hynix has collapsed nearly 90% to less than 100M shares/day after regulators raised the minimum cash deposit required to trade the products, effective July 31. The stock decline and tighter rules have shaken out retail investors who chased the rally, with roughly 1T won ($710M) in retail accounts facing forced liquidation in June and another 993B won ($700M) in July, the two largest forced-liquidation months this year. Margin loan balances have fallen to 27.4T won ($19.3B) as of August 4, the lowest level of the year. Morgan Stanley estimates the deleveraging process is now more than halfway complete, though foreign investors remain cautious after selling $30B in June, another $6.2B in July, and $4.3B so far in August.
11. Bank of America is sticking with its call for 75 bps of Fed rate hikes this year despite weaker labor data. U.S. payrolls fell by 23,000 in July, while prior months were revised down by another 103,000. The unemployment rate declined to 4.1%, wage growth slowed to 3.2%, and labor-force participation slipped. Even with hiring softening, BofA still expects the Fed to begin raising rates in September, arguing that inflation remains the central concern.
12. Micron $MU today said customers remain largely insensitive to memory pricing as data center demand continues to outstrip supply, with the company saying it cannot meet even half of current customer needs. Management also pointed to demand signals extending multiple years, though it did not provide a specific update to quarterly guidance.
WALL STREET IS THE GREATEST SHOW ON EARTH.
How to Find the New Leading Stocks in the Market:
One of the biggest mistakes traders make after a correction is trying to find “cheap stocks.”
Instead, I want to find the stocks that are already proving they’re stronger than everything else.
This is where Relative Strength comes in.
And no, I’m not talking about RSI.
Relative Strength is simply comparing how a stock is performing versus the broader market (SPY/QQQ) and its sector.
The easiest time to spot this is actually during a market pullback.
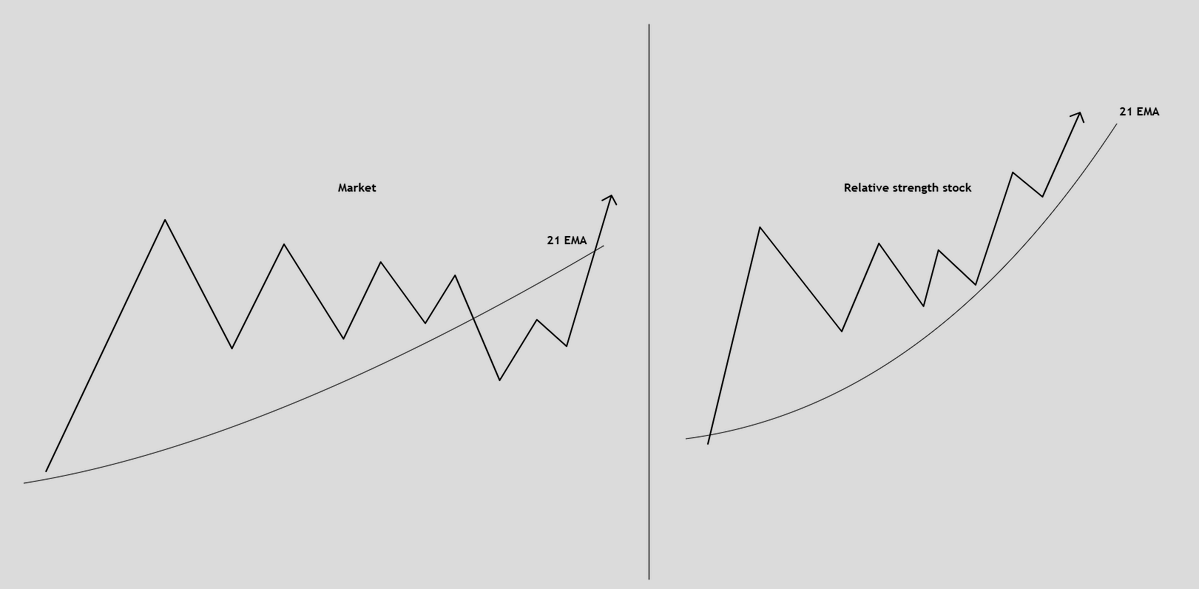
Imagine QQQ is:
-Making lower lows
-Losing its 8 EMA
-Testing/breaking its 21 EMA
-Experiencing several days of selling
Meanwhile, one individual stock is:
-Making higher lows
-Holding above its 8 EMA
-Consolidating tightly
-Closing near its highs
-Refusing to sell off
That divergence tells you that institutions continue to accumulate the stock
The entire market is experiencing selling pressure, yet this stock refuses to break.
Why?
Potentially because there is enough underlying demand to absorb the supply coming into the market.
I think of these stocks like a coiled spring.
The broader market is temporarily acting as a headwind. But while everything else is pulling back, the leader is quietly building a tight base.
Then SPY/QQQ eventually stops falling and catches a bid.
The headwind disappears.
&
because the leader was already strong, it can be one of the first stocks to break out and accelerate when market conditions improve.
This is why market pullbacks are so valuable for building watchlists.
Weak markets expose strong stocks.
From there, I take the analysis one step further:
MARKET → SECTOR → STOCK
First, determine the direction of SPY/QQQ.
Second, identify which sectors are outperforming the market.
Third, find the individual stocks leading those sectors.
If a sector is making new highs while the broader market is flat or pulling back, pay attention.
Then find the stock within that sector that's:
→ Breaking out first
→ Making new highs first
→ Holding moving averages best
→ Showing the highest relative volume
→ Outperforming its peers during market weakness
That's where you can start identifying the true market leader.
One of the strongest forms of Relative Strength can also come after earnings.
A company reports strong growth, beats expectations and raises guidance.
The stock gaps significantly higher on massive volume.
Instead of immediately assuming the move is over, watch what happens next.
If it holds near the highs, trades tightly, defends its moving averages and ignores broader market weakness, that earnings gap may have created an entirely new institutional leader.
The framework is simple:
Don't buy the laggard because you hope it catches up.
Study the stock that's already proving its strength.
My Relative Strength checklist:
✓ Outperforming SPY/QQQ
✓ Higher lows during market weakness
✓ Defending key moving averages
✓ Strong sector
✓ Leading stock within that sector
✓ Volume confirming the move
✓ Strong catalyst when applicable
✓ Tight, constructive price action
The goal isn't to predict which stock might become a leader.
Let price action show you which stocks are already becoming leaders.
In a bull market, almost everything can go up.
The leaders just go up faster.
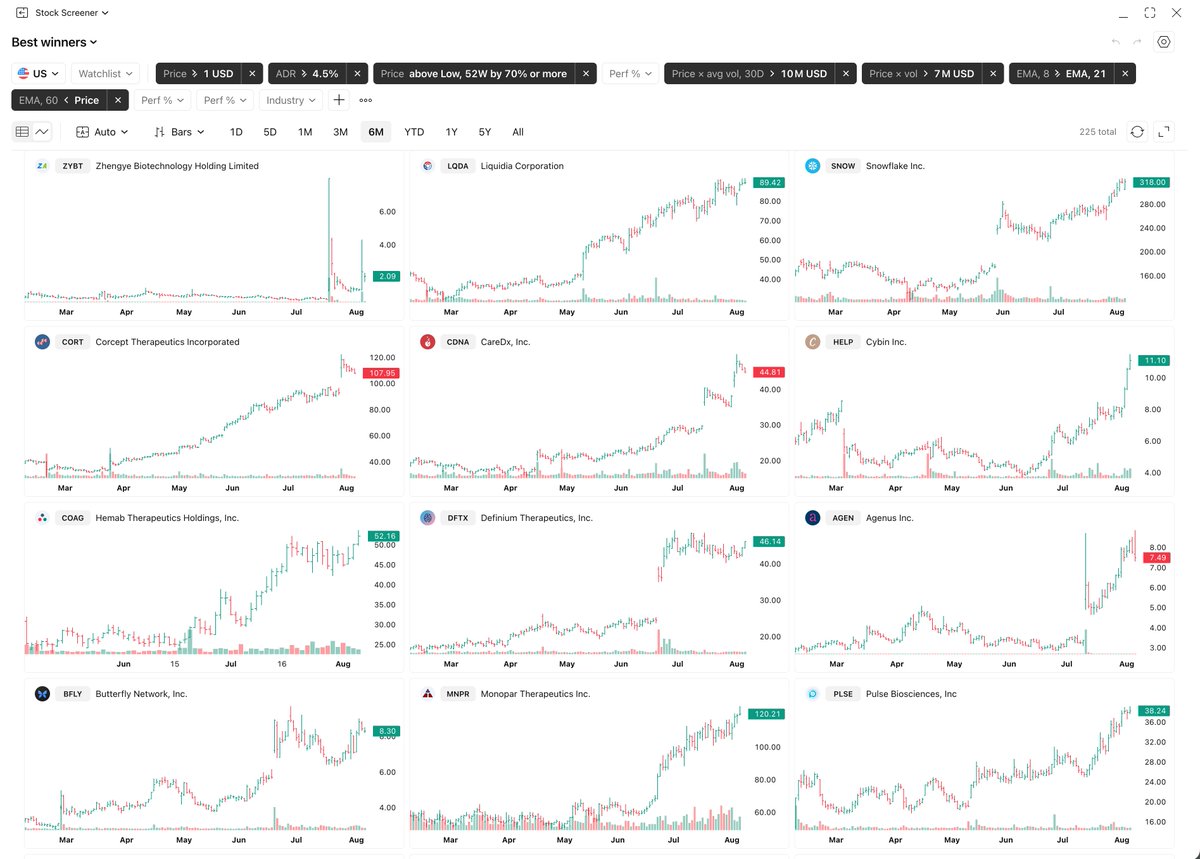
This is the exact screener I use every day to find the strongest stocks in the market 🚀
Almost every major market leader I’ve traded first appeared here: $SNDK, $DELL, $MU …
My "Best Winners" Screener searches for the stocks that have gained the most. Within a few minutes, I can review around 250 charts and find the small number that deserve deeper research.
But a screener only gives you candidates—not buy signals.
I still look for:
• A constructive chart pattern
• Sales growth of at least 20% YoY or EPS growth of at least 50% YoY
• Strong price and volume action
• A compelling company story
• A hot theme such as AI, data centers, or memory
• A low-risk entry with a clear stop
This is where the real work begins.
I study what separates the stock from hundreds of others, add the best names to my watchlist, and wait patiently for a setup.
I built this screener with @TradingView, and it has become an essential part of my systematic stock-selection process.
You do not need ten different screeners producing ten different lists.
You need one good screener, clear selection criteria, and the discipline to repeat the same process every day.
Consistency starts with using a consistent process.
I’m sharing my Best Winner Screener for free:
🔗 https://t.co/FfuBt33xQb
Bookmark this post for your next screening session—and repost it so other swing and position traders can use it too.
I have made MILLIONS trading the AI Sector Rotation
Print this. Keep this. It’s how the next Millions will be made.
My Secret to catching it early?
Following the Sector ETF’s for strength and weakness
AI Ecosystem
• $AIQ: $AMD $INTC $SKHY
Semiconductors
• $SMH: $NVDA $TSM $AVGO
Memory
• $DRAM: $MU $SNDK $WDC
Photonics
• $EUV: $LITE $COHR $AAOI
Software
• $IGV: $PLTR $NOW $ORCL
Cybersecurity
• $CIBR: $CRWD $PANW $FTNT
AI Infrastructure
• $WGMI: $IREN $CORZ $HUT
Data Centers
• $DTCR: $EQIX $DLR $VRT
Physical AI
• $BOTZ: $ISRG $CGNX $TSLA
Space & Defense
• $ARKX: $RKLB $KTOS $SPCX
Nuclear
• $NLR: $CEG $CCJ $OKLO
Quantum
• $QTUM: $IONQ $RGTI $QBTS
Capital rotates through sectors long before most investors notice.
This is how we will catch them early.
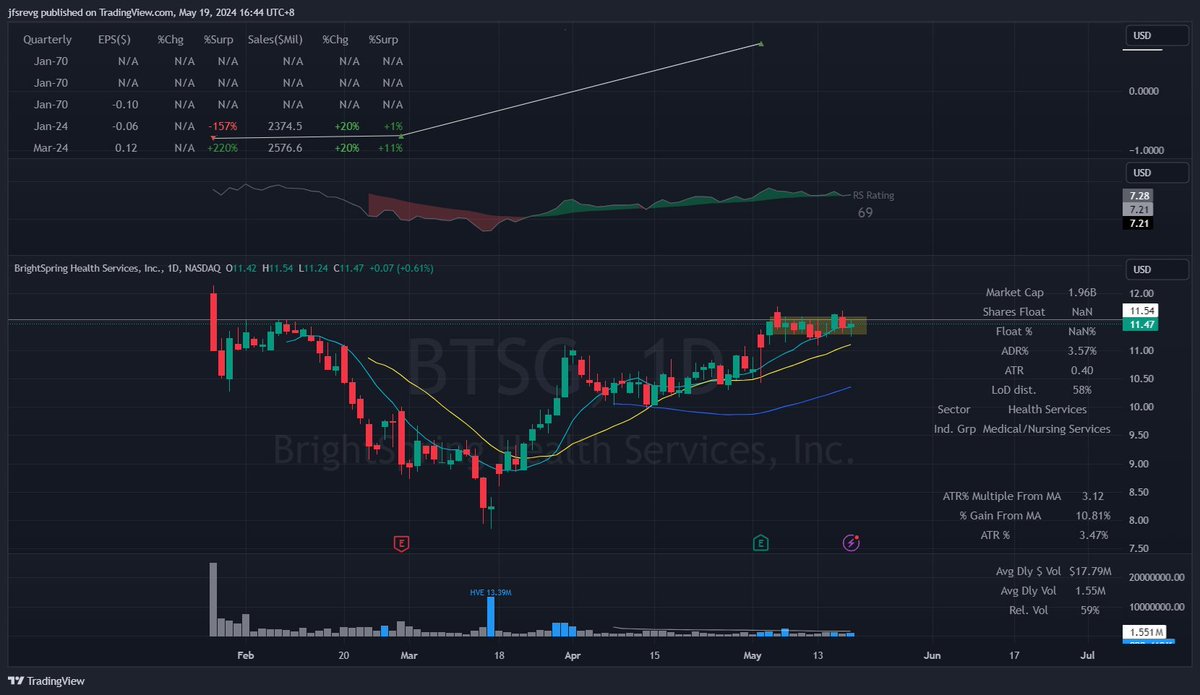
A collection of my @tradingview threads on hacks, indicators, templates, screening and follows.
1. My template and valuable free community tools
https://t.co/gduI7z4Mn3
2. ADR% multiple from 50-MA indicator, courtesy of @DumbleDax (1,000+ free users)
https://t.co/X5KQDfjkxU
3. Swing Data Indicator, courtesy of @DumbleDax (1,300+ free users)
https://t.co/2NWd5z53pX
4. How I interpret and apply Swing Data (LoD, ATR, etc.)
https://t.co/fGhMrnuc5N
5. New TradingView Version 2 (v2) screener along with multi-chart display
https://t.co/owUaqjsHUg
6. Screening within Watchlist
https://t.co/50ZXjyEQV7
7. My 14 screens parameters & daily watchlist screening process on v2 screener (Video)
https://t.co/NSYbzXV0kg
8. My additional Hottest Stock Screen
https://t.co/xBLNPSONqe
9. New Tradingview ETF screener
https://t.co/USs3Qr4WLo
9. Solution to real-time RVOL watchlist tracking for strong volume footprints
https://t.co/SfO8FqA6GD
10. Tradingview Earnings Page
https://t.co/ZcmN2d2xwW
11. Volume Delta (VD) Indicator I'm researching
https://t.co/0H2i4gRrBw
12. Direct feedback, suggestions, and improvements from the community in collaboration with TradingView
https://t.co/zlMsjYg7RL
13. Recommended follows for valuable free Tradingview scripts/indicators and solution @DumbleDax@amphtrading@JohnMuchow@finallynitin
BONUS: Best productivity hack for X users (Video)
1. https://t.co/uBCIIg5RaC
2. https://t.co/GNFqPmTMx2
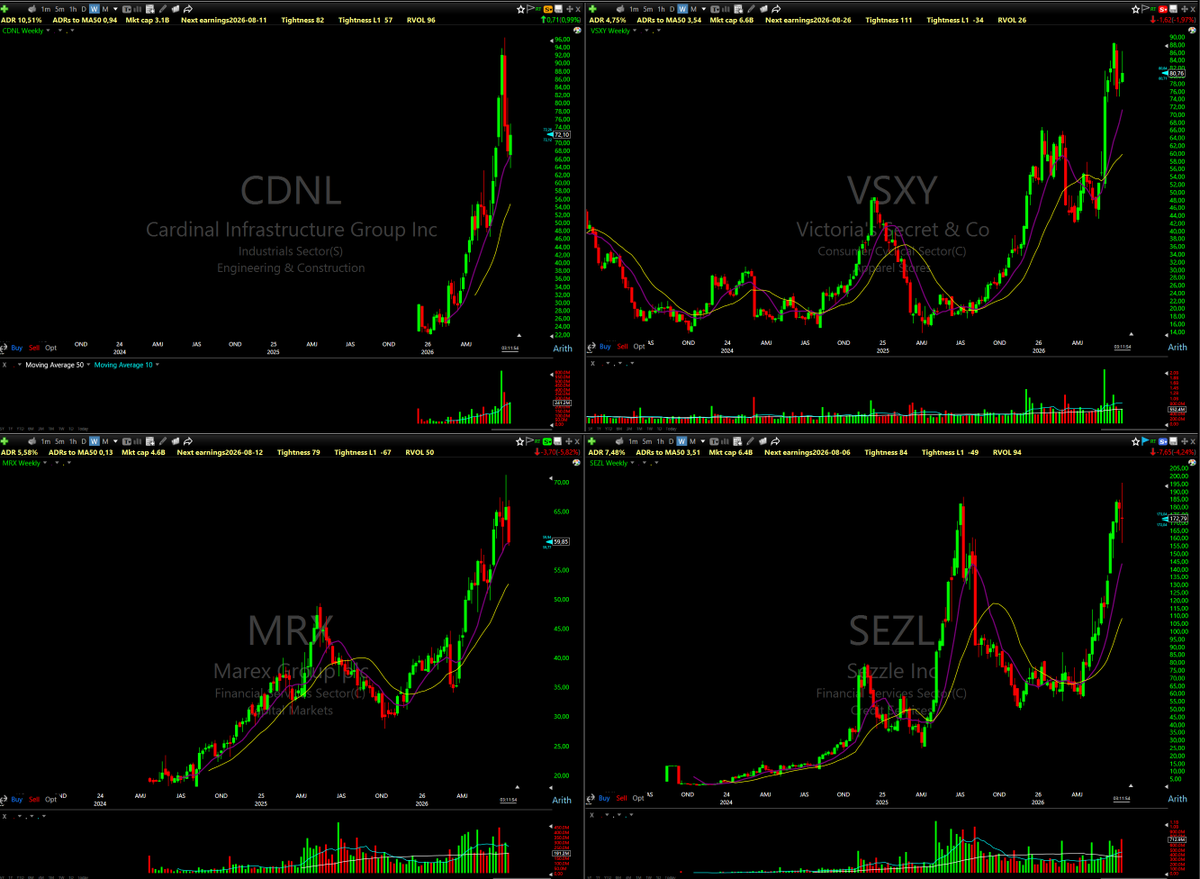
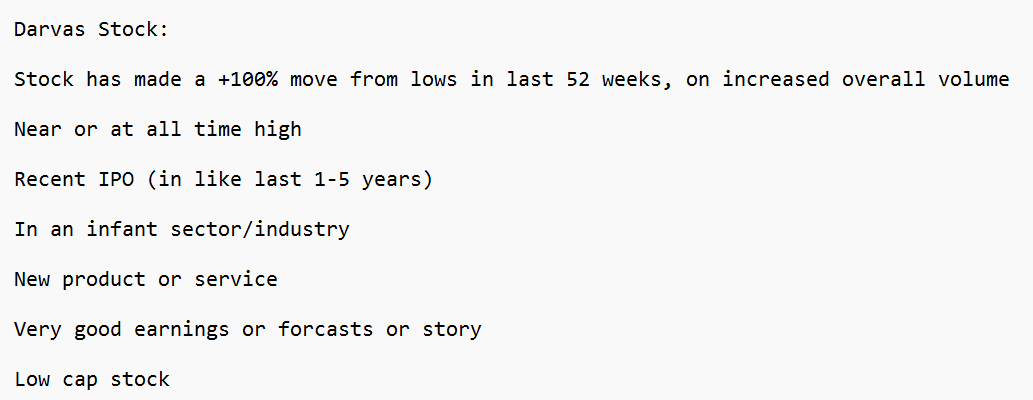
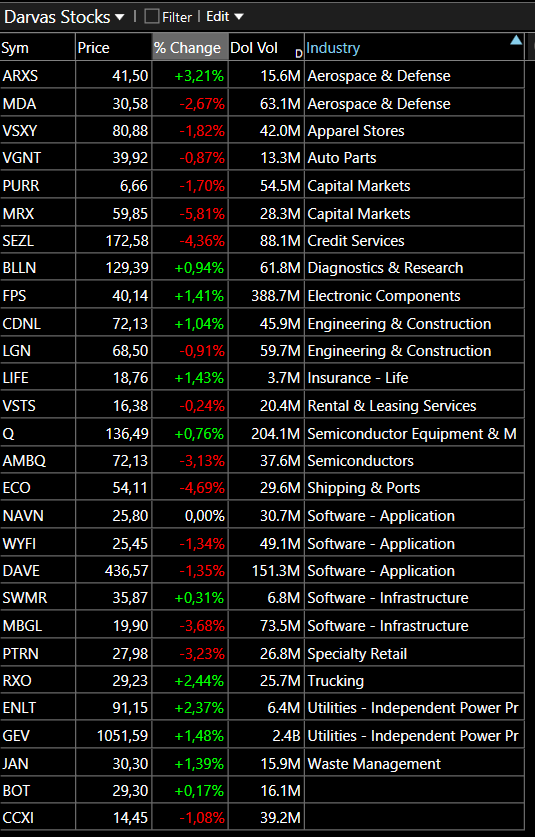
Current Darvas Stock List...
I regard this as one of the MOST IMPORTANT lists I go through EACH day.
This is where I find MOST of the GOLDEN NUGGETS each year...
Darvas criterias are TIMELESS...
Enjoy!
Qullamaggie on Study What Actually Works
“Now if you wanna study past leaders, you know, study something like TTD. Look at how many EPs it’s had right. For example, if you wanna study EP right, study these things: study Roku, study Square, TTD, Twilio, Shopify, Tesla right. That’s how you get good at setup. You know, study what actually works in the market instead of listening to some useless piece of shit on financial media. Study the conditions under which these setups work. What’s the news? What did the market do? Was it in an uptrend? Was it in a downtrend?”
If you are not making money during this run:
You are likely trading the WRONG stocks..
For the last few weeks, all I've done was:
-Focus on strong themes (Semis, space, memory)
-Buy these names on pullbacks into the EMA's
-Hold these winners & don't sell too early
Once these start building bigger bases, now you are going to look for rotation into emerging themes.
How to know where to look?
1. Start With Relative Strength
Emerging themes always leave footprints.
You’ll notice:
-Certain groups stop selling off during weak markets
-They recover faster than indexes
-Multiple stocks in the same niche begin moving together
-Volume starts increasing across the sector
For example:
$IGV was making new highs while $QQQ was still below the previous all time highs
This showed relative strength in the ETF, and software stocks began to emerge with strong setups
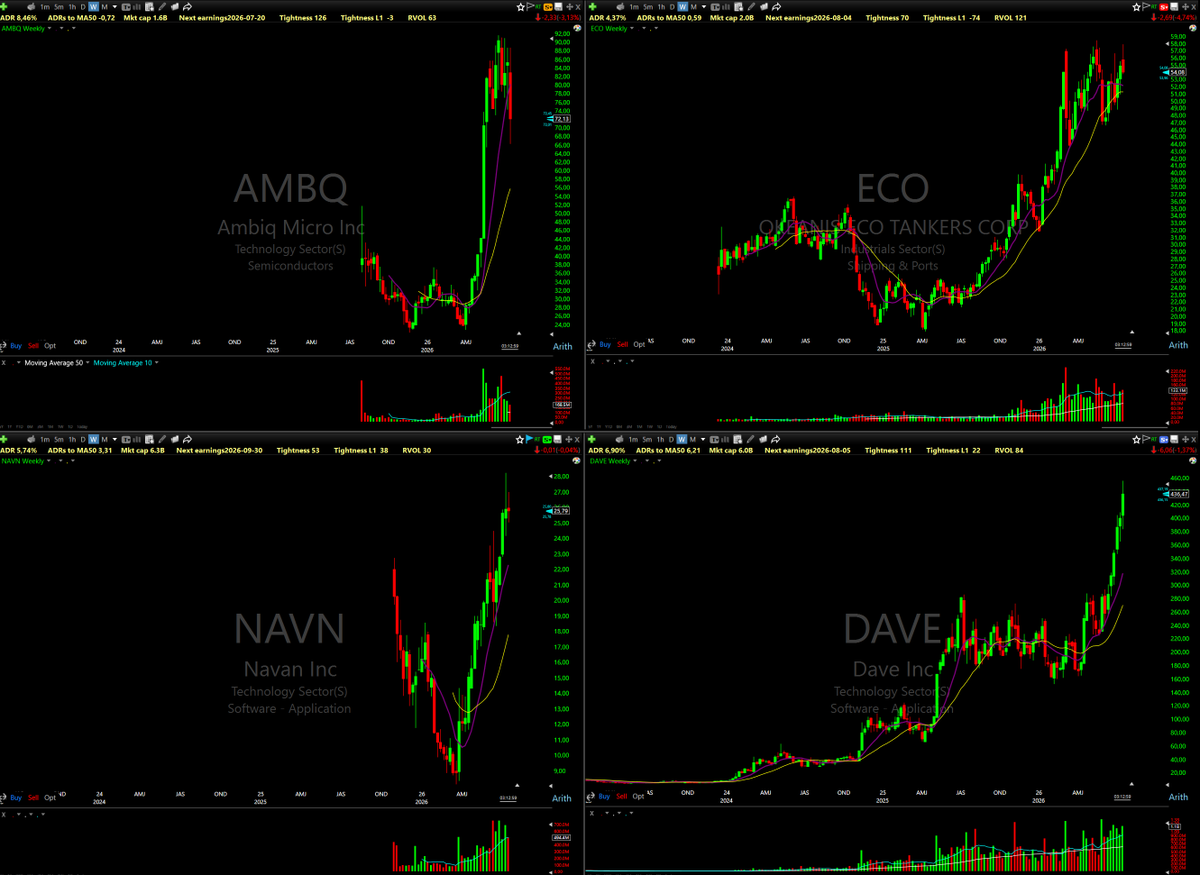
2. Scan Weekly Charts First
You will start noticing that when almost every stock in a sector is setup on the weekly timeframe.. and explosive move follows.
Emerging themes usually appear first on:
-Weekly bases
-Weekly breakouts
-Multi-month consolidations
For example data centers recently.. all had a massive weekly base
3. Follow Volume Closely
Volume is one of the clearest signs of institutional participation.
You will start noticing:
-Highest volume EVER print
-Accumulation volume patterns
-Low volume sell offs
-A breakout with expanding volume often signals real demand
This tells you that institutions are piling into the trade
4. Watch for “Character Changes”
One of the earliest clues is a change in behavior.
Examples:
-Stocks stop failing on breakout attempts
-Pullbacks become shallow
-Names begin closing near highs instead of lows
-Weak sectors suddenly start holding moving averages
A new theme usually starts with:
-Better closes
-Better reactions
-Better continuation
before the headlines catch up...
For example $PLTR and $HOOD in the last few days.. starting to act much better and changing their characters.
5. Track News Narratives
Themes are often tied to macro narratives:
-AI spending
-Government backing
-Defense budgets
Follow themes, and stocks that have a REASON to go higher.
For example drone stocks last week, after the news that the government might take a stake...
Now this becomes top watch.
6. Focus on the Leader (Most important)
Every theme usually has:
-a leader
-secondary names
-laggards
The leader is where institutions concentrate first.
Your goal is to find the strongest theme, the strongest sector, and the strongest stock in that sector.
Characteristics of a leader:
-breaks out first
-has the best volume
-holds moving averages best
-reacts strongest after pullbacks
Most importantly... stack probabilities
Theme + Catalyst + Setup + Leading stock = super performance
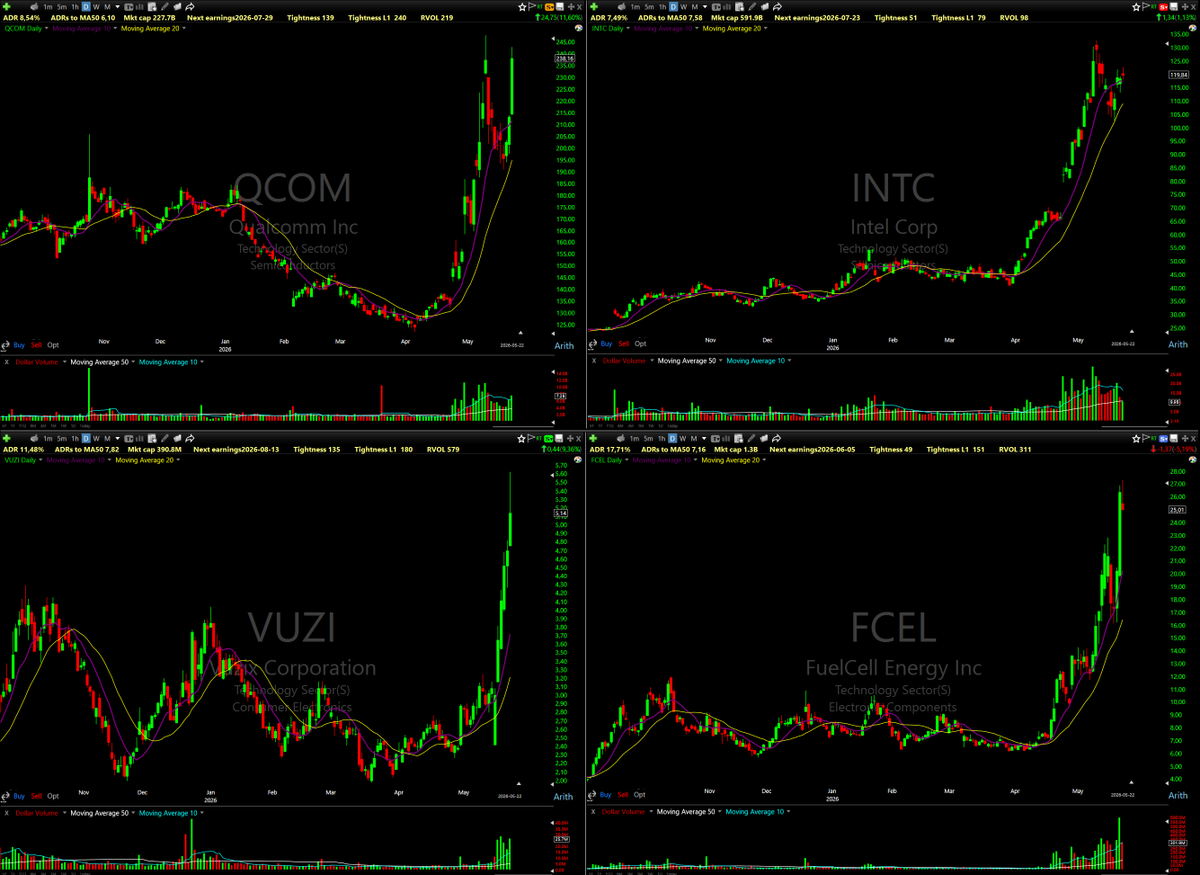
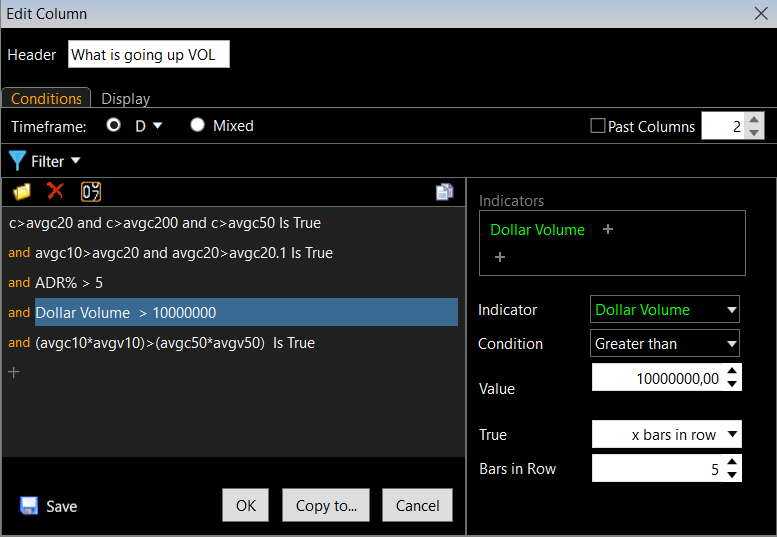
This is a simple but powerful scan I use to know WHAT STOCKS are starting to move up RIGHT NOW...
And more importantly. Moving up right now ON VOLUME...
ENJOY!
A TON OF THINGS HAPPENED IN THE STOCK MARKET TODAY.
Here's a full recap:
1. $CBRS Cerebras opened about 75% above its expected IPO price of $185, giving the AI chip company a roughly $100B market cap despite generating $585M in revenue last year. Ark Invest also bought 105,616 shares just one day after the IPO, adding more attention to the name. The momentum is set to continue with LeverageShares launching a 2x leveraged Cerebras ETF tomorrow morning.
2. President Trump submitted his latest stock purchase and sale disclosures to the White House Office of Ethics, with the filing reportedly spanning more than 100 pages and including thousands of trades. The disclosure is notable because it shows a sitting president actively trading individual securities rather than only holding assets like corporate debt, index funds, or Treasuries. Some of the names listed as purchases include $PLTR, $HOOD, $NVDA, $SOFI, $MSFT, $AAPL, $DIS, $V, $ULTA, $JPM, $COIN, $LYFT, $AMZN, and $RKLB.
3. The U.S. has approved around 10 Chinese companies to purchase Nvidia’s $NVDA H200, the company’s second-most powerful AI chip. Nvidia hit an all time high at $240 today.
4.Figure AI has been livestreaming its humanoid robots performing real warehouse-style package sorting tasks using its Helix-02 AI system. The robots pick up, scan, rotate, and place packages onto conveyor belts autonomously while operating for extremely long periods, including a reported 24/7 run after initially targeting an 8-hour shift. The livestream is meant to prove that humanoid robots can handle repetitive labor reliably and economically, rather than just perform flashy demos. Many viewers see it as one of the first convincing demonstrations of commercially viable humanoid labor, especially for warehouses and logistics. The robot has so far dealt with 34K packages live and has reached parity with a human worker that can do 3 every second.
5. The most traded stocks in the options market today were $NVDA with 5.0M contracts, $TSLA with 2.5M, $NOK with 889K, $F with 860K, $ONDS with 849K, $INTC with 814K, $AAPL with 752K, $MSFT with 736K, $MSTR with 670K, and $MU with 644K.
6. Semiconductor leverage flows surged, with $SOXL, the 3x long semiconductor ETF, taking in a record $1.03B on Tuesday. At the same time, $SOXS, the 3x short semiconductor ETF, saw $230M of outflows, its largest daily withdrawal since late March. $TQQQ also added $161M, its biggest inflow since March 31, but $SOXL inflows were more than 6x larger as traders concentrated bullish exposure in semiconductors. Since the March 30 bottom, $SOXL is up 354%, its strongest 31-day gain since launching in 2010, while the $SOX semiconductor index is up 68%, its third-best 31-day run on record.
7. Retail investors are buying stocks at one of the fastest paces in years. Year-to-date retail equity inflows are ahead of every comparable period over the last seven years except 2021, and after slowing briefly in March, retail buying jumped sharply in April. The week ending May 1 ranked in the top 2% of weekly retail inflows since 2019, and at the current pace, individual investor purchases could surpass the 2021 record as soon as July. Retail options activity is also elevated, with average daily volume now at 1.57x January 2024 levels, the highest since the October 2025 peak.
8. SpaceX could release its IPO prospectus as soon as next week, according to CNBC, after confidentially filing in April. The company’s roadshow is expected to start June 8, with SpaceX reportedly targeting one of the largest public offerings ever following its merger with xAI at a combined $1.25T valuation. The IPO could raise around $70B-$75B, which would be more than twice the size of Saudi Aramco’s record 2019 listing.
9. AI data center demand is putting pressure on power costs across PJM, the largest U.S. grid, which serves 67M people across 13 states and Washington, D.C. Wholesale power prices averaged $136.53/MWh in Q1 2026, up 75.5% from $77.78/MWh a year ago. Capacity costs rose 398.1% year-over-year, while congestion costs increased 300.4% to $2B.
10. Tech layoffs have now passed 100,000 in 2026, with TNW reporting cuts across roughly 250 events this year. LinkedIn is reducing headcount by about 5% despite 12% revenue growth, while Cloudflare is cutting more than 1,100 roles, or about 20% of its workforce. AI is becoming a major driver of the reset, with Challenger citing it as the top reason for job cuts in both March and April and linking AI to 49,135 announced layoffs so far this year.
11. President Trump said President Xi told him China will not supply military equipment to Iran and supports a peace agreement. Trump also said Xi offered to help mediate the situation and work toward reopening the Strait of Hormuz, a critical shipping route for global oil flows.
12. The CLARITY Act advanced out of the Senate Banking Committee today in a 15-9 bipartisan vote. The bill would create clearer federal rules for crypto, including when tokens are treated as securities versus commodities. Crypto stocks rallied on the news, including Coinbase, as investors viewed it as a major step toward regulatory certainty. The bill still is not law and needs full Senate approval, House reconciliation, and final passage. The main fights now are over stablecoin rewards, anti-money-laundering rules, and ethics concerns tied to political figures profiting from crypto. $BTC Bitcoin passed $81,000.
WALL STREET IS THE GREATEST SHOW ON EARTH.
$TSLA $BE $STX $SNDK $AGQ $WDC $AAOI
Many of you have been asking me to organize my threads in one place — here it is 🙏
I've put immense hard work into building each one of these. Every thread is from real experience, real setups, and real trades.
This weekend I'll be going through all of these myself, scanning charts, and getting fully locked in for Monday's open 📈
Work through these top to bottom
👇
1️⃣ The 5 Setups I Trade (Start Here)
🔗 https://t.co/tN9B2qsGMw
2️⃣ Why Moving Averages Are Everything
🔗 https://t.co/I2PJ9rsnsG
3️⃣ How to Trade the Undercut & Rally Setup
🔗 https://t.co/OckVXhLWW6
4️⃣ How to Find the Setups (All My Scanners)
🔗 https://t.co/VWwM9FBhJS
5️⃣ How to Enter (30-Min ORB Strategy)
🔗 https://t.co/TqwrzrPGqf
6️⃣ Master Intraday Trading Rules & Checklist
🔗 https://t.co/aRmJxAY3vF
7️⃣ How to Manage Risk (Position Sizing + Stops)
🔗 https://t.co/fxRuxvxotL
8️⃣ How Qullamaggie Uses VWAP + Short Setup & Tools
🔗 https://t.co/lIPiUzQTmy
9️⃣ How to Trade Parabolic Stocks (Long & Short)
🔗 https://t.co/rxkDNa7hWi
🔟 How to Short Stocks Like a Pro (Complete Playbook)
🔗 https://t.co/ApC5fHGrk7
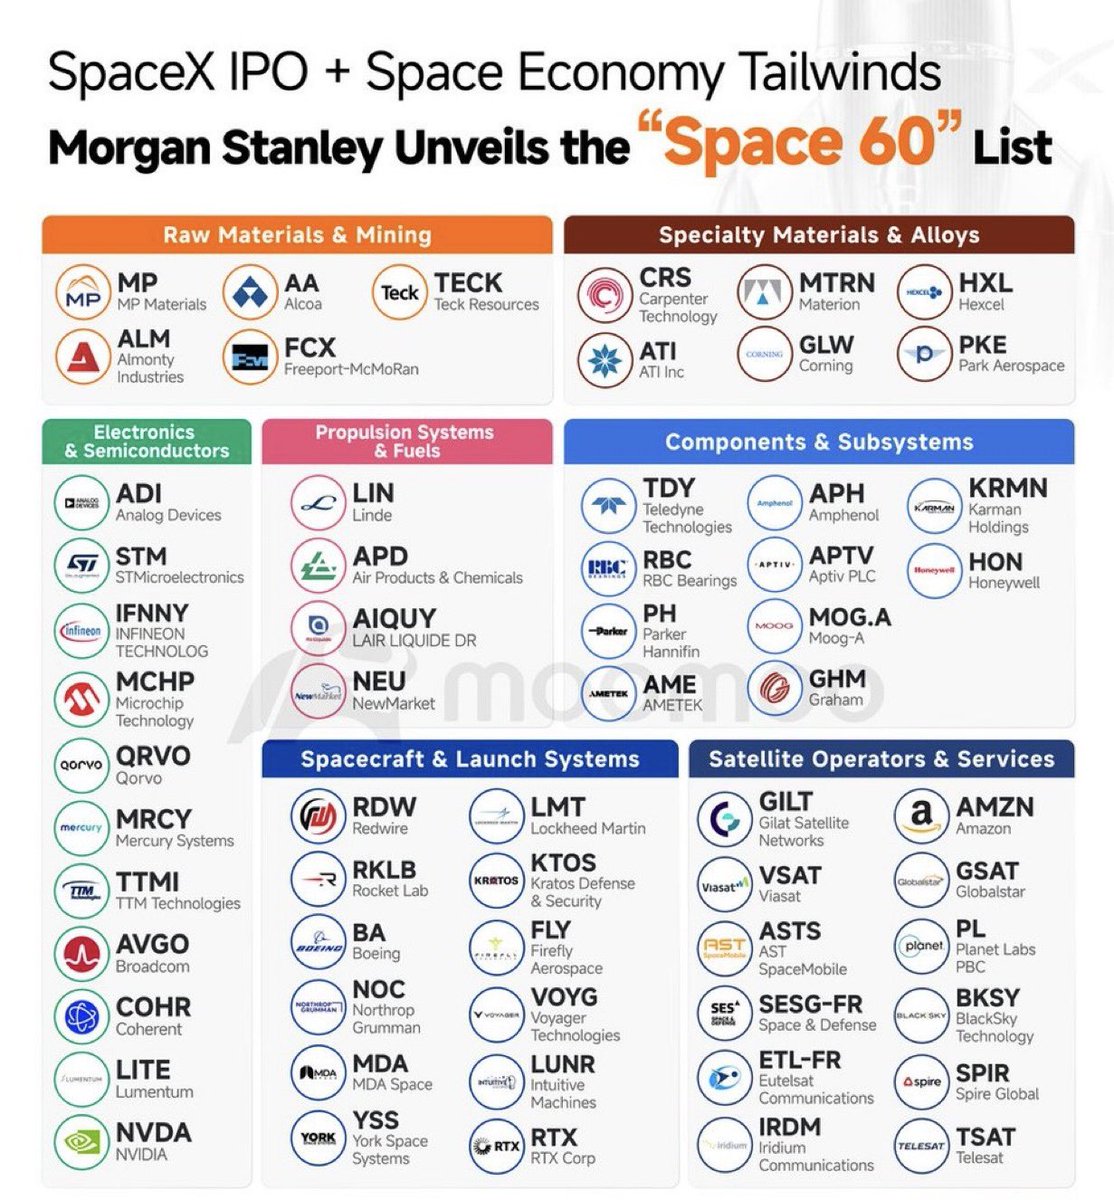
SPACE ECONOMY CHEAT SHEET
A SpaceX IPO likely forces the market to look beyond rockets and start repricing the full supply chain and infrastructure layer beneath the space economy:
Spacecraft & Launch Systems
• $YSS manufactures standardized satellite buses for rapid deployment
• $RKLB builds launch vehicles, spacecraft systems & broader orbital infrastructure
• $VOYG supplies space infrastructure & in-space services for government programs
• $LUNR provides lunar landers & surface delivery systems tied to NASA Artemis missions
• $FLY develops launch vehicles & lunar lander services for commercial & government missions
• $RDW manufactures spacecraft components, deployable structures & in-space manufacturing systems
Satellite Operators & Services
• $BKSY provides real-time geospatial intelligence & high-revisit satellite imagery
• $IRDM operates the only truly global LEO satellite network covering the entire planet
• $SPIR delivers satellite-based data & analytics across maritime, weather & RF monitoring
• $AMZN building a direct-to-device & broadband satellite network through Project Kuiper + $GSAT assets
• $PL operates the largest Earth observation constellation serving commercial, defense & intelligence customers
• $ASTS building a space-based cellular broadband network for D2D connectivity with BlueBird 7 launching April 19 & 45-60 satellites targeted by year-end 2026
Raw Materials & Mining
• $AA supplies aluminum used in launch vehicles & spacecraft structure
• $FCX provides copper that feeds power systems & electronics across the space stack
• $TECK offers diversified exposure to critical minerals tied to aerospace & industrial buildout
• $MP controls the only scaled rare earth mining & processing asset in the U.S. supporting satellite & propulsion supply chains
Specialty Materials & Alloys
• $ATI produces titanium & nickel alloys critical to propulsion & aerospace systems
• $HXL makes carbon fiber composites used in launch vehicles & satellite structures
• $PKE manufactures advanced composite materials for aerospace & defense structures
• $CRS supplies high-performance alloys used in rocket engines & spacecraft component
• $GLW supplies specialty glass & optical components for satellite communications & sensing
• $MTRN provides advanced materials & precision components for defense and space systems
Electronics & Semiconductors
• $QRVO supplies RF chips & filter components for satellite communications payloads
• $LITE supplies optical components & lasers used in high-speed communications links
• $ADI supplies precision analog & sensing chips used across satellite and launch systems
• $COHR provides lasers & optical components tied to satellite & communications systems
• $NVDA provides AI compute infrastructure for satellite data processing & autonomous systems
• $STM provides semiconductors for guidance, control & communications in space-grade applications
• $AVGO supplies connectivity & networking semiconductors used across communications infrastructure
Qullamaggie on It’s All About Ranges
“QS looks like it’s broken this down trend? I think it needs to go sideways a week or so before we get a nice tradable range. It’s all about ranges really. That’s how you trade, you don’t need to catch any falling knives. You don’t need to do any you know crazy stuff, all you have to do is wait for ranges on the daily, on the 60 minute, on the weekly. It doesn’t matter what time frames you’re looking at, ranges. That’s where it’s at.“
Qullamaggie on Not Seeing Setups Means You Should Trade Cautiously
“I don’t see a lot. I really don’t. Yeah, there’s really not much going on. I still think this is a market to be cautious in, not to be aggressive in. We’ve had almost 12 months of very aggressive markets, easy money, and now, you know, you have to adapt. Easy money is not there yet anymore for now.
Not seeing any setups means you should trade very little, very cautiously. I just don’t see any good long or short setups. Maybe a few, but you know, this just… you want to see a lot of setups. If you only see a few, the fail rate is pretty high.”
Qullamaggie on There Are 2-3 Bull Runs Every Year Even in Bad Markets
“Chop market for years? No… we’re gonna have a 3-4 month uptrend again, but no, it’s not gonna be in two years or something. It’s probably gonna be, you know, it may take a while. It may take many months, but we’re gonna have a pretty decent run sometime this year.
You usually get at least two decent runs even in shitty markets. Like in 2008, you had like two pretty decent bull runs, and that was like the worst market year in like 80 years.
Those of you like, “Oh, maybe we won’t get a good market again for years.” Well, you know what? It’s very easy to find out. Look at history. Just go back and look at the NASDAQ. Go look at the Dow Jones. You will see pretty much every market year usually has a like… an average market year usually has 2-3 decent bull runs.
Educate yourself. Study. This is what you’re supposed to do now during markets like this. That’s the only way. Now the Dow Jones is a pretty shitty index, but you will see… the thing is you can go back very far. You can literally go back to like the 1920s, 1930s. Study. And also realize, even in periods like this — when the market, let’s say from mid ‘51 to mid ‘52, you know the market really didn’t have any big up moves or down moves, it was a sideways range — you still have leading sectors that go up.
There’s always something. Money is flowing into something. So have patience. Educate yourself. Don’t lose confidence when you lose confidence. Well… you’re done.”