Satrix MSCI World ETF’s H1 gains more than tripled to KSh 15.71Bn, driven by KSh 15.84Bn in fair-value gains, as closing net assets rose 16.5% from December to KSh 196.70Bn.
The fund, which listed on the NSE at KSh 761 a unit in July 2025, switched its underlying investment to Amundi’s lower-cost MSCI World ETF in September while retaining the same benchmark.
Figures translated at R1 = KSh 8.08.
I encountered these traders on City Hall Way outside KICC. They were very orderly, only blowing their whistles and vuvuzela on their way towards Parliament Road. Not chaotic at all, not disorderly or disruptive in any way.
And then the police decided to lob teargas at them. Unprovoked, without any attempt at even controlling and/or guiding them.
Police action elicited pandemonium even to the unaffected non-protesters.
We warned people about these affordable houses. We warned people about Ruto. Unfortunately, you made the bed, lie on it and use your tears as the blankets.
Then the same people are still shouting TUTAM. NKT!
Britam reported a robust performance in H12026. I note the following strong points
-Decent insurance revenue growth at 14%
-Fund management fees +68%
-An improvement in Insurance service result +36%
-Turn around in cash from operations
-borrowings reduction by 59%. At that rate the Group could be debt free very soon
And what am not happy about:
⛔️cost management: operating expenses up 53%, growing faster than revenue
⛔️investment income down 22% due to lower yields on GoK paper
Overall. The best set of results from Britam in a very long time
Britam Holdings H1 2026 Results (YoY, KES):
— Insurance Revenue: +13.7% to 22.39B
— Net Insurance Service Result: +36.1% to 1.76B
— Net Investment Income: -22.4% to 13.42B
— Net Insurance & Investment Result: +63.1% to 4.25B
— Fund Management Fees: +68.2% to 662.0M
— PBT: +52.0% to 3.82B
— PAT: +53.3% to 2.66B
— EPS: +54.4% to 1.05
— Total Assets: +11.1% to 270.84B
— Total Equity: +7.2% to 37.57B
Summary: Britam Holdings’ H1 2026 PAT rose 53.3% to KES 2.66B, while PBT increased 52.0% to KES 3.82B as the net insurance service result grew 36.1% to KES 1.76B and the net insurance and investment result rose 63.1% to KES 4.25B. Insurance revenue increased 13.7% to KES 22.39B and fund management fees rose 68.2% to KES 662M, offsetting a 22.4% decline in net investment income to KES 13.42B as fair-value gains on financial assets fell to KES 1.11B from KES 6.25B.
Bamburi Cement PLC H1 2026 Results (KES, YoY):
— Turnover: +20.2% to 13.72B
— Total Operating Costs: +13.0% to 11.67B
— Operating Profit: +72.5% to 2.05B
— Finance Income (net): +193.8% to 141.0M
— Profit Before Tax: +77.2% to 2.19B
— Profit After Tax: +58.7% to 1.37B
— Total Comprehensive Income: +75.8% to 1.62B
— EPS: +58.8% to 3.78
— Total Assets: +5.7% to 33.76B
— Equity Attributable to Owners: +5.6% to 30.34B
— Cash and Short-Term Deposits: +18.5% to 9.50B
— Interim Dividend: None
Summary: Bamburi Cement’s H1 2026 turnover rose 20.2% YoY to KES13.72B, while operating profit jumped 72.5% to a record KES2.05B as revenue growth outpaced costs. Profit after tax increased 58.7% to KES1.37B, with cash and short-term deposits more than doubling on improved profitability and working-capital management. Equity attributable to shareholders stood at KES30.34B, with no interim dividend declared.
NSE H1 2026 Management Commentary:
— Management attributed the strong H1 performance to higher trading activity across equities and fixed income, with equity transaction levy income rising 476% to KES 770.5M and fixed-income revenue increasing 22% to KES 187.3M.
— Equity activity was supported by stronger domestic and foreign investor participation, improved market liquidity and the Safaricom block trade, while data income rose 29% to KES 75.2M on higher demand for market data products.
— The NSE plans to implement a new integrated market infrastructure system in H2 2026 to improve market efficiency, resilience and risk management, while supporting new products and services.
— Management also expects additional equity and debt listings and capital-raising activity in H2, with a pipeline of prospective issuers at various stages of preparation.
CIC Insurance Group H1 2026 Results [KES, YoY]:
— Insurance Revenue: +17.8% to 16.34B
— Insurance Service Result: -67.2% to 42.0M
— Investment Return: +43.9% to 3.96B
— Net Investment Result: +11.1% to 1.68B
— Asset Management Revenue: +25.2% to 1.04B
— Operating Profit: +20.6% to 1.85B
— Profit Before Tax: +30.2% to 1.56B
— Profit After Tax: +70.3% to 1.09B
— EPS: +65.2% to 0.38
— Total Assets: +10.8% to 81.68B
— Total Equity: +4.6% to 12.40B
Summary: CIC Insurance Group's H1 2026 profit after tax jumped 70.3% to KES 1.09B despite insurance service result collapsing 67.2% to 42.0M, as strong investment returns (+43.9% to 3.96B) and a 25.2% rise in asset management revenue carried the bottom line. Total assets grew 10.8% to 81.68B and EPS rose 65.2% to 0.38, though the underwriting weakness signals the growth is coming more from investment income than core insurance operations.
Nairobi Securities Exchange (NSE) H1 2026 Results [KES, YoY]:
— Total Income: +136.6% to 1.21B
— Equity Transaction Levy: +475.6% to 770.5M
— Bond Transaction Levy: +22.4% to 187.3M
— Data Income: +29.4% to 75.3M
— Total Operating Expenses: -0.1% to 309.7M
— Profit Before Tax: +396.0% to 1.01B
— Profit After Tax: +386.1% to 736.9M
— Total Assets: +57.5% to 3.62B
— Total Equity: +39.5% to 2.87B
— EPS: 2.82 [H1 25: 0.58]
— Interim Dividend: Nil
Summary: The NSE’s H1 2026 profit after tax rose 386.1% to KES 736.9M as total income increased 136.6% to KES 1.21B, driven by a 475.6% jump in equity transaction levy income to KES 770.5M. Profit before tax increased 396.0% to KES 1.01B, while operating expenses remained broadly flat at KES 309.7M & EPS rose 386.2% to KES 2.82.
Limuru Tea H1 2026 Results [KES, YoY]:
— Revenue: +23.0% to 69.9M
— Pre-tax loss: 21.1M [H1 25: 22.2M loss]
— Net loss: 21.1M [H1 25: 22.2M loss]
— EPS: -8.81 [H1 25: -9.25]
— Cash & Cash Equivalents: +9.4% to 8.3M
— Total Equity: -28.6% to 109.2M
— Interim Dividend: Nil
Commentary: Made tea volumes increased 14% to 492 tonnes from 2,212 tonnes of green leaf produced, while relatively stable tea prices supported the narrower pre-tax loss. Management said rising labour costs continued to push production costs higher, with tea prices softening towards the end of H1 as market conditions weakened.
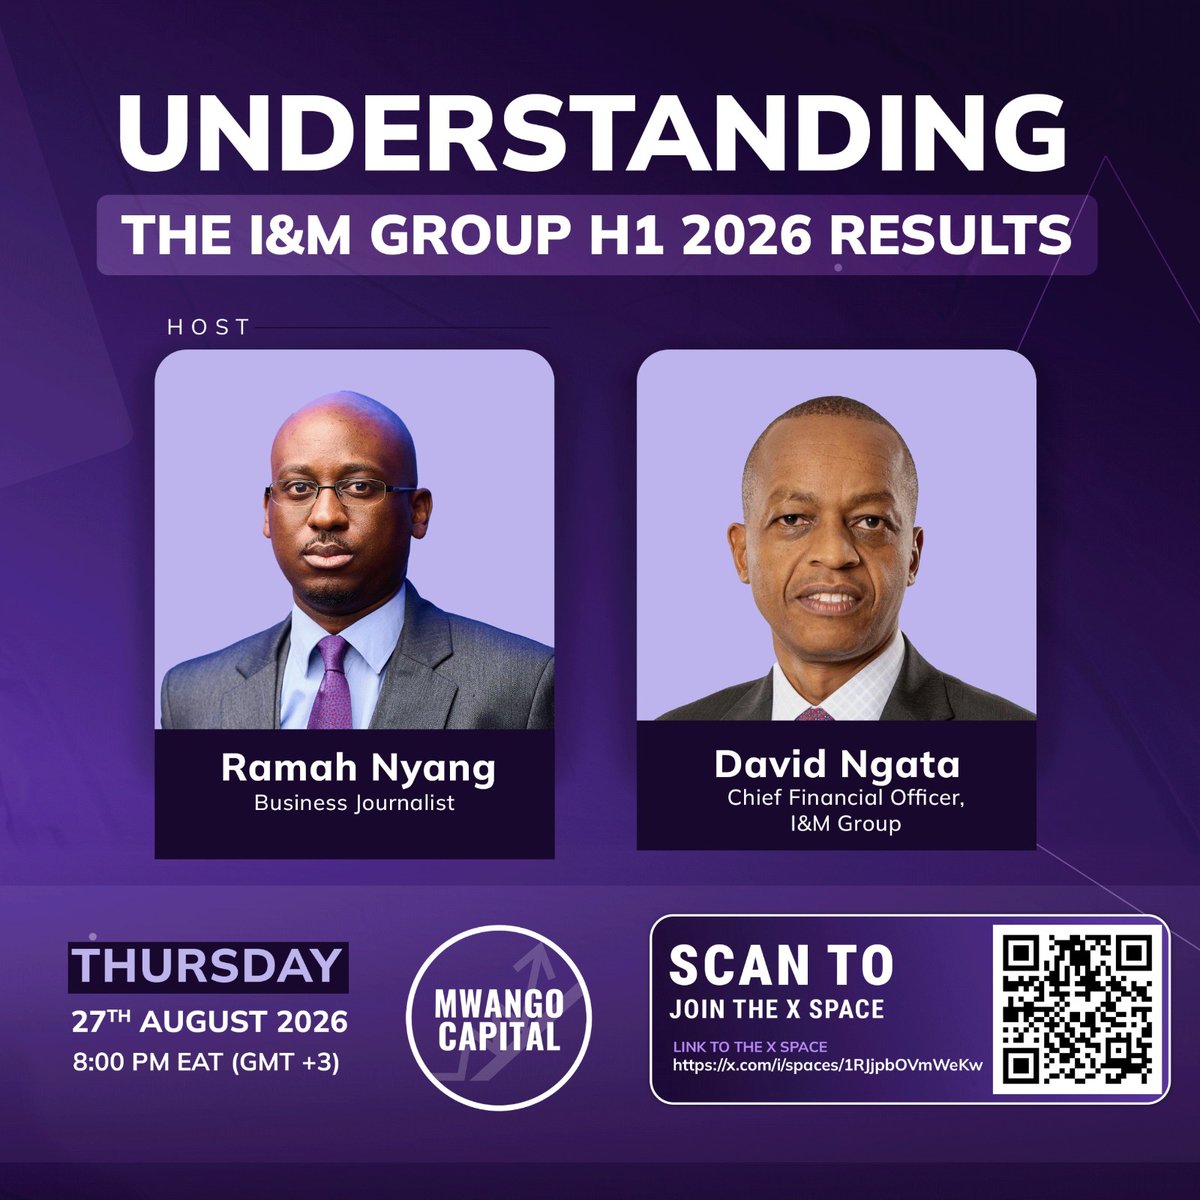
Don’t forget to join us today on #MwangoSpaces as we unpack I&M Group’s H1 2026 results, performance and outlook, with David Ngata, CFO, I&M Group.
Set a reminder and join the conversation: https://t.co/XcoerpJi16
Kuwakumbusha tu.
Linda Mwananchi will implement the Constitution.
Sifuna's agenda ndio hii:
1. Protecting human rights.
2. Promoting equality.
3. Safeguarding freedom.
4. Strengthening democracy.
5. Advancing social justice.
6. Upholding the rule of law.
#Sifuna4President


![MwangoCapital's tweet photo. Limuru Tea H1 2026 Results [KES, YoY]:
— Revenue: +23.0% to 69.9M
— Pre-tax loss: 21.1M [H1 25: 22.2M loss]
— Net loss: 21.1M [H1 25: 22.2M loss]
— EPS: -8.81 [H1 25: -9.25]
— Cash & Cash Equivalents: +9.4% to 8.3M
— Total Equity: -28.6% to 109.2M
— Interim Dividend: Nil
Commentary: Made tea volumes increased 14% to 492 tonnes from 2,212 tonnes of green leaf produced, while relatively stable tea prices supported the narrower pre-tax loss. Management said rising labour costs continued to push production costs higher, with tea prices softening towards the end of H1 as market conditions weakened.](https://pbs.twimg.com/media/HQvS0jybcAAmRUI.jpg)





![MwangoCapital's tweet photo. CIC Insurance Group H1 2026 Results [KES, YoY]:
— Insurance Revenue: +17.8% to 16.34B
— Insurance Service Result: -67.2% to 42.0M
— Investment Return: +43.9% to 3.96B
— Net Investment Result: +11.1% to 1.68B
— Asset Management Revenue: +25.2% to 1.04B
— Operating Profit: +20.6% to 1.85B
— Profit Before Tax: +30.2% to 1.56B
— Profit After Tax: +70.3% to 1.09B
— EPS: +65.2% to 0.38
— Total Assets: +10.8% to 81.68B
— Total Equity: +4.6% to 12.40B
Summary: CIC Insurance Group's H1 2026 profit after tax jumped 70.3% to KES 1.09B despite insurance service result collapsing 67.2% to 42.0M, as strong investment returns (+43.9% to 3.96B) and a 25.2% rise in asset management revenue carried the bottom line. Total assets grew 10.8% to 81.68B and EPS rose 65.2% to 0.38, though the underwriting weakness signals the growth is coming more from investment income than core insurance operations.](https://pbs.twimg.com/media/HQvTqtqaYAAvLuv.jpg)
![MwangoCapital's tweet photo. Nairobi Securities Exchange (NSE) H1 2026 Results [KES, YoY]:
— Total Income: +136.6% to 1.21B
— Equity Transaction Levy: +475.6% to 770.5M
— Bond Transaction Levy: +22.4% to 187.3M
— Data Income: +29.4% to 75.3M
— Total Operating Expenses: -0.1% to 309.7M
— Profit Before Tax: +396.0% to 1.01B
— Profit After Tax: +386.1% to 736.9M
— Total Assets: +57.5% to 3.62B
— Total Equity: +39.5% to 2.87B
— EPS: 2.82 [H1 25: 0.58]
— Interim Dividend: Nil
Summary: The NSE’s H1 2026 profit after tax rose 386.1% to KES 736.9M as total income increased 136.6% to KES 1.21B, driven by a 475.6% jump in equity transaction levy income to KES 770.5M. Profit before tax increased 396.0% to KES 1.01B, while operating expenses remained broadly flat at KES 309.7M & EPS rose 386.2% to KES 2.82.](https://pbs.twimg.com/media/HQvRSlnbMAABv3p.jpg)
![MwangoCapital's tweet photo. Limuru Tea H1 2026 Results [KES, YoY]:
— Revenue: +23.0% to 69.9M
— Pre-tax loss: 21.1M [H1 25: 22.2M loss]
— Net loss: 21.1M [H1 25: 22.2M loss]
— EPS: -8.81 [H1 25: -9.25]
— Cash & Cash Equivalents: +9.4% to 8.3M
— Total Equity: -28.6% to 109.2M
— Interim Dividend: Nil
Commentary: Made tea volumes increased 14% to 492 tonnes from 2,212 tonnes of green leaf produced, while relatively stable tea prices supported the narrower pre-tax loss. Management said rising labour costs continued to push production costs higher, with tea prices softening towards the end of H1 as market conditions weakened.](https://pbs.twimg.com/media/HQvS0yUaYAALjSE.jpg)