Top 25 #Stata Commonly used Visualizations with full replication code is now up!
Link:
https://t.co/QU8x3kHd5g
#Stataviz#Dataviz#TheStataGallery#visualization
Do press clap at the bottom of website if you like and want more such posts.
Preview of some graphs below 👇
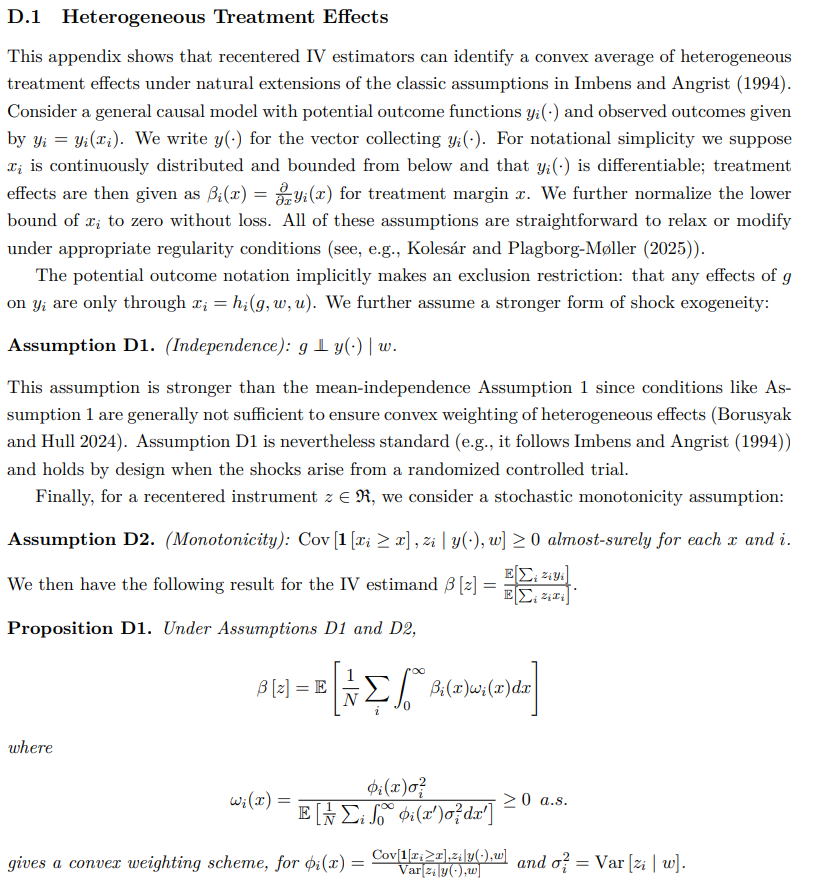
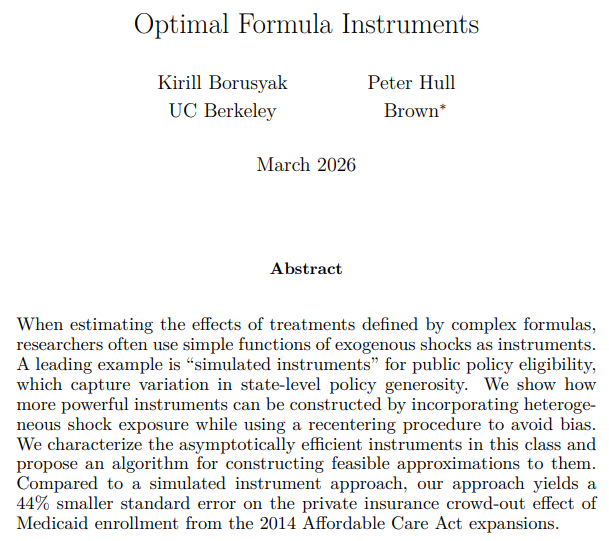
Kirill and I have revised this paper with the help of some nice referee comments. Big additions include:
1. Results on the general interpretation of recentered formula IV estimands with heterogeneous effects
2. Conditions for the asymptotic efficiency of a nonparametric split-sample estimator
Enjoy!
I'd like to announce that drlate, a Stata module for doubly robust estimation of the local average treatment effect (LATE) and the local average treatment effect on the treated (LATT), is now available in SSC.
👋 Happening in 1 week: my data visualization seminar with Instats!
If you or your students use @Stata and want to up your graph game, this is designed for you. June 8 and 9, 10am-2pm Eastern. Link 👇
@CDAthecapital this is probably the only way to get attention these days unless there is another channel? But trash collection is becoming a problem even though a while back the admin did a decent job. Is CDA occupied with cleaning for delegation in #Islamabad only now?
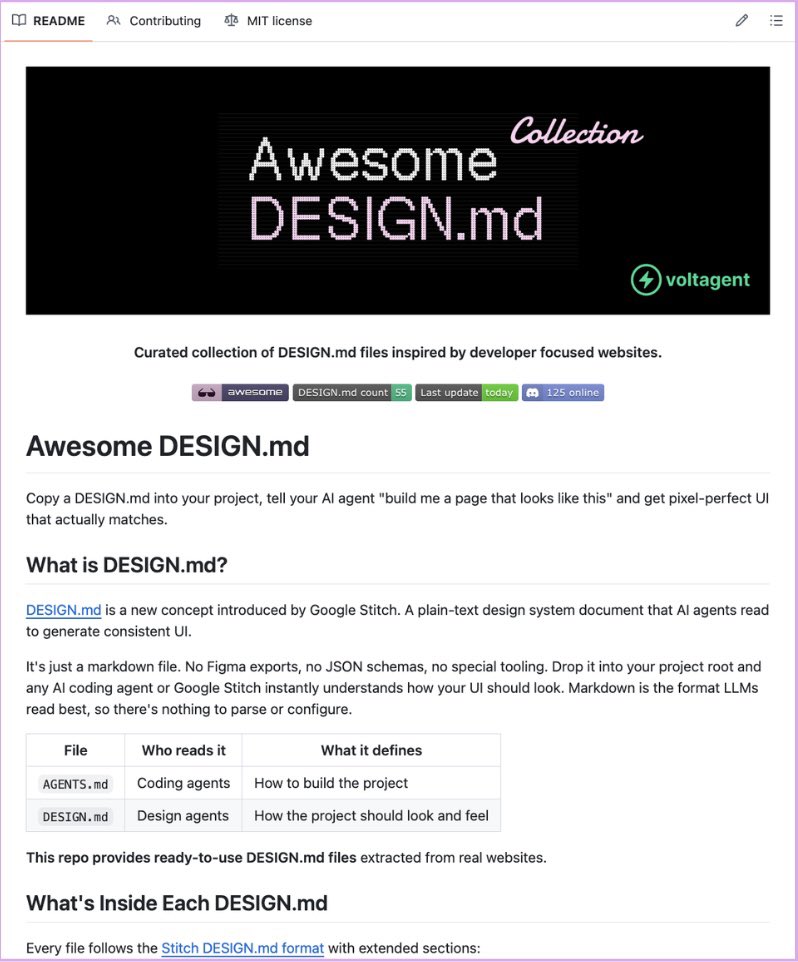
Google Stitch has released 𝗗𝗘𝗦𝗜𝗚𝗡.𝗺𝗱 🤯
One markdown file that teaches your AI coding agent your entire design system.
→ No Figma exports
→ No JSON schemas
→ Nothing to configure
The part that saves the most time:
A free collection of 40+ pre-built files already exists, extracted from real products. Stripe, Vercel, Linear, Notion, Lovable, Claude, ElevenLabs, Cursor, Warp, Zapier, and more.
Drop it in your project root. Claude Code, Cursor, Gemini CLI, and GitHub Copilot all read it natively.
100% Free and Open-Source.
🚀 @Stata package #vcontrol v1.0, for version control, is now official released on #GitHub and #SSC.
⚠️ The default options are currently for my own packages but it can be extended to other online or local paths for checking for installation.
https://t.co/LwnQGcqTW3
👇
Exploring treatment-effect heterogeneity in Stata?
@friosavila compares the new 𝗰𝗮𝘁𝗲 command in Stata 19 with standard tools like 𝗿𝗲𝗴𝗿𝗲𝘀𝘀 and 𝗺𝗮𝗿𝗴𝗶𝗻𝘀 to estimate CATE, CATT, and GATE in this community corner.
Read more: https://t.co/WF2dlV3IRp
The package itself takes inspiration of work from @AsjadNaqvi who showed the #Stata community how it is possible to make many other plots than the standard ones. The idea is to add interactivity so that users engaging with non-technical audience can benefit best
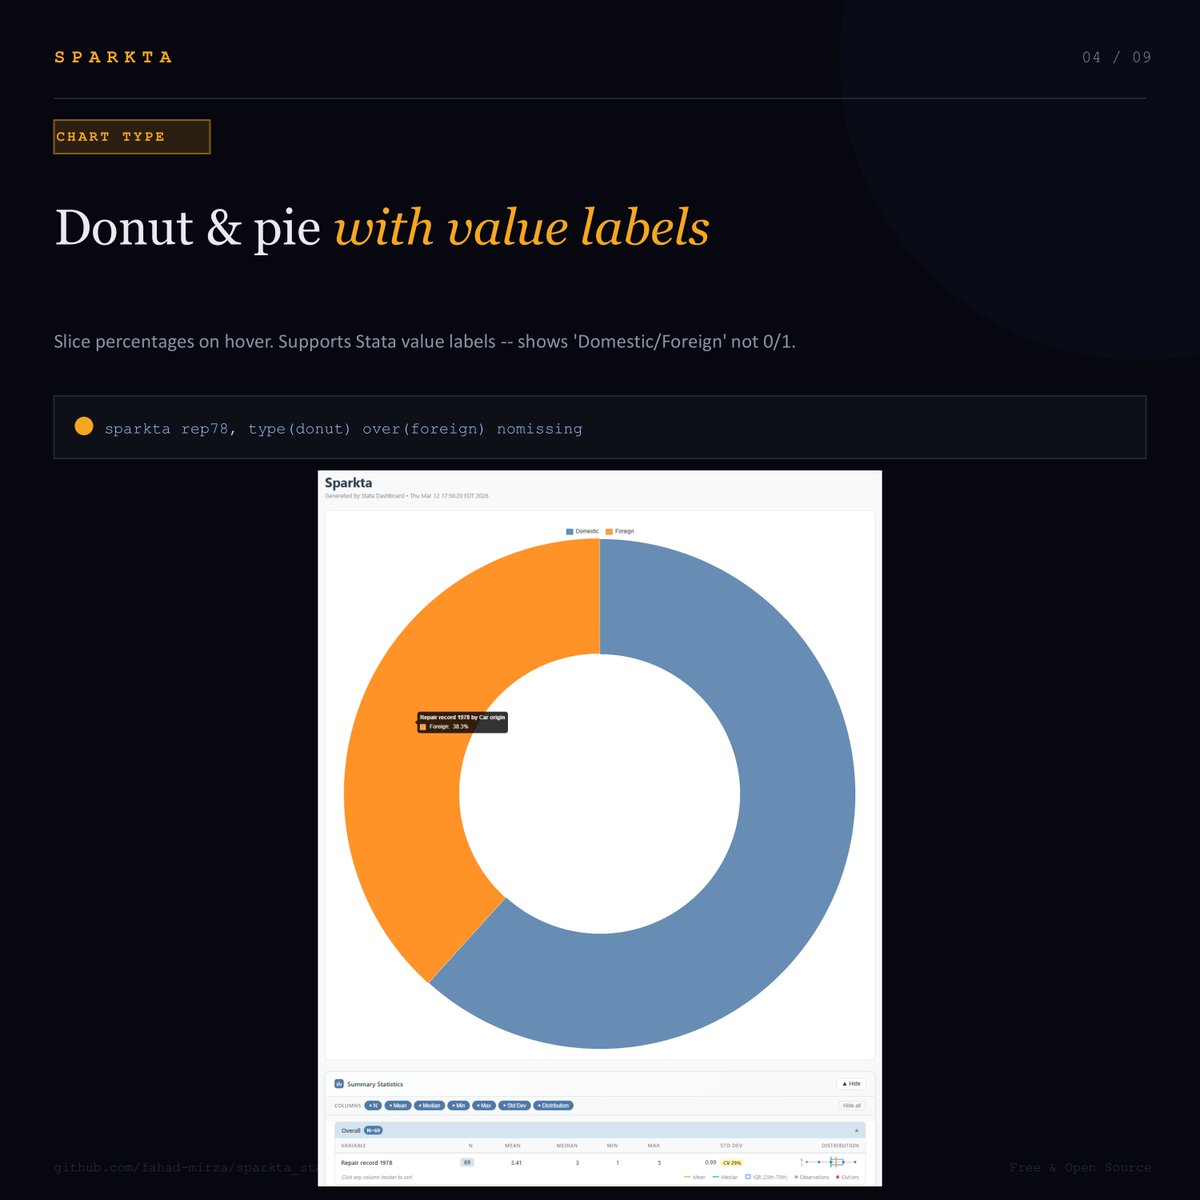
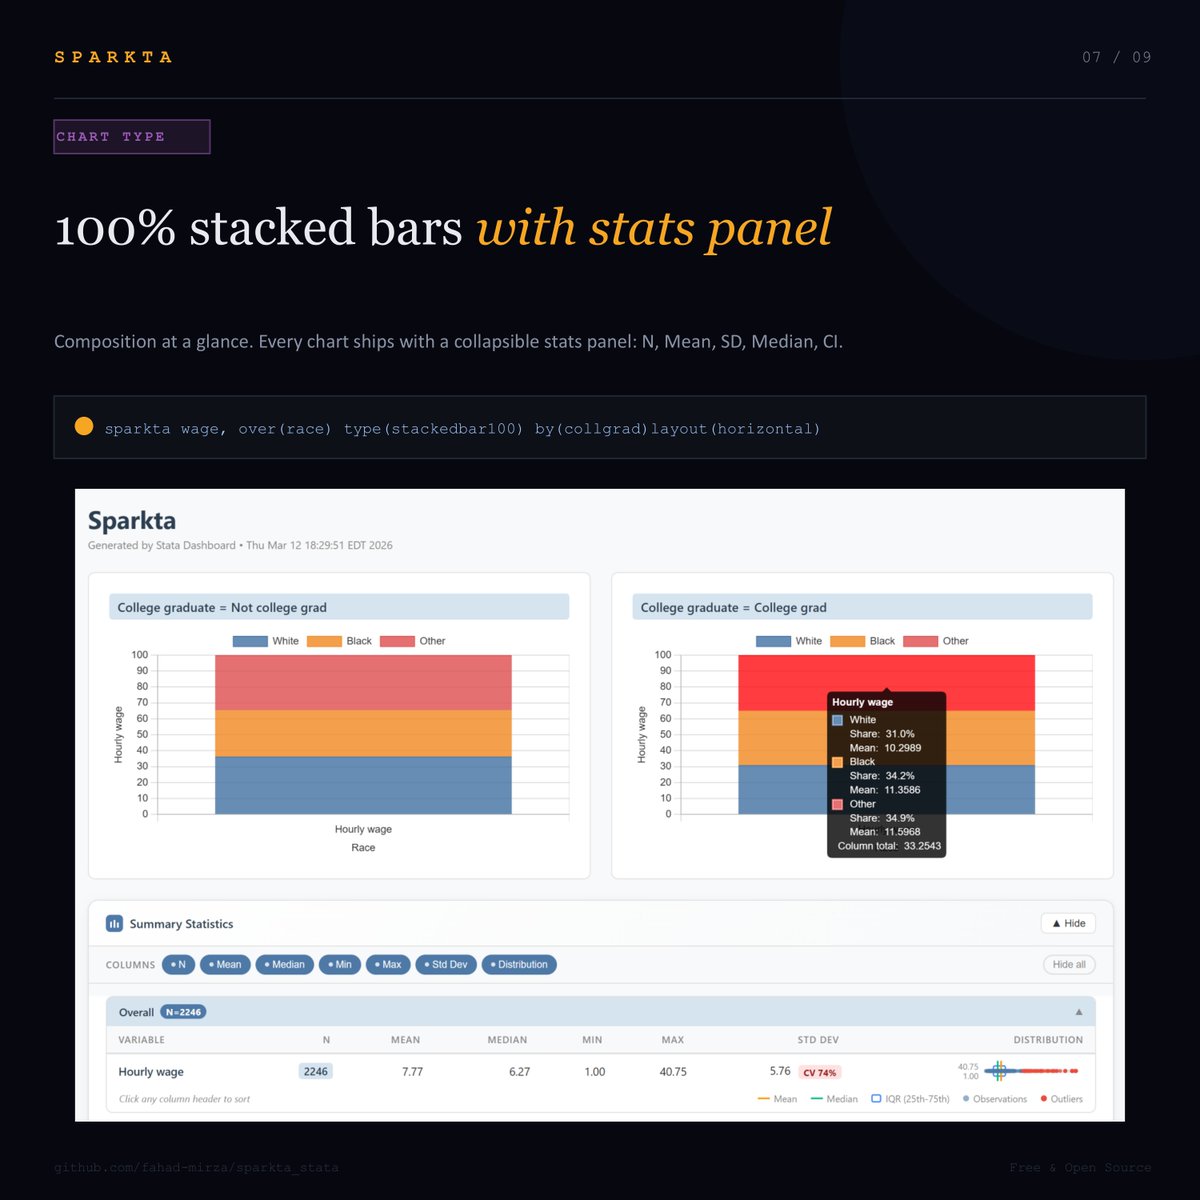
Introducing sparkta — interactive, self-contained HTML charts and dashboards directly from #Stata. One command. Zero dependencies. No Python. No R. No server.
net install sparkta, from("https://t.co/dfAsPon6jD")
#econtwitter#dataviz#datascience#visualization#stataviz
1. CI bars matching ci means exactly
2. Violin plots with animated KDE density
3. Stacked bar/area/line
4. Scatter, bubble, donut, histogram, boxplot
And live filter dropdowns — no server needed.
Results from my Claude Code audit of six Callaway and Sant'Anna packages (two in python, two in R, two in Stata). Same specification, same dataset, same covariates, same estimator, almost never do they agree.
https://t.co/KpRwlAagbr