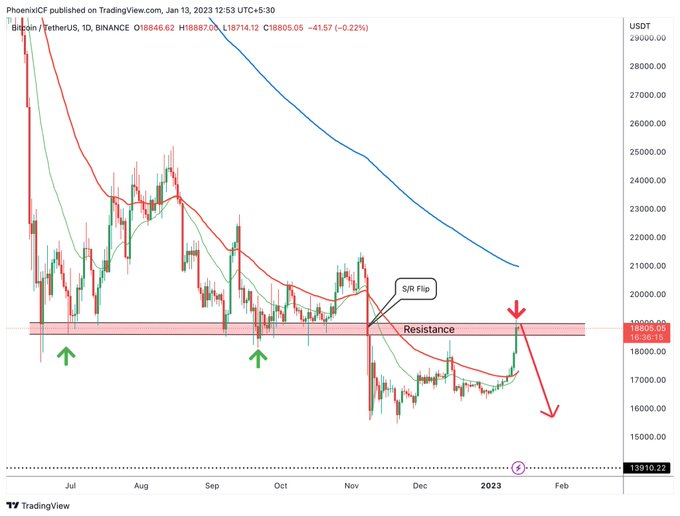
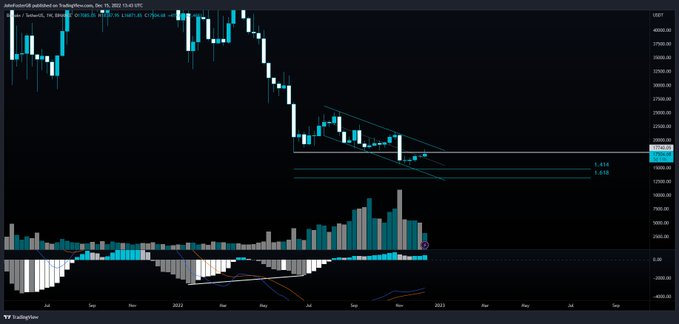
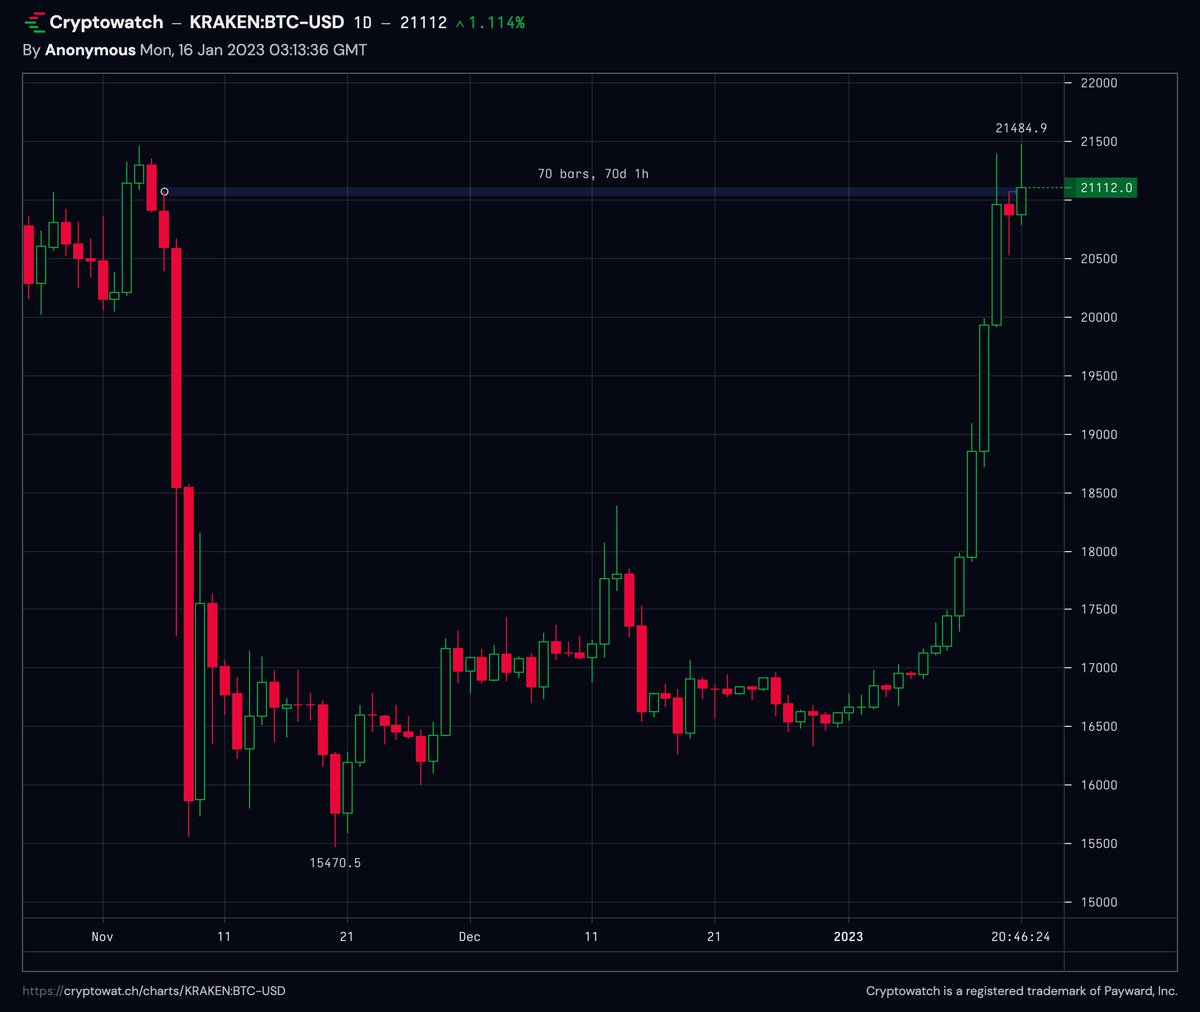
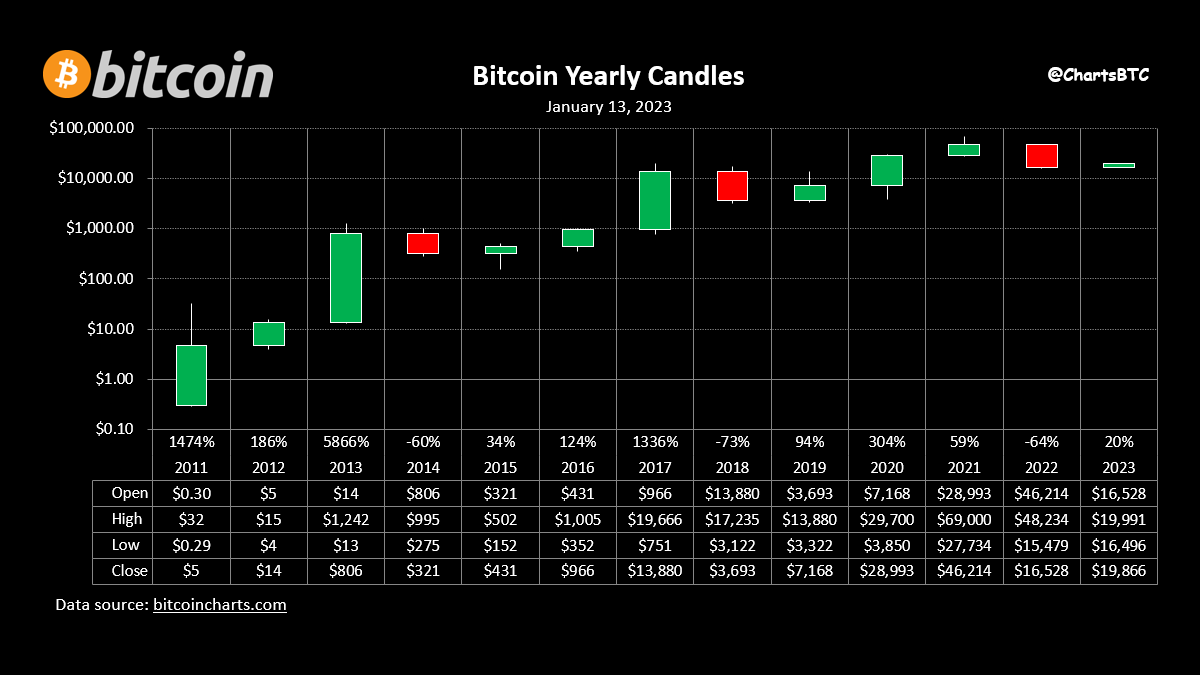
$BTC is testing a massive resistance zone on daily TF chart and I believe the bull trap will end here.
A candle close above 19500 will be a bullish sign and this resistance will be considered as broken.
#TheGemHunter#BTC#USD#BNB#Binance#Crypto
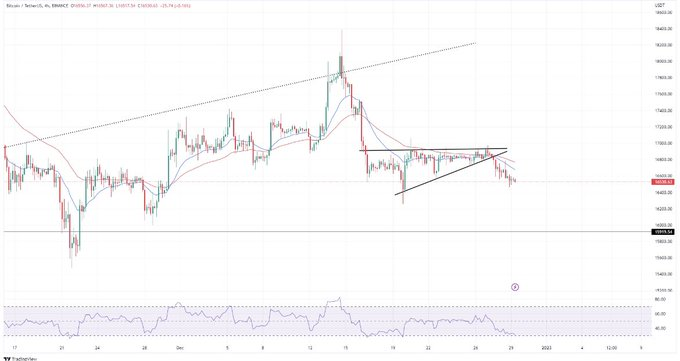
$BTC chart !
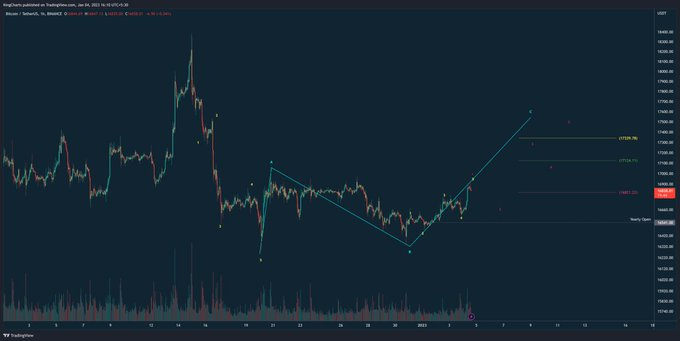
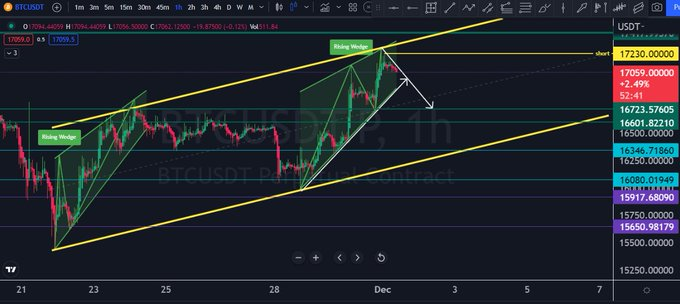
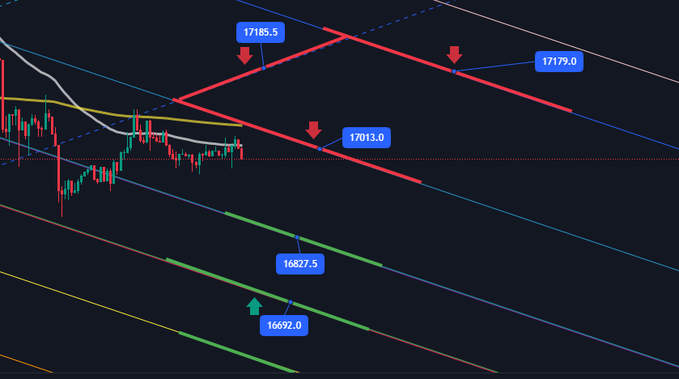
#BTC has shown rejection from$16,900, with a support price of $16,650 - $16,500
If market holds $16,500 Hold, we can see market testing @ $17,300-17,500 target
#TheGemHunter#BTC#USD#BNB#Binance#Crypto
Analyst Says Bitcoin Christmas Rally Imminent, Says This Chart Is One of the Most Impressive Out There
https://t.co/uKlUa5MmtJ
#TheGemHunter#BTC#USD#BNB#Binance#Crypto
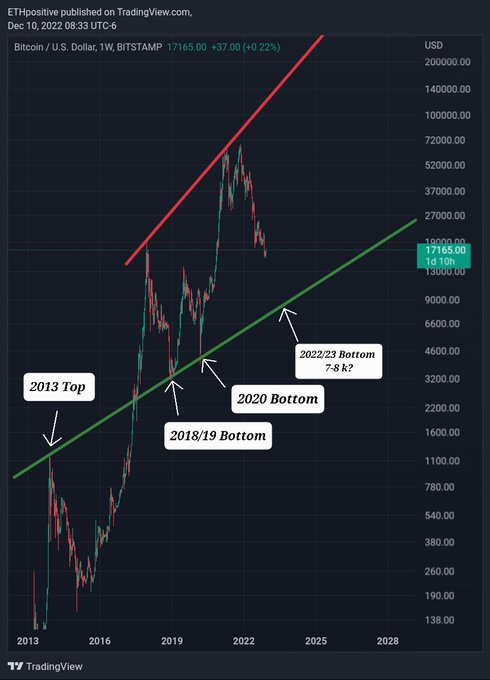
The most important trendline for $BTC? 2013 top, 2018/19 bottom and 2020 bottom all tested that same trendline, following the same trend would put BTC's 2022/23 bottom at 7-8 k.
#Bitcoin Chart :
#TheGemHunter#BTC#BNB#BSC#crypto#Crypto