Keen to learn more about the markets? Join my free WhatsApp group, where I share insights and review members’ stock picks every day.
WhatsApp:
https://t.co/aUXk6wigsI
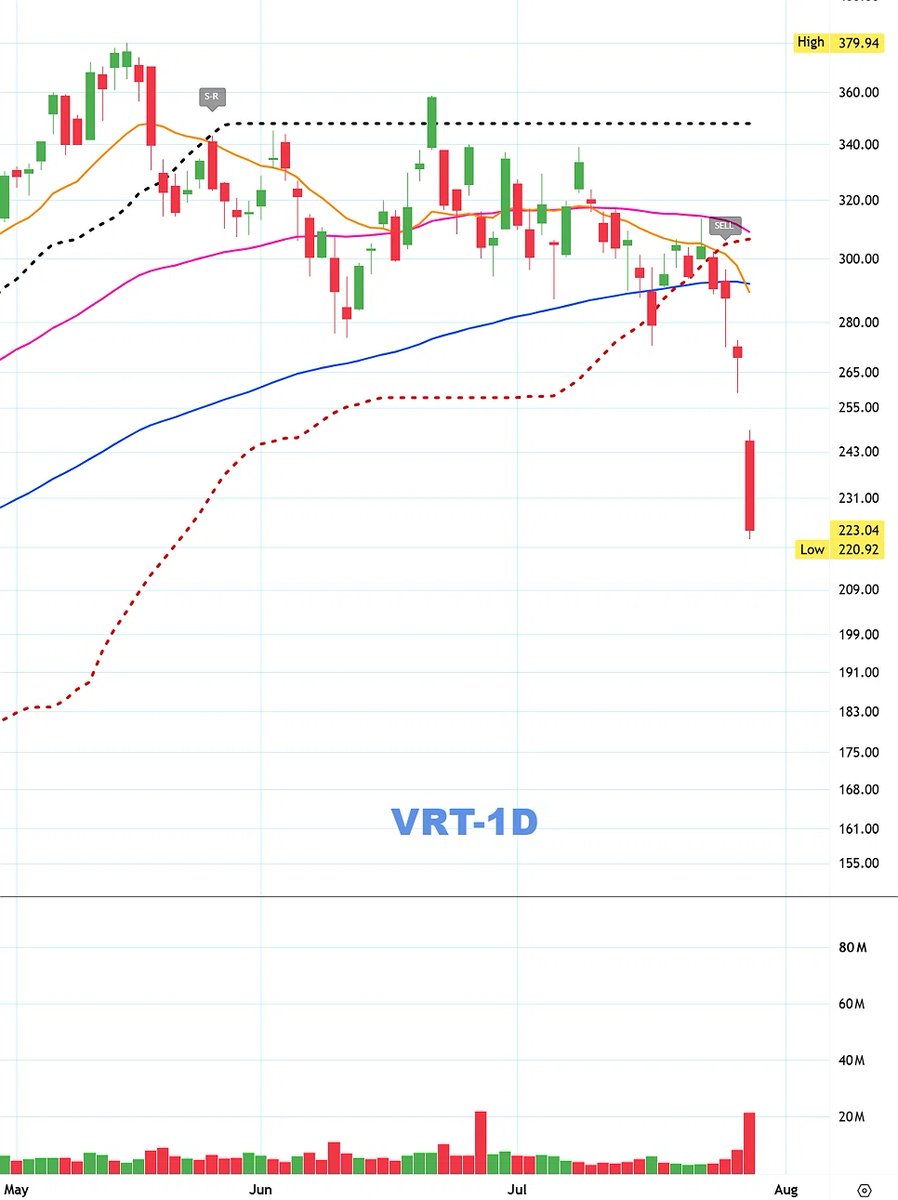
VRT (US-listed stock) — Bearish continuation call played out, with every downside target reached
Previous analysis:
In our 27 July analysis, we clearly stated:
“VRT is consolidating weakly within the US$290–315 range. Trading volume has dried up, rebound attempts lack conviction, and the setup resembles a classic bearish continuation pattern.”
The strategy was to consider a short position near US$315, with an initial target of US$275 and a second target between US$230 and US$250.
On 29 July, the share price fell to a fresh swing low of US$220.92 before closing at US$223.04. Both the first target at US$275 and the second target zone of US$230–250 were fully reached.
So far, the original bearish call has played out as expected.
Current technical setup:
VRT closed at US$223.04 on 29 July, after reaching an intraday low of US$220.92 and setting another low for the current decline.
The bearish trend remains firmly in place.
Traders already holding short positions may continue to hold, while moving the profit-protection level down to US$249. Alternatively, profits could be taken manually near US$210.
Those without a position should remain on the sidelines. No new trade is recommended at the current price.
Fundamentals and news:
Vertiv is a leading provider of data-centre power and cooling infrastructure. The company has benefited from the global AI data-centre build-out, with its share price delivering a strong rally from the beginning of the year through to its May high.
The recent decline mainly reflects a correction from elevated valuations and forced selling from leveraged positions. There has been no major change to the company’s underlying fundamentals.
Vertiv is due to release its second-quarter result after the market closes on 29 July, which could trigger further volatility.
Key levels — USD:
Current price: US$223.04
Trailing profit-protection level: US$249 for existing short positions
Manual profit-taking area: Around US$210
No position: Stay on the sidelines; no trade recommended
Keen to learn more about the markets? Join my free WhatsApp group, where I share insights and review members’ stock picks every day.
WhatsApp:
https://t.co/Vg1rVMi84c
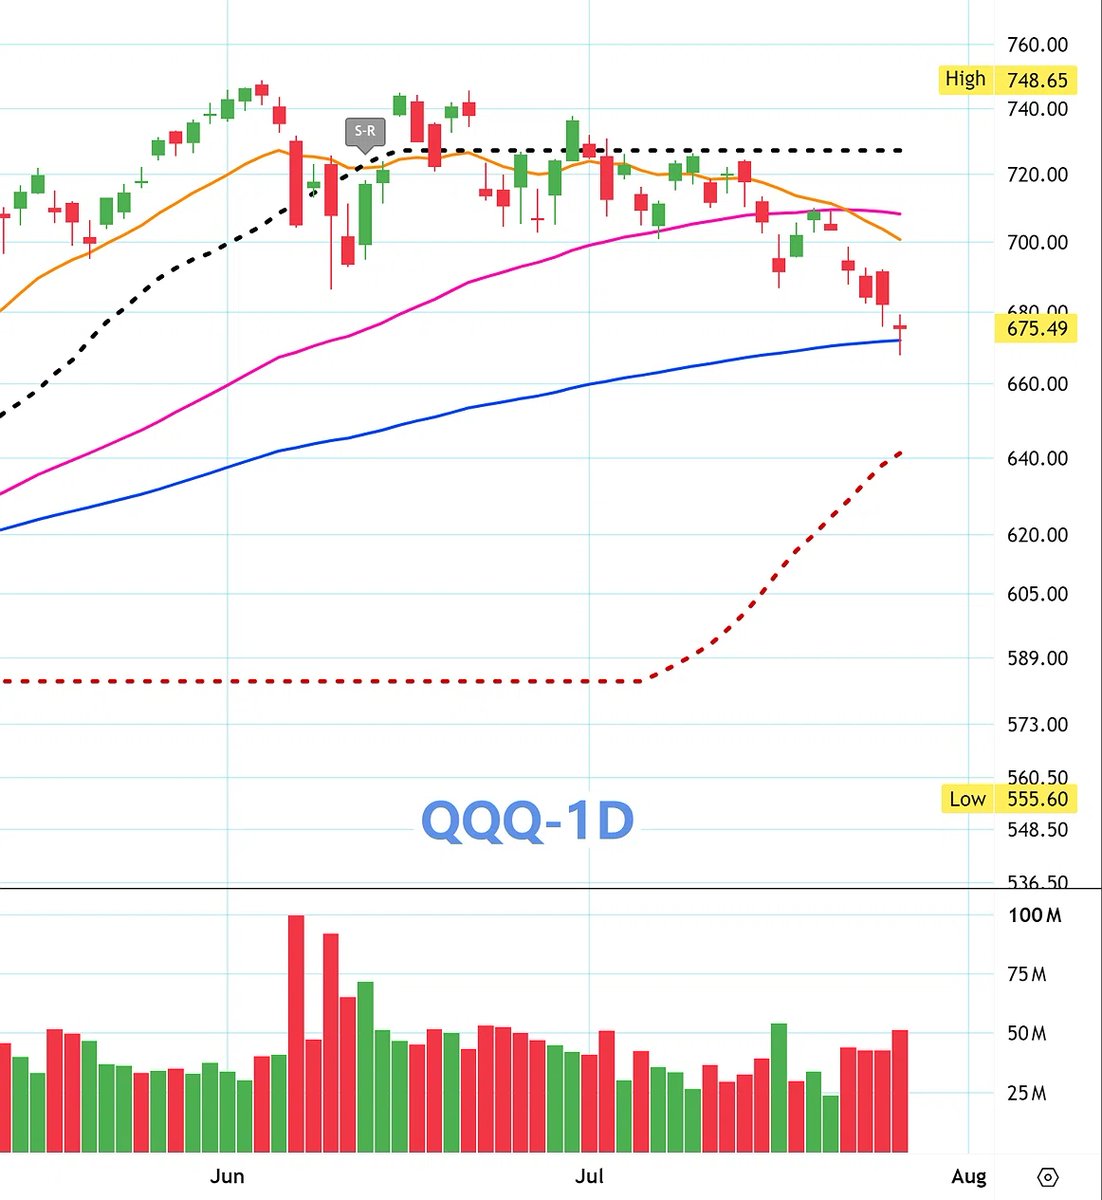
QQQ (US-listed ETF) — Doji forms after testing long-term support, with a short-term rebound beginning to take shape
QQQ closed at US$682.12 on 28 July, down 0.31%. During the session, the price tested its long-term trendline and found support before finishing with a doji candle — an early sign that the short-term decline may be losing momentum.
Technical setup:
Sellers remain in control in the near term, but the key level to watch is the long-term trendline near US$666.25, which is providing support below the current price.
The doji on 28 July, together with the intraday rebound from the low, suggests there is genuine buying interest around this support zone. If QQQ can stabilise here, a technical rebound may begin to develop.
Heavy resistance overhead:
The short-term moving averages are still sitting above the price and acting as resistance:
9-day EMA: around US$697
21-day EMA: around US$706
Elliott Wave analysis identifies US$737.72 as the key short-term pivot. Until that level is reclaimed, the broader technical structure remains bearish.
Initial resistance sits around US$683–686, followed by US$697 at the 9-day EMA and US$706 at the 21-day EMA.
Support structure below:
The long-term trendline near US$666 remains the most important level to monitor.
A confirmed break below it would expose the next potential support zone between US$646 and US$684, where several Fibonacci extension levels are clustered.
Further down, stronger support is located near US$648, close to the 200-day EMA.
Trading approach:
The doji is only an early sign of stabilisation, so confirmation is still required. A rebound trade should only be considered if the following session holds above the recent low and produces a bullish candle on stronger volume.
Initial rebound targets:
US$697 at the 9-day EMA
US$706 at the 21-day EMA
If the rebound loses momentum around these levels, taking profits would be the more cautious approach.
A confirmed break below the long-term trendline near US$666 would invalidate the bullish rebound setup.
Key levels — USD:
Current price: US$682.12
Long-term trendline support: around US$666
Short-term resistance: US$686–697
Major resistance: US$706
If US$666 breaks: next support near US$646
Keen to learn more about the markets? Join my free WhatsApp group, where I share insights and review members’ stock picks every day.
WhatsApp:
https://t.co/Vg1rVMi84c
INTC (Intel) — Bearish moving-average alignment, with the long-term trendline under pressure
Previous analysis:
In our 26 July analysis, we identified the long-term trendline near US$88.45 as the key support level. A confirmed break below it would increase the risk of a further decline towards the US$65–67.50 area.
On 27 July, INTC briefly fell below that level, reaching an intraday low of US$86.94. Although the shares recovered to close at US$91.67, the breakdown attempt is a clear warning sign.
Current technical setup:
INTC closed at US$91.67 on 27 July. The intraday low of US$86.94 broke below the long-term trendline at US$88.66 before the stock recovered late in the session, leaving a long lower wick.
Since reaching a high of US$142.35 on 30 June, the share price has fallen by around 35.6%. The downtrend remains firmly in place, with no confirmed signs of stabilisation so far.
The current price of US$91.67 sits below the short-term resistance at US$102.30, the medium-term resistance at US$110.37 and the upper channel boundary at US$128.52. This is a clearly bearish structure.
Any rebound at this stage should be treated as a corrective bounce rather than a confirmed trend reversal.
The long-term trendline at US$88.66 is now the most important dividing line between bulls and bears. Holding above it would give the stock some breathing room. A confirmed break below it would shift the broader outlook decisively bearish, with the next major support near the lower channel boundary at US$67.61.
Fundamentals and news:
Intel has a market capitalisation of approximately US$460.7 billion and annual revenue of around US$57.03 billion.
The company is currently loss-making, with earnings per share of negative US$2.12, meaning a conventional price-to-earnings valuation is not applicable.
Heavy capital expenditure and ongoing operating losses in Intel’s foundry business remain the main pressures on its financial position.
Key developments to watch include progress on the 18A manufacturing process, new foundry customers, changes in analyst ratings and the timing of funding under the CHIPS Act.
Key levels — USD:
Upper channel resistance: US$128.52
Medium-term resistance: US$110.37
Short-term resistance: US$102.30
Long-term trendline support: US$88.66, the key bull-bear dividing line
Lower channel support: US$67.61
Trading approach:
Those without a position should remain on the sidelines and wait for a clear reaction around US$88.66.
If the stock stabilises near US$88.66 on lighter volume, a small short-term rebound trade could be considered, targeting the US$102 area.
If the daily close confirms a break below US$88.66, the bullish case should be abandoned.
Opening a short position at the current price is not recommended.
PLTR (Palantir Technologies Inc.) — A base is gradually forming; wait for breakout confirmation
Technical setup:
PLTR closed at US$131.53 on 27 July, up around 7% for the day, with trading volume increasing moderately.
Since its June low of US$106.37, the stock has rebounded by approximately 23.6%, with a clear pattern of progressively higher lows. The share price is now testing short-term resistance near US$132. A sustained move above this level would confirm a short-term bullish structure.
Previous coverage:
This is our first analysis of PLTR, so there is no previous trading record to review.
Fundamentals and news:
Palantir is due to report its second-quarter results after the market closes on 3 August.
On 27 July, Oppenheimer analyst Param Singh reiterated an “Outperform” rating and a US$200 price target. He expects second-quarter revenue growth of around 85% year on year, well above the midpoint of the company’s guidance at 79%.
He also expects Palantir to lift its full-year revenue growth outlook from 71% to above 75%.
Wall Street’s consensus forecast is for second-quarter revenue of US$1.81 billion, representing growth of 81% year on year, with adjusted earnings per share of US$0.35.
Bull versus bear debate:
According to S&P Global, the consensus rating among 32 analysts is “Buy”, with an average price target of US$182.20.
Citi reiterated its “Buy/High Risk” rating but lowered its price target from US$225 to US$200. DA Davidson raised its target to US$175.
However, well-known bearish investor Michael Burry has reportedly continued adding to his short position in PLTR ahead of the earnings result.
Valuation remains the main source of disagreement. PLTR is still trading at more than 100 times forward earnings and roughly 65 times sales, leaving the stock highly sensitive to any disappointment.
Analyst views:
The average analyst target of US$182.20 implies potential upside of around 38.5%.
Oppenheimer and Citi both have targets of US$200, while DA Davidson is targeting US$175. The range of forecasts remains extremely wide, with the lowest target sitting at just US$70.
Key levels — USD:
Base support zone: US$122–126
Short-term resistance: US$132, the breakout confirmation level
First target: US$143
Second target: US$163
Aggressive entry: Around the current price near US$131.50
Conservative entry: US$122–126, provided the support zone holds
Condition for adding to long positions: A sustained move above US$132
Stop-loss: US$120
Trading approach:
Aggressive traders may consider a small long position near the current price, then add only after PLTR breaks above US$132 and holds that level.
More conservative investors may prefer to wait for a pullback into the US$122–126 support zone, provided that area remains intact.
Volatility could increase sharply ahead of the earnings announcement, so position sizing should remain controlled.
Market opportunities aren’t for everyone. By the time everyone is talking about the same opportunity, chances are you’re no longer early.
That’s why I prefer to share my market notes first with our Australian investing community.
Each day, I put together the shares on my watchlist, market sentiment, key news and any potential risk signals worth keeping an eye on.
Join us and help build a stronger, better-informed investing community here in Australia.
You can join my WhatsApp group through the link in my bio.
Why do so few people leave the group? Because I don’t charge commissions, there are no membership fees and there are no hidden catches.
Still unsure? Join for a few days and have a look around. See whether the shares and market themes I mention start to play out over time.
Everything is free, transparent and open. You’ve got nothing to lose.
VRT (Vertiv Holdings) — Weak consolidation near the highs, with a strong chance of another leg lower
VRT closed at US$290.36 on 24 July, down around 23.6% from its 52-week high of US$379.94 reached on 14 May. The share price is now drifting sideways within the US$290–315 range. Trading volume has dried up and rebound attempts have lacked conviction, creating a classic bearish continuation pattern.
Company overview:
Vertiv was formerly Emerson Electric’s network power division before being spun off as an independent company in 2016. The business specialises in critical digital infrastructure, including data-centre power systems, cooling equipment, server racks and integrated solutions.
The company has benefited strongly from the global build-out of AI data centres. At one stage this year, the share price had surged more than 89%, making VRT one of the market’s most popular AI infrastructure plays.
What has driven the recent decline?
Profit-taking after a major valuation run-up:
VRT delivered an extraordinary rally from its 2025 low to its May peak of US$379.94. Investors have since been taking profits and reducing exposure to highly valued AI-related stocks. On 17 July, the stock fell as much as 6.5% intraday to around US$275.
Margin-call selling:
Jim Cramer, host of CNBC’s Mad Money, said VRT is currently “in the hands of speculative money”, with leveraged investors being forced to sell. In his view, the decline is being driven by margin calls rather than a deterioration in the company’s underlying fundamentals. He suggested waiting for a more attractive entry price.
Cooling sentiment across the AI infrastructure sector:
Other AI infrastructure beneficiaries, including Vicor, Eaton and nVent Electric, have also moved lower, reflecting weaker sentiment across the broader AI electrical equipment and data-centre infrastructure theme.
Fundamentals and potential catalysts:
First-quarter revenue increased 30% year on year, while organic sales rose 23%.
Adjusted operating margin expanded by 430 basis points, and free cash flow more than doubled.
The order backlog reached US$15 billion, up 109% from the previous year.
Management has upgraded its full-year 2026 outlook, forecasting revenue of US$13.5–14.0 billion and organic sales growth of 29–31%.
Vertiv is due to report its second-quarter results after the market closes on Wednesday, 29 July. The market expects revenue of approximately US$3.38–3.39 billion, representing year-on-year growth of around 28%, with earnings per share of roughly US$1.42–1.43.
The company recently completed its acquisition of ThermoKey, strengthening its thermal management portfolio.
A new facility in Malaysia has begun operations, expanding manufacturing capacity across Asia. Vertiv is also increasing production at its Italian plant, with chiller capacity expected to double by the end of 2026.
Analyst views:
According to an S&P Global survey of 28 analysts, the consensus rating is “Strong Buy”, with an average price target of US$376.15.
A separate group of 32 analysts has an average target of US$380.72. Individual targets range from US$236 to US$500, highlighting a wide divide between bullish and bearish expectations.
Bernstein initiated coverage in June with an “Outperform” rating and a US$416 price target.
With the stock currently trading near US$290, the average analyst target still implies potential upside of around 30%.
Key levels — USD:
Short-entry zone: Around US$315, provided the rebound fails
First downside target: US$275
Second downside target: US$230–250
Stop-loss: US$340; a sustained move above this level would invalidate the bearish structure
The second-quarter result due after market close on 29 July is the biggest immediate uncertainty. Unless a fresh positive catalyst pushes the stock above resistance, the weak consolidation pattern is likely to continue.