AMD is now inside a long bearish stretch on the calendar. 🌧️
Week #24 is the second of a 7-week run.
The full stretch runs from week #23 through week #29.
Full-run average: -7.36%.
Positive only 30% of the time from start to finish since 1980.
Week #24 is SCHW's single weakest week of the year. The next weakest: #13 at -1.09%. ⛈️
Since 1987, it has closed positive only 34% of the time.
Mean return: -1.81%.
Week #24 is one of TDG's three weakest of the year - alongside #10 and #36. 🌧️
30% hit rate in week #24 since 2006. Mean: -1.33%.
The pattern is broad.
Week #24 is UAL's single weakest week of the year. The next weakest: #9 at -3.76%. ⛈️
30% hit rate since 2006. Mean -3.47%.
Recent sample: positive only 30% over the last 10 years.
It's not alone. 👇
Week #24 is WELL's single weakest week of the year. The next weakest: #33 at -0.72%. 🌧️
28% hit rate in week #24 since 1980.
Mean return: -0.83%.
Bottom of the calendar for WELL.
Week #24 is MAR's single weakest week of the year. The next weakest: #3 at -0.58%. ⛈️
Week #24 has been one of the worst weeks of the year for MAR too.
Positive only 35% of the time since 1998. Mean: -1.72%.
Worst week of the year.
UPS is stepping into a long bullish pocket on the calendar. ⛅
From week #24, there are 6 consecutive historically positive weeks left in the run.
The full stretch spans week #24 through week #29.
Full-run average: +2.89%.
Positive 81% of the time from start to finish since 1999.
LQD is now inside a long bullish stretch on the calendar. ⛅
Week #24 is the first of a 9-week run.
The full stretch runs from week #24 through week #32.
Full-run average: +1.81%.
Positive 83% of the time from start to finish since 2002.
It's not alone. 👇
FSLR is entering one of its longest bullish seasonal stretches of the year. ⛅
Week #24 is week 1 of a 7-week run of historically positive mean returns.
That stretch runs from week #24 through week #30.
Full-run average: +8.97%.
Positive 68% of the time from start to finish since 2006.
AMZN is heading into week 5 of a 10-week bullish streak on the calendar. ⛅
The full stretch runs from week #20 through week #29.
Full-run average: +12.37%.
Positive 79% of the time from start to finish since 1997.
2026 streak update as of Friday: DOWN -9.77% since it began 🌧️
ISRG is heading into week 5 of a 12-week bullish streak on the calendar. ⛅
The full stretch runs from week #20 through week #31.
Full-run average: +14.01%.
Positive 76% of the time from start to finish since 2000.
2026 streak update as of Friday: DOWN -6.22% since it began 🌧️
It's not alone. 👇
Week #24 is TXN's single weakest week of the year. The next weakest: #39 at -0.83%. 🌧️
33% hit rate in week #24 since 1972. Mean: -1.46%.
The pattern is broad.
Bottom of the calendar for TXN.
Week #24 is EBAY's single weakest week of the year. The next weakest: #52 at -0.41%. ⛈️
22% hit rate since 1998. Mean -1.99%.
Recent sample: positive only 10% over the last 10 years.
It's not alone. 👇
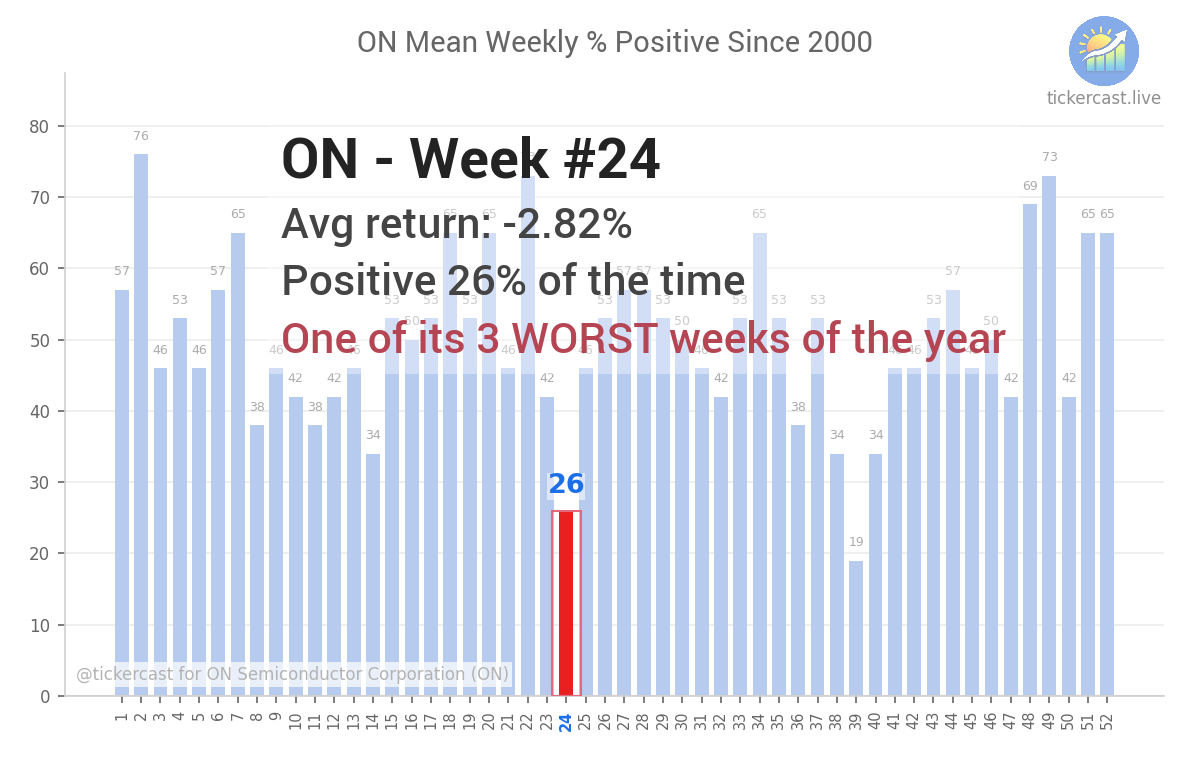
Week #24 is one of ON's three weakest of the year - alongside #39 and #14. ⛈️
Week #24 has been one of the worst weeks of the year for ON too.
Positive only 26% of the time since 2000. Mean: -2.82%.
Week #24 is IWM's single weakest week of the year. The next weakest: #39 at -0.91%. 🌧️
Week #24 mean: -1.00% since 2000. Positive only 38%.
Bottom of the calendar for IWM.
Week #24 is WDC's single weakest week of the year. The next weakest: #8 at -2.22%. ⛈️
21% hit rate since 1978. Mean -4.49%.
Recent sample is less bearish: positive 40% over the last 10 years.
It's not alone. 👇
Week #24 is LRCX's single weakest week of the year. The next weakest: #36 at -1.98%. ⛈️
Closed positive only 35% of the time since 1984.
Mean return: -2.04%.
Worst week of the year.
PGR's seasonal streak is NOT delivering so far 🌧️
More importantly: WHY is it DOWN -0.03% as of Friday during a historically bullish 19-week stretch while SPY is UP +6.98% over the same period?
Historically, the full 19-week stretch averages +14.34% and closes positive 76% of the time since 1980.
Three weeks remain, but this streak is already past the halfway mark.
SPGI was flagged as historically bullish in week #23 earlier this Monday ⛅
As of Thursday: DOWN -1.00% 🌧️
Currently trading inside its weekly expected move range.
Bucking the seasonal setup so far.