THIS BUBBLE IS WORSE THAN 2000
If you have money in the stock market, read this carefully.
The market is climbing while liquidity gets pulled out underneath it.
Now look at valuations.
Shiller CAPE: 42.05.
The only time it was higher was 1999, right before the dot-com crash.
Buffett Indicator: 229.9%.
In 2000, it was 146%.
That means today’s market is 1.6x higher than the dot-com peak by that metric.
Buffett is sitting on $325B in cash and selling stocks.
He is not guessing.
He is reading the same math.
Now concentration.
Top 10 stocks control 41% of the S&P 500.
They generate only 32% of profits.
In 2000, top concentration was 23%.
This is not a diversified index anymore.
It is a crowded bet on a handful of companies, and most of them are tied to the same AI story.
Now add leverage.
Margin debt hit $1.28T.
That is 4.1% of GDP.
In 2000, it was 2.7%.
Investors are borrowing more to buy stocks than they did at the dot-com peak.
And the reversal may have already started.
Margin debt peaked in January 2026 and dropped 4.5% in two months.
The S&P dropped 5.9% in the same window.
Last time margin debt rolled before the market?
2000.
2007.
Every time, the market followed.
Now look at AI.
In 2000, telecom companies spent billions building fiber for “the internet future.”
Capex hit 4.5% of GDP.
Today, hyperscalers are spending on data centers for “the AI future.”
Tech capex is 4.4% of GDP.
Almost the same number.
Back then, Lucent and Nortel helped finance customers who bought their equipment.
Today, Nvidia invests in companies that buy Nvidia chips.
Same loop. Different label.
In 2000, the bubble was internet infrastructure.
In 2026, it is AI infrastructure.
The companies are bigger now.
The spending is bigger.
The index concentration is worse.
The leverage is higher.
And the market is priced like the returns are already guaranteed.
That is the danger.
If one major earnings report shows AI spending is not paying off, the repricing starts.
And with 41% of the index sitting in the same trade, there is nowhere clean to hide.
That’s why I’m watching this situation very closely right now.
When the next move becomes clear, I’ll post it here first.
Follow and turn notifications on.
0.618 to 0.65, often referred to as the "golden pocket" is conveniently right where the 84k cme gap is located.
Would be the next spot to pay attention to on the upside.
Update on this.
It's getting worse.
The 200D MA breadth for the $SPX has now dropped to the 33 percentile, and the 50D MA breadth has dropped to the 34.8 percentile.
The net 52w high (10d ma) has also dropped below its neutral level and is now at the 49 percentile.
All while the index is near ATH's and grinding higher.
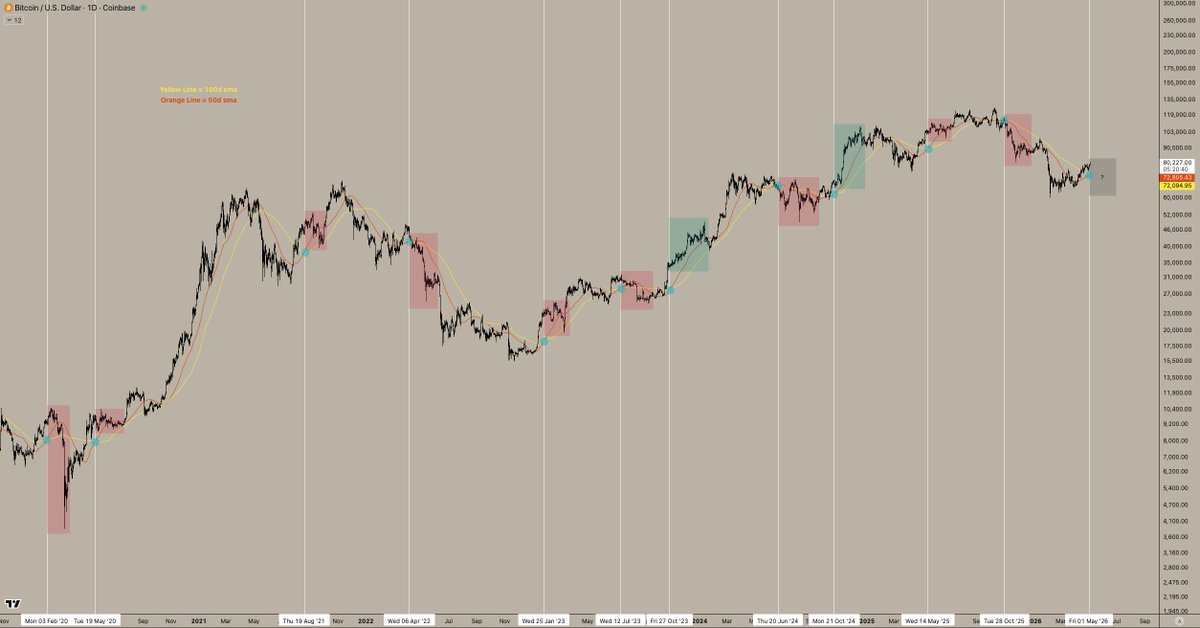
In the past 5.5 years, the 50 day sma has crossed above the 100 day sma exactly 12 times.
The most recent time was May 1st, 2026, just a few days ago. Out of the 12 crosses, 9 of them led to downside and 3 of them led to upside.
This would mean historically, out of a 5.5 year sample size, 75% of the time when the 50d sma crossed above the 100d sma, price experienced downside and 25% of the time price experienced upside.
Interestingly enough, on the times that $BTC experienced downside, we still typically saw a pump for a few days right after the cross, leading into a retrace of that entire move and further downside.
I mentioned this a few days ago but I'll say it again. The breadth on the $SPX is not good.
Market participation within the index is low which signals a fragile foundation.
As stated in the article below, "Yet the median stock in the index is still 13% below its own 52-week peak".
I know you may not want to hear this, but the news means nothing.
It's nothing more than merely a distraction meant to alter emotions, decisions, and execution within the markets. Does it impact short term price movements?
Sure.
But mid-long term moves?
Absolutely not.
The dynamics that the market has operated on for centuries has remained consistent up to this day. Human emotion has never changed, hence market dynamics never truly change.
The only way you succeed is by avoiding all the noise thats fed to you via the news, thinking on your own, and separating yourself from the average Joe, in terms of reading market conditions.
As price currently trends higher in both Bitcoin and equities, we are in something I call the "emotional zone". The crowd gets bullish, the targets begin to rise, the bearish opinions get made fun of.
I would urge you to remain objective.
Under the War Powers Resolution of 1973, President Trump’s authority to conduct unauthorized military operations against Iran is subject to a 60-day legal deadline, which expires on April 28, 2026. This could also be around the bottom for #Bitcoin. #BTC#Ethereum#Crypto #IranWar #Israel $BTC
#Ethereum is approaching a resistance trendline in place since the bear market began. It should collide with it around April 6th, which is also Trump’s current deadline for Iran. Eth is going down further in my opinion. #BTC $Bitcoin #Crypto#Trump#IranWar#Sol#DOGE
The $IGV correlation
Software and Bitcoin have evidently been correlated. For the first time since 2022, software has closed a weekly candle below its 200W SMA.
After falling below, it spent approximately 183 days before finding a macro bottom –– Bitcoin followed.
If the same thing were to happen again, it would imply Bitcoin would continue following the 4 year cycle and bottom around September to October.
The only difference? I believe Bitcoin's relationship with the $IGV will break, considering the stress on software with the exponential growth of AI will not stop, while the growing recognition of Bitcoin as a "digital commodity" will expand, ultimately de-correlating the two.
Like + Follow ~ we grow money trees here🌱
Bitcoin is still consolidating below its bear flag the exact same way it did in the previous consolidation phase.
With minimal bid until 60k, we could see another capitulation leg lower within the next 2 weeks.
Remember, Bitcoin will do what it wants to do –– be like water my friends.
Like + Follow ~ we grow money trees here🌱
Call an ambulance... But not for me!
Bitcoin completely disregarded the WO + MO and went directly to the range low at 65.7k.
Those who are in the short I posted publicly (74.2k avg) are printing –– thanks to any haters for being our liq.
Now, my base case from here is a retest of the 69k LTF S/R. For this to happen, we need to hold the range low. Losing the range low would then open the door to 60k and below.
Like + Follow ~ we grow money trees here🌱
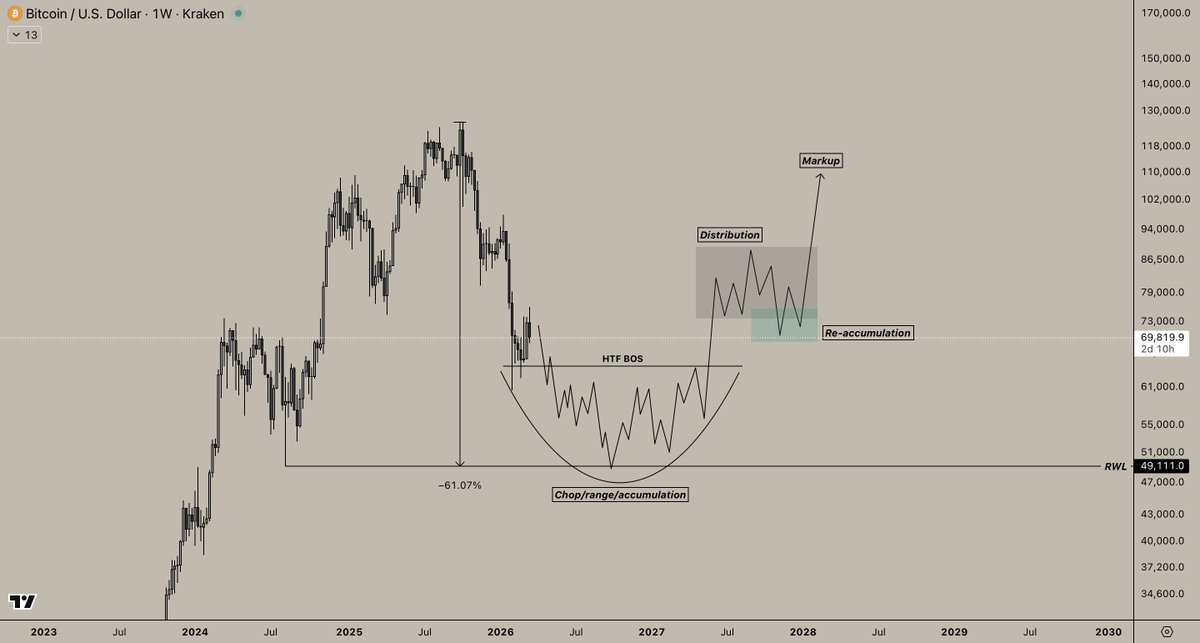
THE $BTC BOTTOM.
I see both sides of the extremes on CT right now pretty consistently: those who think Bitcoin has bottomed and is headed to new ATH's, and those who think Bitcoin is going to 30k.
I'm not going to sit here and claim I know exactly where the bottom is going to be, anyone who does is a fool, but I do currently believe we will have another capitulation leg lower.
With that being said, bottoms take many months to form –– after another capitulation leg lower, I would expect endless consolidation, boredom, and growing disinterest in the asset class as a base is being formed.
Whether we see a rounded bottom or simply a bear flag that breaks towards the upside, that is hard to say, but my general idea is further capitulation lower, lots of ranging/accumulation from big players, a break upwards of HTF structure, and the beginning of the next bull market.
Growing money trees one chart at a time🌱
Like 👍 + Follow 📊 for more!