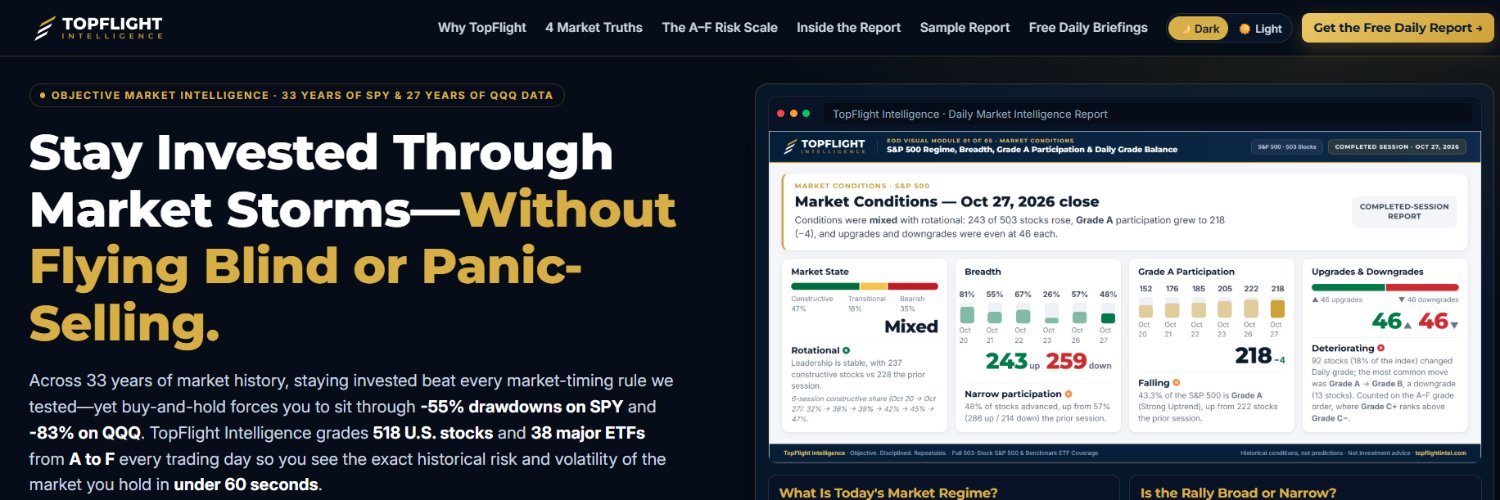
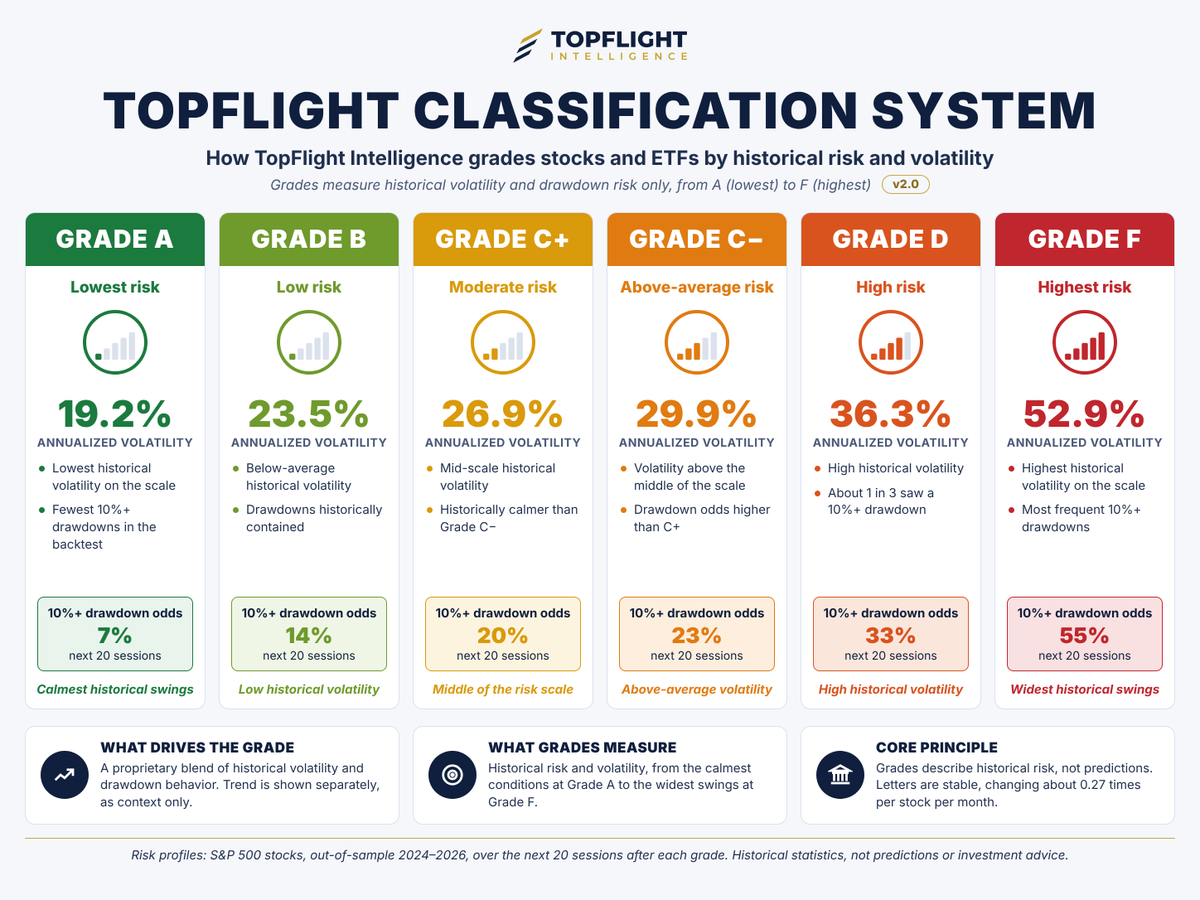
TopFlight Classification System v2.0 is live. Every stock and ETF now carries one A–F letter that measures historical risk and volatility only. No predictions, no instructions.
$SPY: Grade A (lowest risk) as of the Oct 28 close.
TopFlight Capital Flow • 12:59 PM PT
Capital Flow remains defensive.
🟢 3 sectors show inflow
🟡 2 sectors are neutral
🔴 6 sectors show outflow
↑ Information Technology: STRONG INFLOW
↓ Real Estate: STRONG OUTFLOW
Outflow sectors outnumber inflow sectors, which reinforces the weaker participation showing up elsewhere in the market.
TopFlight read: CAPITAL FLOW LEANS NEGATIVE.
Capital Flow Score reflects sector price behavior and participation — not literal fund-flow dollars.
#SP500 #MarketIntelligence
TopFlight Leaders & Laggards • 12:21 PM PT
Today's leaders and laggards are telling two different stories.
LEADERS
🟢 $VRT +16.82% | Grade F | Industrials
🟢 ORCL +12.28% | Grade F | Information Technology
🟢 FLEX +11.69% | Grade F | Information Technology
LAGGARDS
🔴 FFIV -20.62% | Grade A | Information Technology
🔴 CSGP -15.00% | Grade A | Real Estate
🔴 LII -11.85% | Grade D | Industrials
None of the top three gainers currently carry Grade A (Strong Uptrend). Strong daily performance and strong underlying structure are not the same thing.
FFIV carries Grade A (Strong Uptrend) and is -20.62% today. Even strong structures can have difficult sessions.
Broader backdrop: NEGATIVE BREADTH. 199 advancing / 303 declining.
#SP500 #MarketIntelligence
TopFlight Sector Check • 12:21 PM PT
Here's where the market is actually finding strength right now.
STRONGEST
↑ Energy: median +0.82% | 76% advancing
↑ Health Care: median +0.07% | 53% advancing
↑ Financials: median -0.03% | 46% advancing
WEAKEST
↓ Communication Services: median -1.17% | 22% advancing
↓ Real Estate: median -1.08% | 17% advancing
↓ Utilities: median -0.68% | 19% advancing
Financials ranks third today, yet its median stock is still -0.03%. That's a useful clue about how weak the broader tape is: relative strength does not always mean absolute strength.
Market backdrop: NEGATIVE BREADTH.
#SP500 #MarketIntelligence
TopFlight Breadth • 12:21 PM PT
Breadth is leaning negative.
🟢 199 S&P 500 stocks advancing
🔴 303 declining
Median stock: -0.33%
More stocks are losing than winning, and the median stock confirms the pressure underneath the indexes.
TopFlight read: NEGATIVE BREADTH.
The indexes matter. Participation underneath them is giving us the clearer signal right now.
#SP500 #MarketIntelligence
TopFlight Capital Flow • 12:59 PM PT
Capital Flow remains defensive.
🟢 5 sectors show inflow
🟡 0 sectors are neutral
🔴 6 sectors show outflow
↑ Information Technology: STRONG INFLOW
↓ Energy: STRONG OUTFLOW
Outflow sectors outnumber inflow sectors, which reinforces the weaker participation showing up elsewhere in the market.
TopFlight read: CAPITAL FLOW LEANS NEGATIVE.
Capital Flow Score reflects sector price behavior and participation — not literal fund-flow dollars.
#SP500 #MarketIntelligence
TopFlight Sector Check • 10:30 AM PT
Here's where the market is actually finding strength right now.
STRONGEST
↑ Information Technology: median +1.87% | 68% advancing
↑ Industrials: median +0.20% | 55% advancing
↑ Utilities: median +0.13% | 61% advancing
WEAKEST
↓ Energy: median -1.26% | 19% advancing
↓ Consumer Staples: median -0.93% | 6% advancing
↓ Real Estate: median -0.59% | 20% advancing
Information Technology is showing the strongest sector participation, while Energy is carrying the most pressure. The spread between the two is where the rotation story is showing up.
Market backdrop: NEGATIVE BREADTH.
#SP500 #MarketIntelligence
TopFlight Breadth • 07:50 AM PT
Breadth is leaning negative.
🟢 198 S&P 500 stocks advancing
🔴 305 declining
Median stock: -0.29%
More stocks are losing than winning, and the median stock confirms the pressure underneath the indexes.
TopFlight read: NEGATIVE BREADTH.
The indexes matter. Participation underneath them is giving us the clearer signal right now.
#SP500 #MarketIntelligence
TopFlight Capital Flow • 12:59 PM PT
Capital Flow is leaning positive.
🟢 6 sectors show inflow
🟡 3 sectors are neutral
🔴 2 sectors show outflow
↑ Information Technology: STRONG INFLOW
↓ Communication Services: STRONG OUTFLOW
More sectors are showing constructive price behavior and participation than defensive pressure.
TopFlight read: CAPITAL FLOW LEANS POSITIVE.
Capital Flow Score reflects sector price behavior and participation — not literal fund-flow dollars.
#SP500 #MarketIntelligence
TopFlight Sector Check • 10:30 AM PT
Here's where the market is actually finding strength right now.
STRONGEST
↑ Information Technology: median +2.48% | 72% advancing
↑ Industrials: median +0.60% | 70% advancing
↑ Financials: median +0.54% | 62% advancing
WEAKEST
↓ Communication Services: median -1.50% | 9% advancing
↓ Consumer Staples: median -0.60% | 20% advancing
↓ Health Care: median -0.32% | 36% advancing
Information Technology is showing the strongest sector participation, while Communication Services is carrying the most pressure. The spread between the two is where the rotation story is showing up.
Market backdrop: MIXED BREADTH.
#SP500 #MarketIntelligence
TopFlight Leaders & Laggards • 08:30 AM PT
Today's leaders and laggards are telling two different stories.
LEADERS
🟢 $LITE +9.24% | AVOID | Information Technology
🟢 FIX +8.02% | AVOID | Industrials
🟢 CIEN +6.25% | AVOID | Information Technology
LAGGARDS
🔴 FICO -8.61% | REDUCE | Information Technology
🔴 RDDT -5.41% | AVOID | Communication Services
🔴 VYLR -3.82% | ACQUIRE | Consumer Staples
None of the top three gainers are currently classified ACQUIRE. Strong daily performance and strong underlying structure are not the same thing.
VYLR is an ACQUIRE name and is -3.82% today. Even strong structures can have difficult sessions.
Broader backdrop: POSITIVE BREADTH. 329 advancing / 173 declining.
#SP500 #MarketIntelligence
TopFlight Breadth • 07:50 AM PT
Breadth is constructive.
🟢 317 S&P 500 stocks advancing
🔴 184 declining
Median stock: +0.40%
More stocks are participating, which gives the headline indexes better support underneath the surface.
TopFlight read: POSITIVE BREADTH.
The indexes matter. Participation underneath them is giving us the clearer signal right now.
#SP500 #MarketIntelligence
IMPORTANT: We replaced our old classification labels with simple A–F grades.
Why? Because our old labels sounded like trading instructions, and that’s not what TopFlight does.
TopFlight does not predict prices or tell you when to buy or sell. It measures historical risk and volatility across the market.
Across years of historical data, Grade A conditions have consistently shown the lowest volatility and smallest drawdown risk, while Grade F conditions have shown the highest. The A–F scale reflects exactly what the data measures: current market conditions and risk levels, with zero implied action.
The engine under the hood hasn't changed—just the clarity of how we report it.
#topflightintel