With stocks like $MU and $CRWD, it's difficult to know whether they'll rebound to new highs within a month or if those levels may now be out of reach for some time. I try not to guess.
By contrast, the major indexes ($SPX, $QQQ) and precious metals like #silver and #gold will rebound. The real question is whether you've managed your position sizes well enough to stay in the game and participate in the recovery.
$MU is currently trading 5.7% below its 5-day MA and 14.7% above its 10-day MA.
In 11 prior cases when $MU was simultaneously 5.7% below its 5-day MA and 14.7% above its 10-day MA, it closed lower the next day 73% of the time
https://t.co/TEuyOw8KnU
$GOOGL is down 10.4% over the past 4 weeks
Historically when $GOOGL has put together a similar multi-week move, it went on to close green 65% of the time the next week.
https://t.co/CcU7MVlWtt
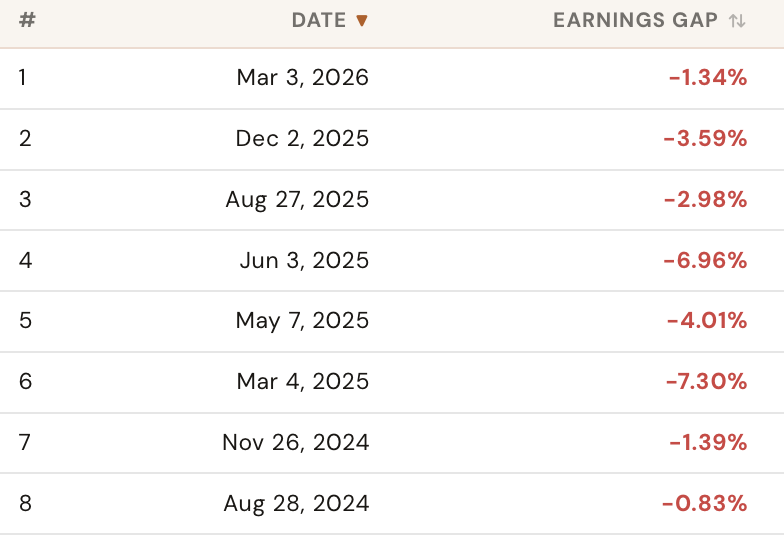
CrowdStrike $CRWD reports after the bell today.
While the fundamentals often impress, it's gapped down after the last 8 earnings reports.
https://t.co/HQVUPeRfcD
CrowdStrike $CRWD reports after the bell today.
While the fundamentals often impress, it's gapped down after the last 8 earnings reports.
https://t.co/HQVUPeRfcD
If $MRVL is the next trillion dollar company, why did it only gap up 0.03% after their latest earnings report when they detailed future expectations?
https://t.co/CuabS5BuSW
These moves have no historical precedent.
$MU has advanced from $60 to $1,100, while MRVL has climbed from $47 to $330.
After trading below $50 for most of the past 26 years, $MRVL is now making $50 moves in a single day.
When price action lacks any historical parallel, the future cannot be predicted with confidence.
The sensible approach is to acknowledge that reality and stay on the sidelines.
This is one of those situations that may not end well for both longs and shorts in the near future.
Inside week for $UVXY
Historically when $UVXY has an inside week while below its 5 week moving average, it went on to close red 74% of the time the next week.
https://t.co/NUdvyESUUW
$AMD is 2.2% above its 5-day MA and 9.6% above its 10-day MA.
Historically when $AMD has been a similar distance above both its 5- and 10-day MAs, it went on to close red 71% of the time the next day.
https://t.co/XSIhjIjHtV
Markets open Monday and June officially begins.
Before you trade the new month, check historical seasonal patterns for ANY ticker with TradeIntel’s Seasonality tool.
→ Monthly return graph
→ Year-by-year heatmap
→ Median vs Average toggle
👉 https://t.co/gnKKnjFALX