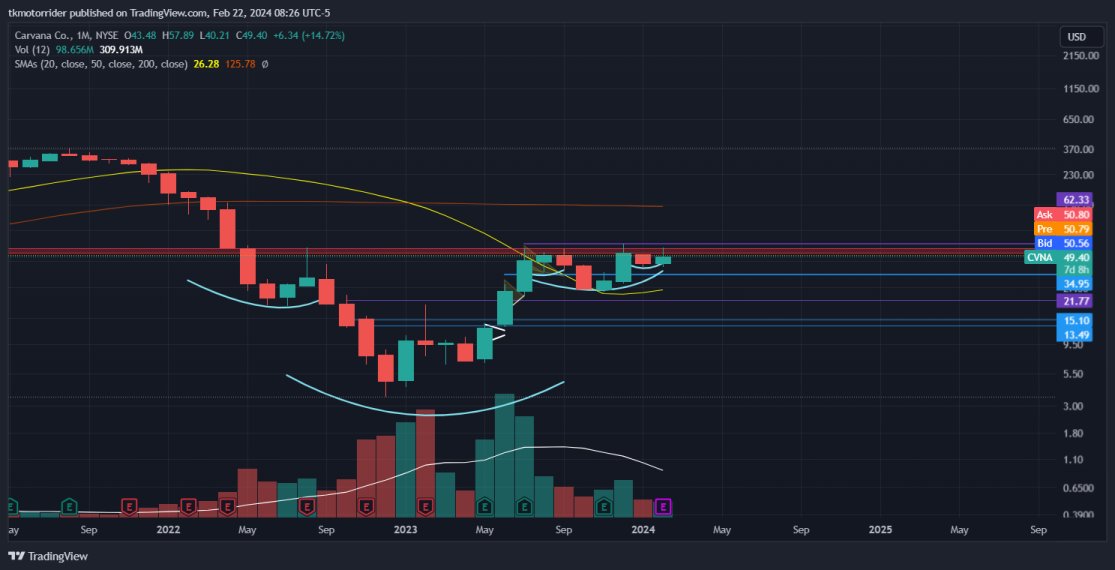
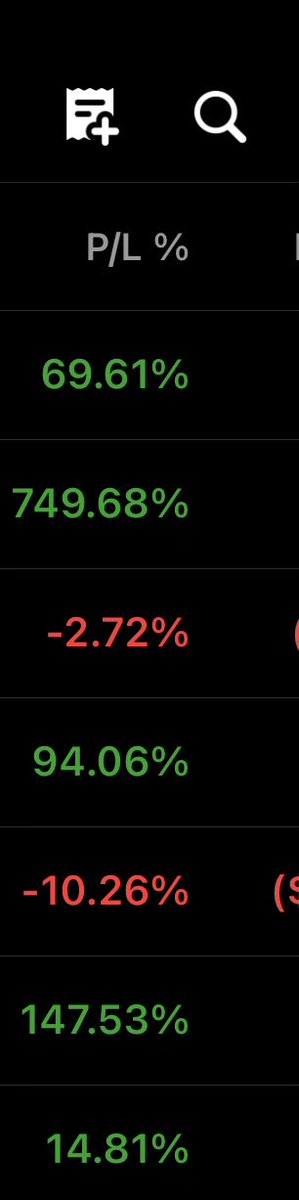
$CVNA shows bullish patterns on monthly & weekly charts, forming right shoulder & mini inverse head and shoulders. Targets: $117 & $350.. Monitor 50MA. Enter cautiously due to all-time high market. Earnings up 23% after hours.
Elite Trading Framework (Structural Momentum & HVE Systems)
This master blueprint outlines my execution ready trading methodology. It is engineered to capture explosive moves in high velocity growth stocks by combining supreme institutional urgency, structural price compression, and flawless mathematical risk management relying strictly on clean daily and weekly price action for entry and invalidation.
Strategy 1: The Core Structural Swing System
This strategy focuses on trading elite relative strength and structural chart compression directly against key moving averages on the daily and weekly timeframes.
Phase 1: Screening & Selection
Elite Relative Strength (RS): You target market leaders actively outperforming the broader indexes ($SPY/$QQQ). You prioritize vehicles pushing into "blue sky" all-time high territory or tightly consolidating directly under lifetime resistance, proving they are immune to market selling pressure.
True Fundamental Engines: Setups must be backed by undeniable institutional drivers, such as recent "beat and raise" earnings reports or powerful secular trends (e.g., AI data center infrastructure and next-gen semiconductor components).
Phase 2: The Setup & Volatility Compression
You never buy extended, chasing stocks away from support. You patiently wait for the near term supply to dry up and the moving averages to catch up to the price.
High Tight Flags (HTFs): High velocity moves that flag sideways, refusing to retrace deeply, proving that institutions are aggressively defending the shares.
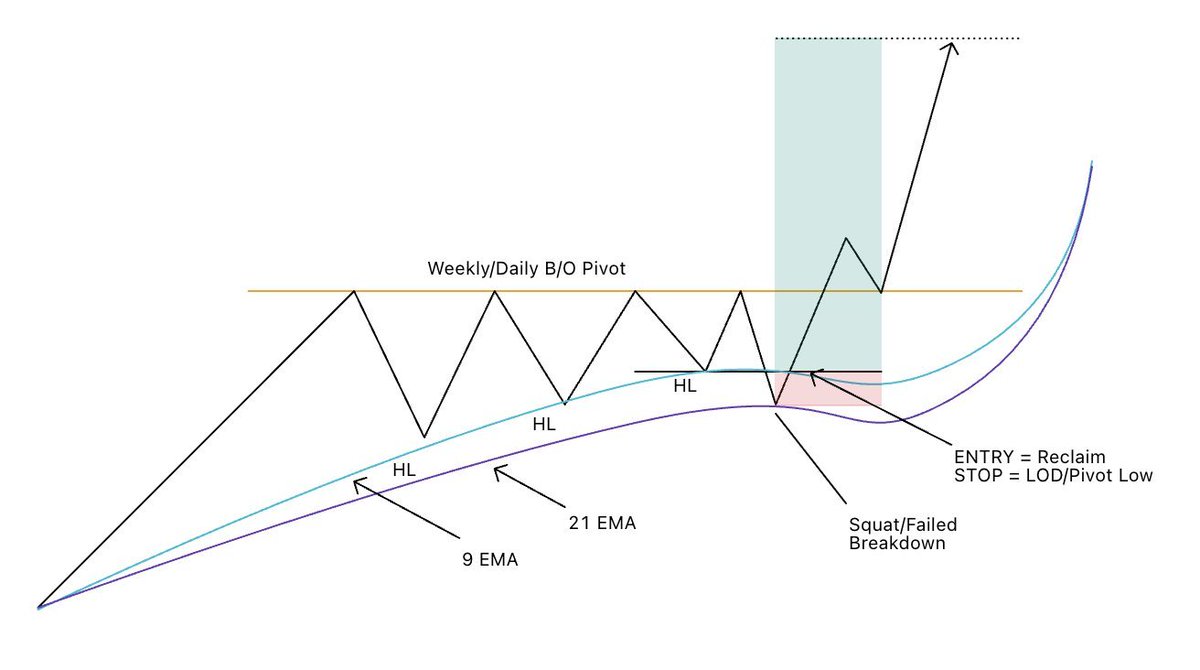
The "Squat" Pattern: The stock "squats down" tightly into its key dynamic moving averages using the 8w eek EMA on the weekly chart as your ultimate reference point for pullbacks to determine if it is ready to move immediately or needs more time, or the 21 EMA on the daily chart.
Inside Days & Volume Dry Up (VDU): You look for tight daily candles trading entirely within the prior day's range. As the stock sits in the squat, volume must completely disappear, proving that floating supply has been completely absorbed.
Phase 3: Absolute Daily Execution & Invalidation
The Trigger: Entry is executed on a clean breakout past the immediate daily consolidation pivot level (e.g., the high of the inside day, the high of the flag, or down-trend resistance).
The Stop Loss: Your risk is pegged strictly and mathematically to the structural low of the consolidation setup typically placed right under the low of the "squat" candle, the inside day low, or the key supporting 8 week EMA. If the stock triggers the breakout but immediately reverses through this low, the squat isn't ready. You cut the trade instantly with zero hesitation.
Strategy 2: The HVE (Highest Volume Ever) Breakout Strategy
This is your specialized, ultra high conviction strategy reserved exclusively for historic corporate milestones and absolute institutional urgency.
The Setup: You scan for a stock printing its Highest Volume Ever Traded, typically accompanied by a massive, violent gap up or breakout past all time highs or out of a multi month institutional base.
The Psychology: This represents a permanent structural regime shift. Massive mutual funds and institutions are trapped in a state of extreme urgency, scrambling to build positions all at once. This historic volume signature permanently changes the character of the stock.
Execution & The First Pullback: * Day of Print Entry: Entering directly on the breakout daily candle if it clears a clean key level with a defined structural daily low stop.
The First Pullback (The High Probability Play): If the initial HVE gap is too extended to manage risk safely on a daily chart, you place the ticker on a high priority watchlist. You wait to buy the very first orderly pullback or "squat" back to a key technical level or the 8-week EMA, knowing institutions will heavily step in to defend the baseline of the highest volume day in the company's history.
System Mathematics: Asymmetric Expectancy
The ultimate engine of both strategies is pure mathematical expectancy. Because you buy right at the exact inflection point of a tight daily/weekly flag or a structural squat, your risk from entry to your daily stop loss is remarkably small (frequently only 1% to 3%).
The Reward: When a high RS leader or an HVE catalyst stock successfully clears its daily pivot and unlocks its next major momentum expansion leg, it can easily surge 10% to 15% or more in a matter of days.
The Ratio: This creates a clean 1:5 risk to reward ratio (risking $1 to make $5).
The Expectancy: Under this mathematical profile, you do not need a high win rate to compound capital rapidly. Even with a modest 25% to 30% win rate, your outsized winners will heavily multiply your small, tightly controlled losses, guaranteeing consistent, geometric account growth over a large sample size of trades.
$AAOX. This one’s ballsy AF in this market but it’s got my full conviction.Bull divergence → strong uptrend move. Now on the 30min, we just made a higher high, pulling back to the 9 EMA with a clean bull hidden divergence.Risk-managed stab incoming. Let’s see if she bounces.
FTI just tagged a new high and sold off... not my favorite move
But check it: still holding the 9 EMA on the daily like a boss after the shakeout, PLUS a clean bull hidden divergence on the chart. I’m not done with this one yet. Eyes on the bounce. #FTI#Trading
An important concept I've learned in my trading journey is that your entry tactic should directly match the environment you're trading in.
and understanding this distinction has completely changed my consistency.
because I'm no longer forcing the same approach in every market condition, regardless of whether it makes sense.
When the market is trending strongly (when the indexes are above all moving averages with rising EMAs and price is making consistent HHs and HLs):
I focus on entering breakouts because in trending environments, breakouts tend to follow through with momentum and you get bought out as the trend continues to attract buyers and carry the stock higher.
...but when the market is choppy (when the indexes are whipping around their moving averages with no clear direction and breadth is contracting):
I shift my focus entirely to entering on undercuts, because in choppy environments, breakouts tend to fail more frequently.
and over time, I've noticed that the best risk/reward comes from buying the undercut of a major pivot or moving average where weak hands have been flushed out, and you're getting a better price with tighter risk as buyers step back in.
When a stock is trending up... when it's making higher lows, respecting its rising 9/21 EMAs, and showing consistent upward momentum, I lean on those moving averages as my support levels and my risk management guide.
...meaning I'm comfortable buying pullbacks into the 21 EMA or trailing my stop below the 9 EMA as the stock moves higher because the moving averages are acting as dynamic support.
But when a stock is going sideways, when it's building a base or consolidating in a range, I completely shift my approach and lean on static levels instead.
@FranVezz put it well!
...meaning I'm watching horizontal support and resistance, prior pivot highs and lows, and areas where the stock has shown accumulation or rejection.
because in sideways markets, moving averages lose their relevance and become unreliable as support since price is just chopping back and forth across them. However, I still use them as a reference in a range bound envrionments!
For example, during the strong trending market we saw earlier this year, I was buying breakouts above consolidation ranges and trailing stops below the 9EMA on names like $PLTR, $HOOD, and others that were in clear uptrends.
and those trades worked beautifully because the environment supported that aggressive style of entering on strength and letting momentum carry the position.
But in the current choppy environment where the indexes have been "range bound" for months, I've completely shifted to waiting for undercuts of major daily/weekly pivots + EMAs, then buying the reclaim with velocity and tight risk.
I've adapted because that's what's been working in this environment and trying to buy breakouts has been a recipe for getting chopped up as they fail and reverse.
What I'm trying to get at is that the key is being flexible enough to recognize what the market and the individual stock are telling you.
and then adjusting your entry tactic to match that information instead of stubbornly sticking to one approach regardless of context.
questions I constantly think about...
Am I using the same entry tactic in every environment?
Am I adapting my approach based on whether the market is trending or choppy and whether the individual stock I'm trading is trending or going sideways?
knowing this now...
I've dramatically improved my trading and my ability to stay on the right side of the market instead of fighting it with the wrong tool for the wrong job!!
$CMC
Adding to the watchlist. Holding the 9 EMA on the daily with a clear bull hidden divergence in play. Inside day setup too. Looking for a slow grind higher toward $85. Metals/infra names still have legs. $CMC
$TAYD is on watch for me right now. A special looking PEG setup with just a starter position so far. Pullback to the 9 EMA on the daily with a clean hidden bullish divergence has me ready to add if this holds and turns up
$AXGN is one of my top ideas this week. Inside week holding the 9 EMA on the weekly with hidden bullish divergence. Looks ready to take out recent highs soon
Adding $RDW to the watchlist. 🔭
Chart is looking super hot with an Inverse Head & Shoulders on the daily. Volume is pouring in today.
Looking for that gap fill at $13.39 for the next PT. Let’s see if it holds this strength. 📈🚀 #Stocks#RDW
Checking back in on $BTSG... and wow. 🚀
From a "slight fakeout" in Oct '24 to a massive +100% run into 2026. This is why we trust the daily EMA holds and hidden divergence.
New ATH today. The trend is still your friend. 💎🙌
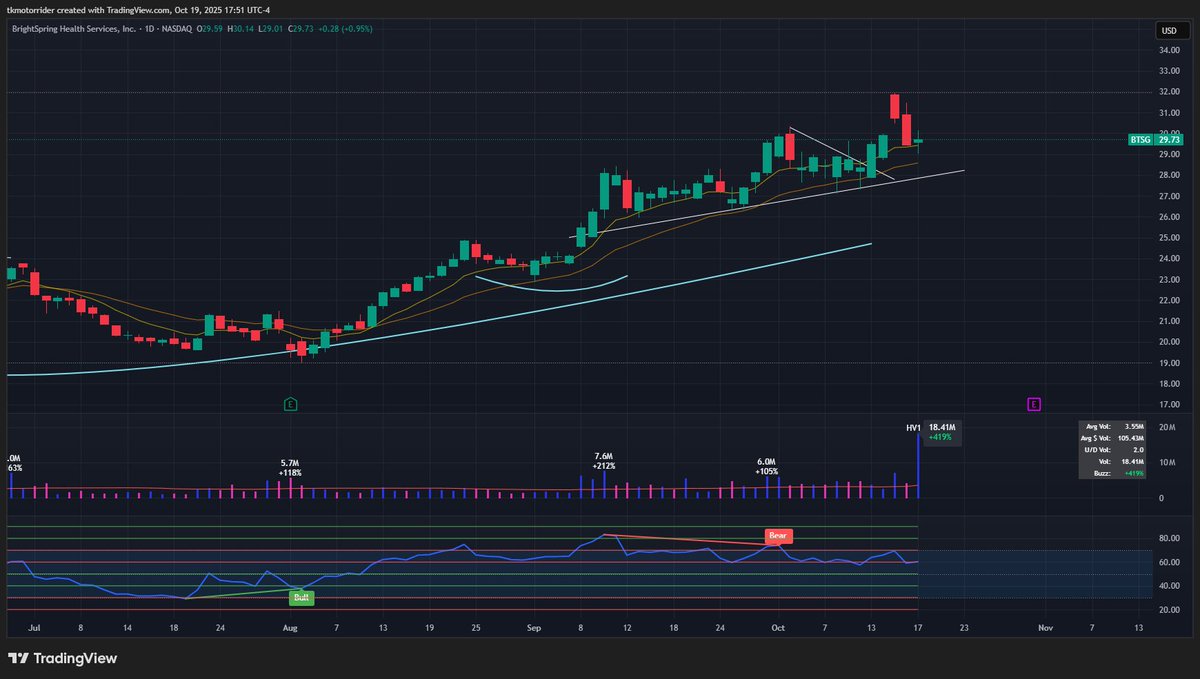
$BTSG had a slight fakeout, but it looks poised to break out of this range. Bullish hidden divergence, holding the 21 EMA, but I’d like to see more volume for confirmation
$MMM is lining up for an ATH push. Inverse H&S target hit, now forming a daily bull flag + PEG setup, holding the 9 EMA. Expecting a potential flush-out after a new high—it's $MMM's classic move. Still holding my shares, avg $120. 📈 #StockMarket#Trading#3M
$MMM. This is looking really good. Inverse head and shoulders with a bull hidden divergence. Bull flagging near highs. Still holding my shares back from August, looking to add more