Clean breakout! 🚀After that grueling 9-month WXY correction, price is finally slicing through the downward channel. Last C-leg looks complete off the 3870 lows. Now it's all about reclaiming $4200 zone to confirm the 5 waves impulse. Let's see if bulls can sustain this momentum!
GOLD Possible last leg for #gold completed at 3870. Since September, structure looks like five waves that could confirm completion of the C-wave of the Double Three (WXY). Bulls need to break this downward channel 👀 https://t.co/lrGGGjKhz1
Gold's correction from January looks like a double zig-zag (WXY) with seven legs almost completed.
In a potential reversal zone for a fourth wave.
Must stay above 3706 (Fib.50%) with bullish divergence.
Gold corrected ~30-34% in the 2008 GFC.
#gold
Gold's correction from January looks like a double zig-zag (WXY) with seven legs almost completed.
In a potential reversal zone for a fourth wave.
Must stay above 3706 (Fib.50%) with bullish divergence.
Gold corrected ~30-34% in the 2008 GFC.
#gold
Gold's correction from January looks like a double zig-zag (WXY) with seven legs almost completed.
In a potential reversal zone for a fourth wave.
Must stay above 3706 (Fib.50%) with bullish divergence.
Gold corrected ~30-34% in the 2008 GFC.
#gold
#Gold is breaking out of its descending channel after the possible completion of a WXY correction, signaling a bullish reversal. The recent $50 surge appears driven by Chinese buyers returning from Golden Week, while Western speculators remain notably absent.
TradingView finally shut down their chat rooms — completely overrun by trolls & trash talkers. About time, the content hit rock-bottom mediocrity. Good riddance!
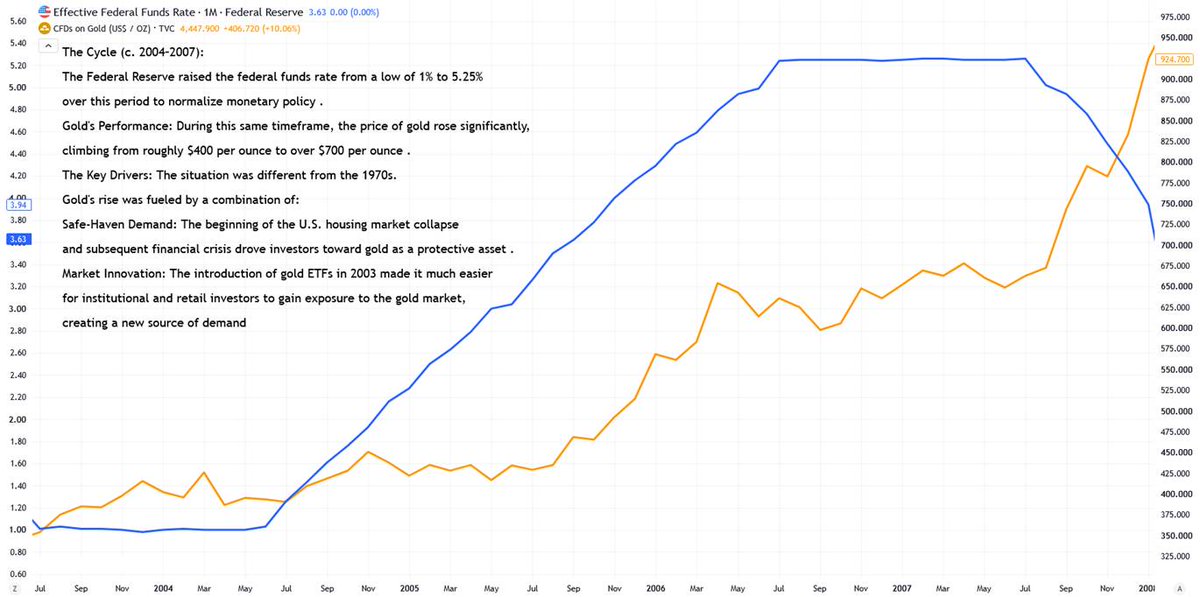
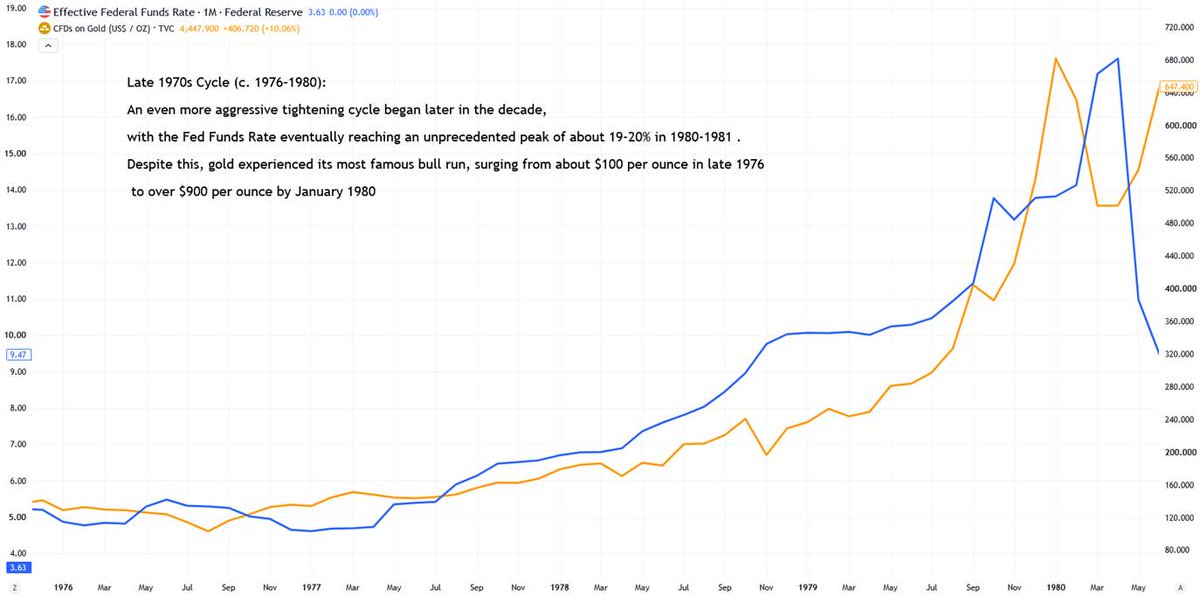
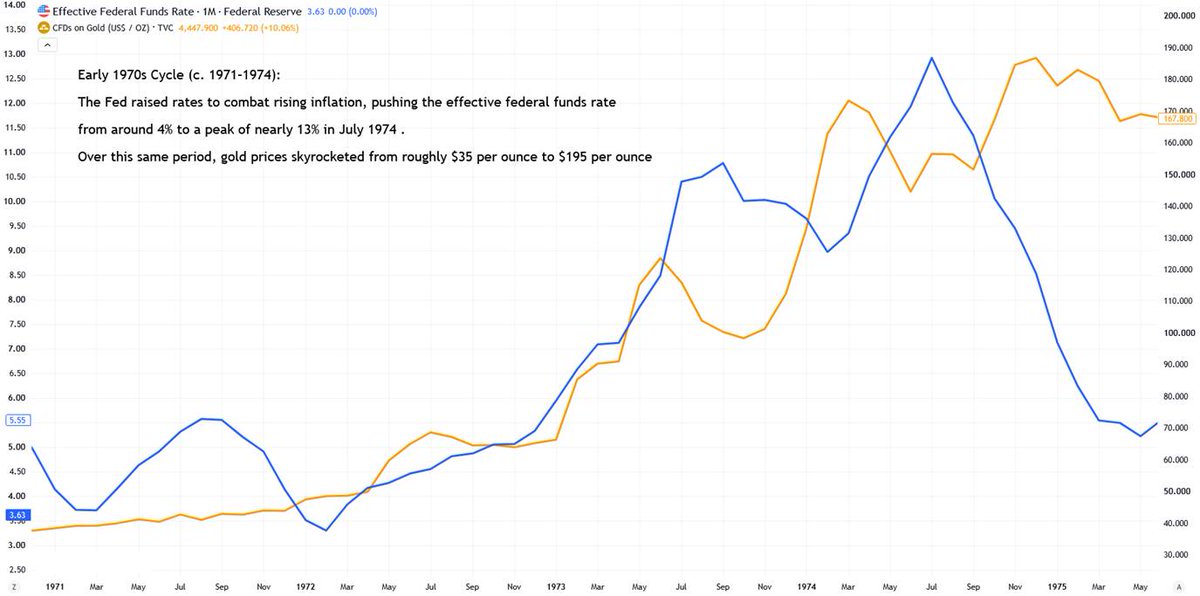
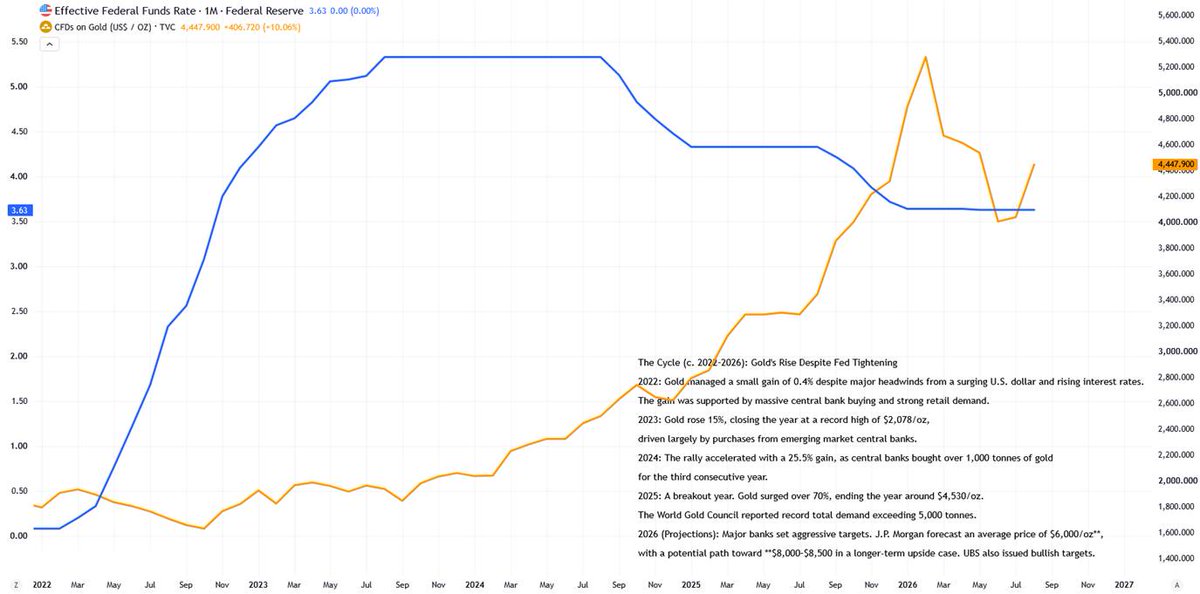
Conventional wisdom says rate hikes kill gold.
But history disagrees — #gold rallied during Fed tightening in the 1970s, the mid-2000s, and again from 2022–2026. Inflation, central bank buying, and geopolitical risk outweighed the rate headwind.
Conventional wisdom says rate hikes kill gold.
But history disagrees — #gold rallied during Fed tightening in the 1970s, the mid-2000s, and again from 2022–2026. Inflation, central bank buying, and geopolitical risk outweighed the rate headwind.
Conventional wisdom says rate hikes kill gold.
But history disagrees — #gold rallied during Fed tightening in the 1970s, the mid-2000s, and again from 2022–2026. Inflation, central bank buying, and geopolitical risk outweighed the rate headwind.
Conventional wisdom says rate hikes kill gold.
But history disagrees — #gold rallied during Fed tightening in the 1970s, the mid-2000s, and again from 2022–2026. Inflation, central bank buying, and geopolitical risk outweighed the rate headwind.
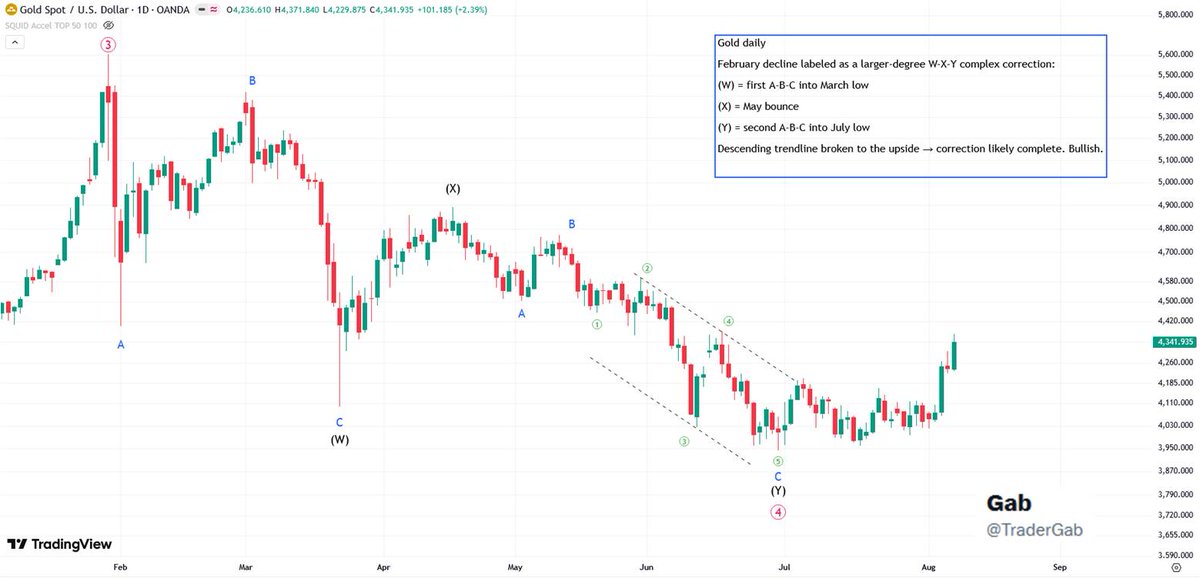
Gold Daily EW: Corrective WXY appears finished at the July C/(Y) low. Strong impulsive bounce + rising parallel channel = bottom is likely in. Bullish continuation preferred while the low holds. #Gold#ElliottWave
Gold daily
February decline labeled as a larger-degree W-X-Y complex correction:
(W) = first A-B-C into March low
(X) = April bounce
(Y) = second A-B-C into July low
Descending trendline broken to the upside → correction likely complete. Bullish.
#gold
Called the $3900 zone back in early June
Looking at the actual low, spot #gold bottomed very close to $3940. High probability that was the low of this correction. Structure held, selling pressure exhausted, and price has already started reclaiming levels. https://t.co/UhaolOufMZ
@Kathleen_Tyson_@DavidLe76335983 UK exporting more gold than anyone, huh? Truly the pinnacle of British manufacturing — digging it straight out of the London vaults they imported last week. Empire strikes back with other people’s bullion.
The largest drawdowns for #gold over periods of less than 26 weeks occurred in:
January 1980 (43%), September 1980 (35%), October 1981 (32%), March 2008 (31%), September 2012 (30%), and January 2026 (29% thus far).
When #gold trades roughly 10% below its 200-day SMA, it has historically marked a strong reversal zone. This deviation has consistently signaled seller exhaustion, with prices typically bouncing back toward the trend line...
Bearish bets on #Gold have become extremely crowded as prices test major support at the March and recent lows ($4000–$4100). It feels like we’re approaching a bottom in precious metals and a top in Dixie.
#Gold is holding above the 38.2% Fib. supporting the view that Primary wave 4 remains intact and could still form a triangle or a zigzag. The recent tag of the lower Bollinger Band suggests a potential bottom, setting the stage for the next leg up in the larger trend.