🚨🇺🇸BREAKING: JANET YELLEN LEAVES TREASURY DEPARTMENT FOR THE LAST TIME
Janet Yellen has officially closed the door on her tenure as Treasury Secretary—unfortunately, not before inflation opened everyone else’s wallets.
Her legacy?
Record-breaking price hikes and economic turbulence that Americans won’t forget anytime soon.
Source: @nicksortor
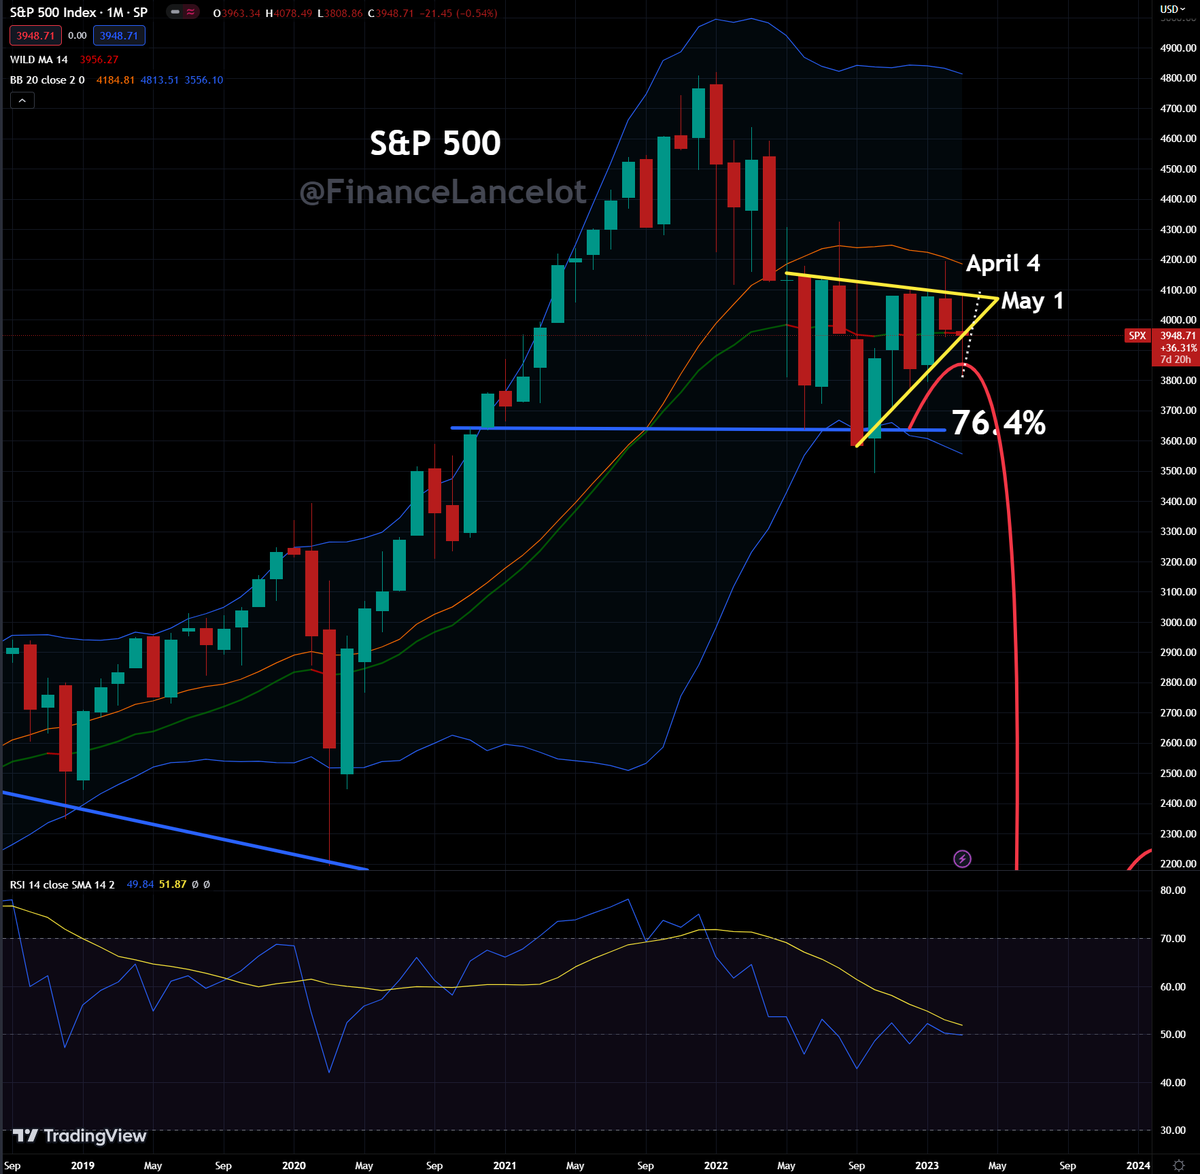
10 Signs of a Short-Term Market Top:
1. RSI gets near 70 on the daily chart
2. Big Bearish candlestick
3. The market opens higher but fails to go over the opening price
4. The market opens below the previous day's trading range and never goes up
5. The market starts to open higher but closes lower
6. The average daily trading range increases and volatility grows
7. A huge volume day that gaps way up and then sells off
8. Price is far extended from short-term moving averages
9. A major good news event is sold
10. When the majority is bullish
America rose to greatness over the past 150 years, because it was a meritocracy more than anywhere else on Earth.
I will fight to my last drop of blood to ensure that it remains that land of freedom and opportunity.
🇺🇸🇺🇸🇺🇸🇺🇸🇺🇸🇺🇸🇺🇸🇺🇸🇺🇸🇺🇸🇺🇸🇺🇸🇺🇸
A simple moving average is a technical indicator that you can use to quantify price trends and trading signals:
Moving averages can be used for the following:
•Entry signal
•Exit signal
•Trailing stop
•Stop loss
•Profit target
•To scale into a position
•Trend indicator
•Risk management
•Quantify position sizing
•To measure volatility
•To manage volatility
•Creating good risk/reward ratios
•Trade management
•Quantifying signals for backtesting
1. Entry signal: When price crosses over a single moving average or two moving averages crossover it can be a signal to buy. A loss of a key moving average can be a signal to sell.
2. Exit signal: When price crosses under a single moving average or two moving averages cross under it can be a signal to sell. Price over taking a key moving average can be a signal to buy to cover a short position.
3. Trailing stop: A short term moving average can be used as a trailing stop loss to allow a winning trade to run until it reverses and closes under that moving average.
4. Stop loss: When a trade is entered a loss can be limited by using a moving average as the place to exit the trade if it is lost.
5. Profit target: A price rally back to a key overhead moving average can be target where profits are locked in when reached.
6. To scale into a position: A trade can be scaled into as key moving averages are retaken. Like after a downtrend buying on a break back over the 250 day moving average then more as the 200 day moving average is retaken.
7. Trend indicator: Where price is in relation to the moving average in your timeframe can tell you the direction of the current price trend in a market.
8. Risk management: Using moving averages as stop losses, trailing stops, and trend signals you can manage risk by limiting your losses.
9. Quantify position sizing: You can size your trade based on your moving average stop loss level for how much you want to lose if the trade doesn’t work out.
10. Measure of volatility: How far price is from a moving average in a timeframe can show the level of volatility from the price average.
11. Manage volatility: Moving average crossovers of two moving averages as entry and exit signals can filter out much of the noise in price action and focus on the bigger trend.
12. Creating good risk/reward ratios: Using moving averages to set a stop loss much smaller than your potential profit target gain can create good risk/reward ratios.
13. Trade management: Moving averages can be used to cut losses short and let winners run by managing a trade as it evolves.
14. Quantifying signals for backtesting: Moving average signals can be quantified and used in backtesting to see their historical performance if used as mechanical entry and exit signals.
8. "You have to change your life if you’re not happy, and wake up if things aren’t going the way you want."
Happiness is an inside job.
Don't outsource it to a boss, job, tribe, spouse, or political party.
If you're unhappy do something about it.
Emergency repo operations historically signal a 6m countdown to a market crash
'08 repo began Mar crashed in Sep
'20 repo began Sep crashed in Mar
The charts however, signal that we're possibly 2-3 wks away from a major event. WFC earnings Apr 13?
Seems David Rosenberg agrees.
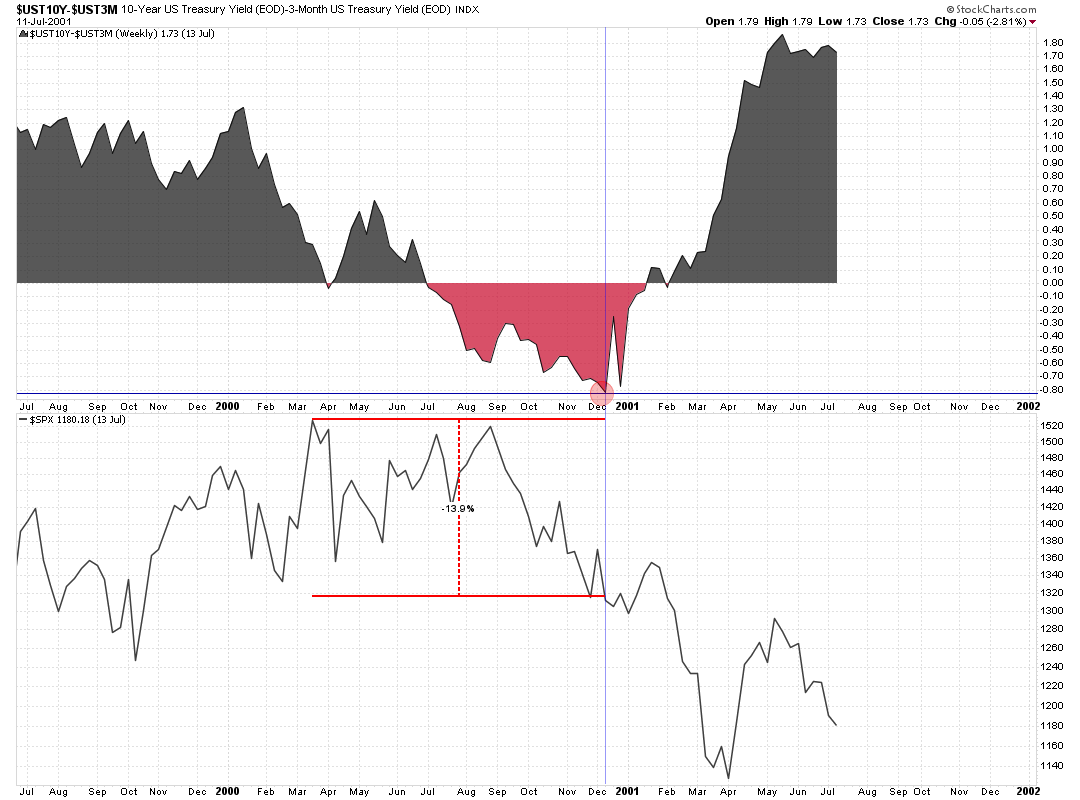
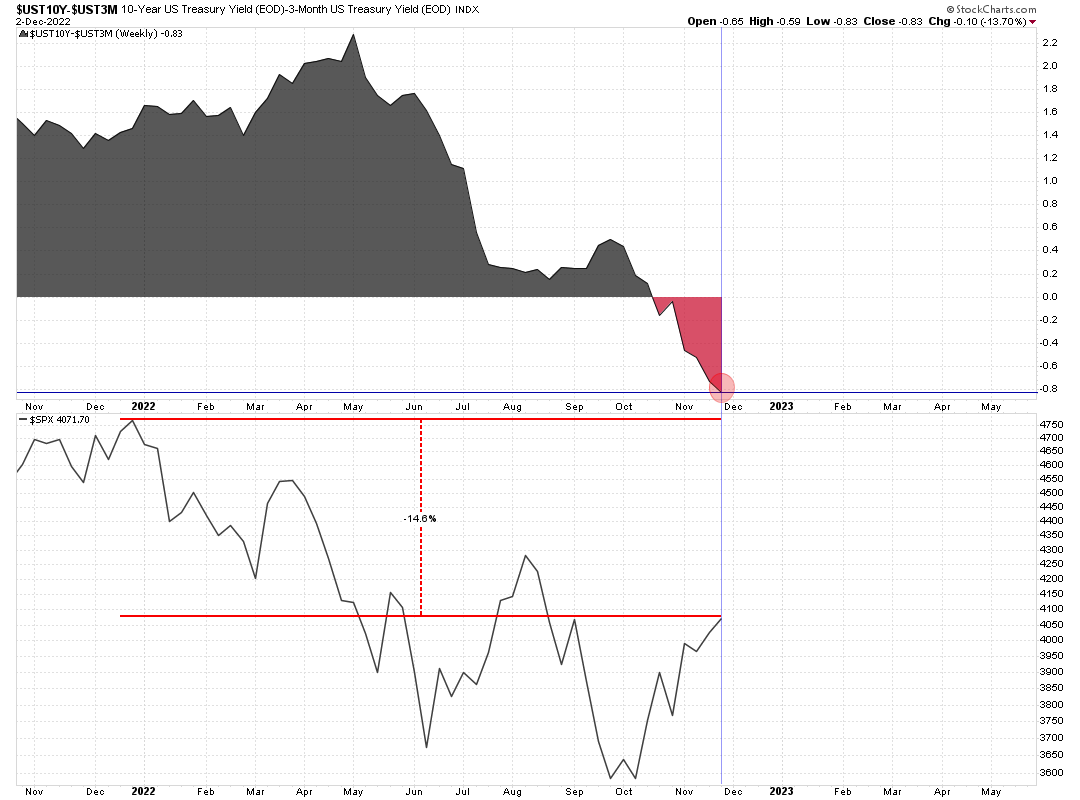
Did you know that early December 2000 the 10yr-3m yield curve was -83bps and the $SPX was -14% YTD from its peak.
Did you know that it is early December now and the 10yr-3m yield curve is -83bps and the $SPX is down -14% from its peak.
Crazy.