At mid-month let's recap April:
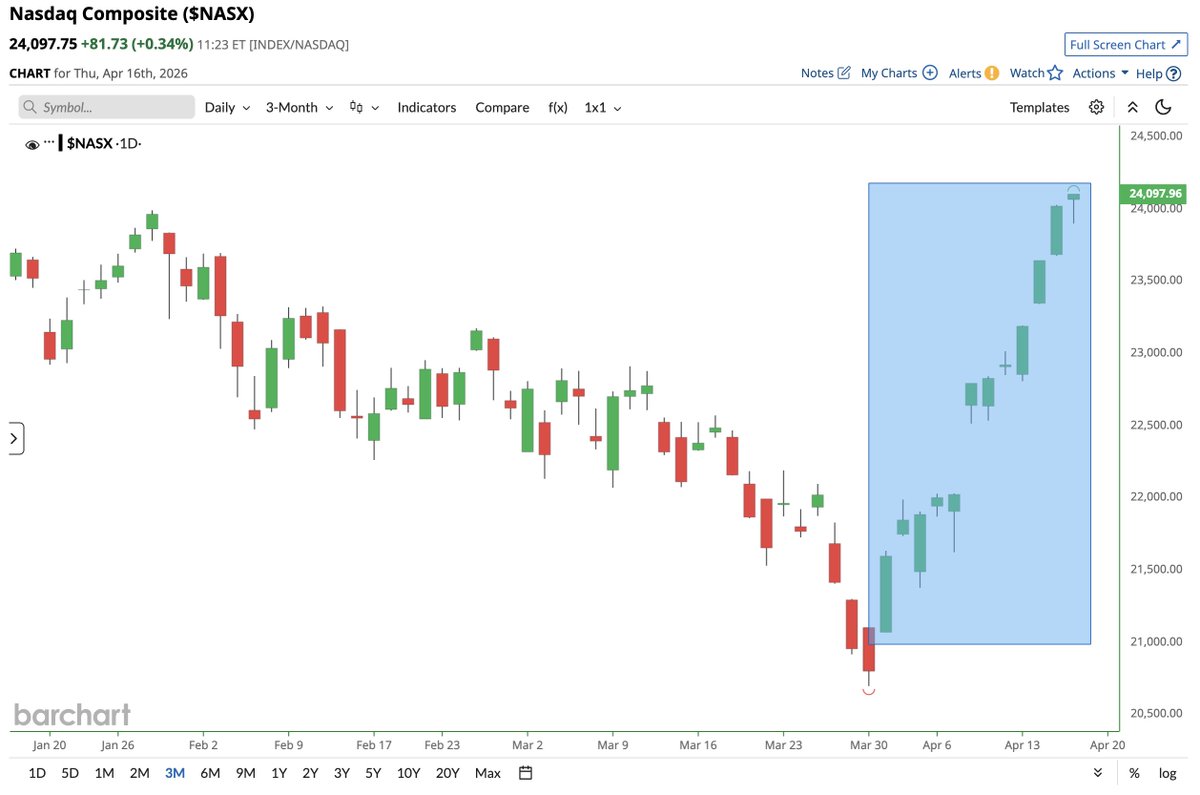
Two weeks ago on April 1st, a short-covering rally started because in his evening White House war update Trump said the war would only last a few more weeks. Then last Wednesday, he announced a two week ceasefire. Which caused markets to ramp even more.
But this past weekend he announced a double blockade of Hormuz and ended the ceasefire. However, bulls have optimistically interpreted this latest escalation as the last phase of the war. Wall Street is tripping over themselves to raise market forecasts.
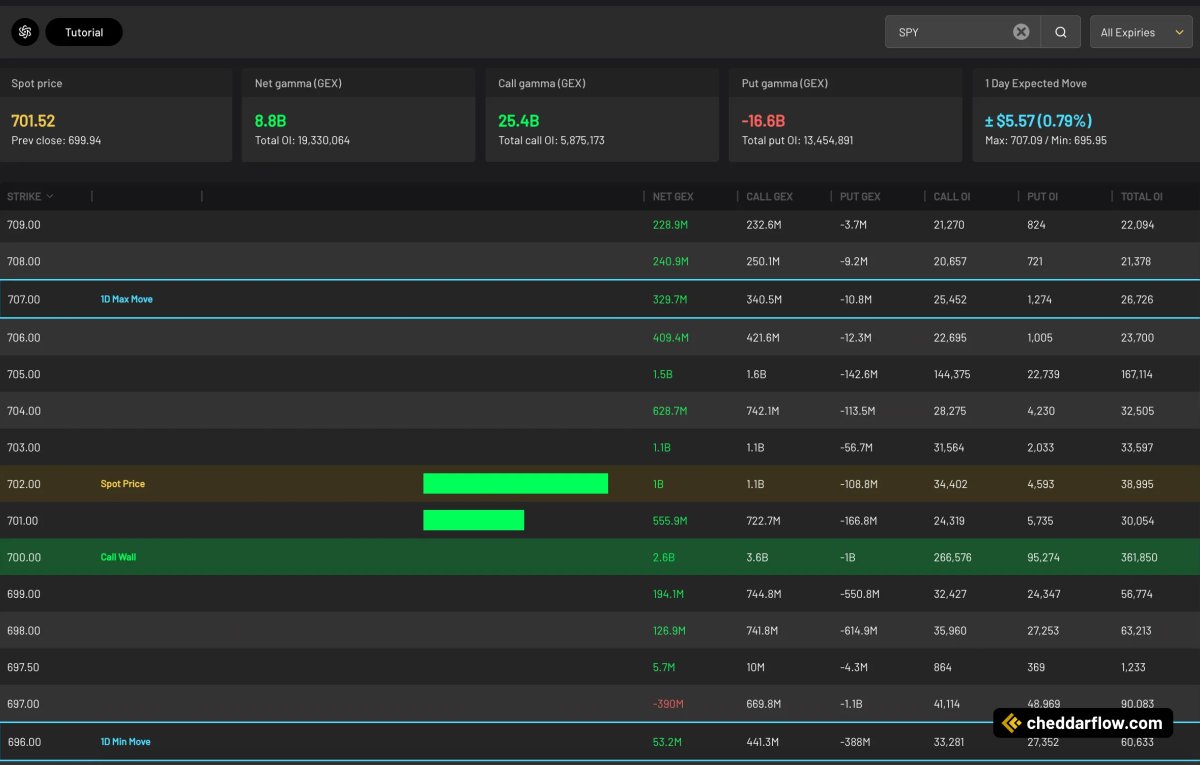
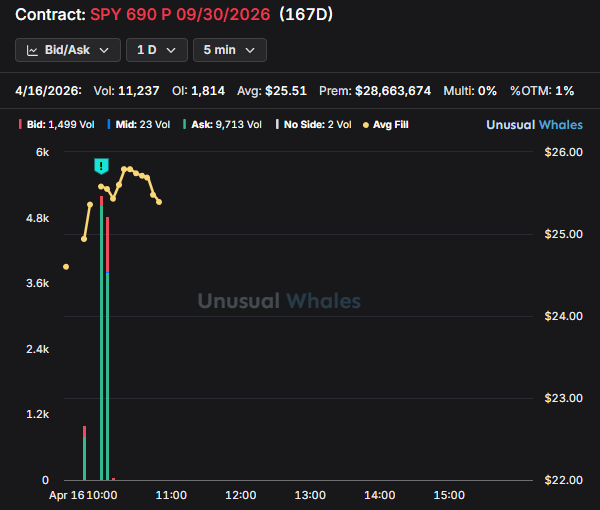
This week is options expiration which has accelerated the (short) gamma squeeze. Yesterday had the highest index call/put ratio in two years. Which is putting further upward pressure on the market.
All of which means that by the end of this week, hedge funds will be totally unhedged in an escalated war, at the lowest liquidity point of earnings season.
And that's how you get a big crash.
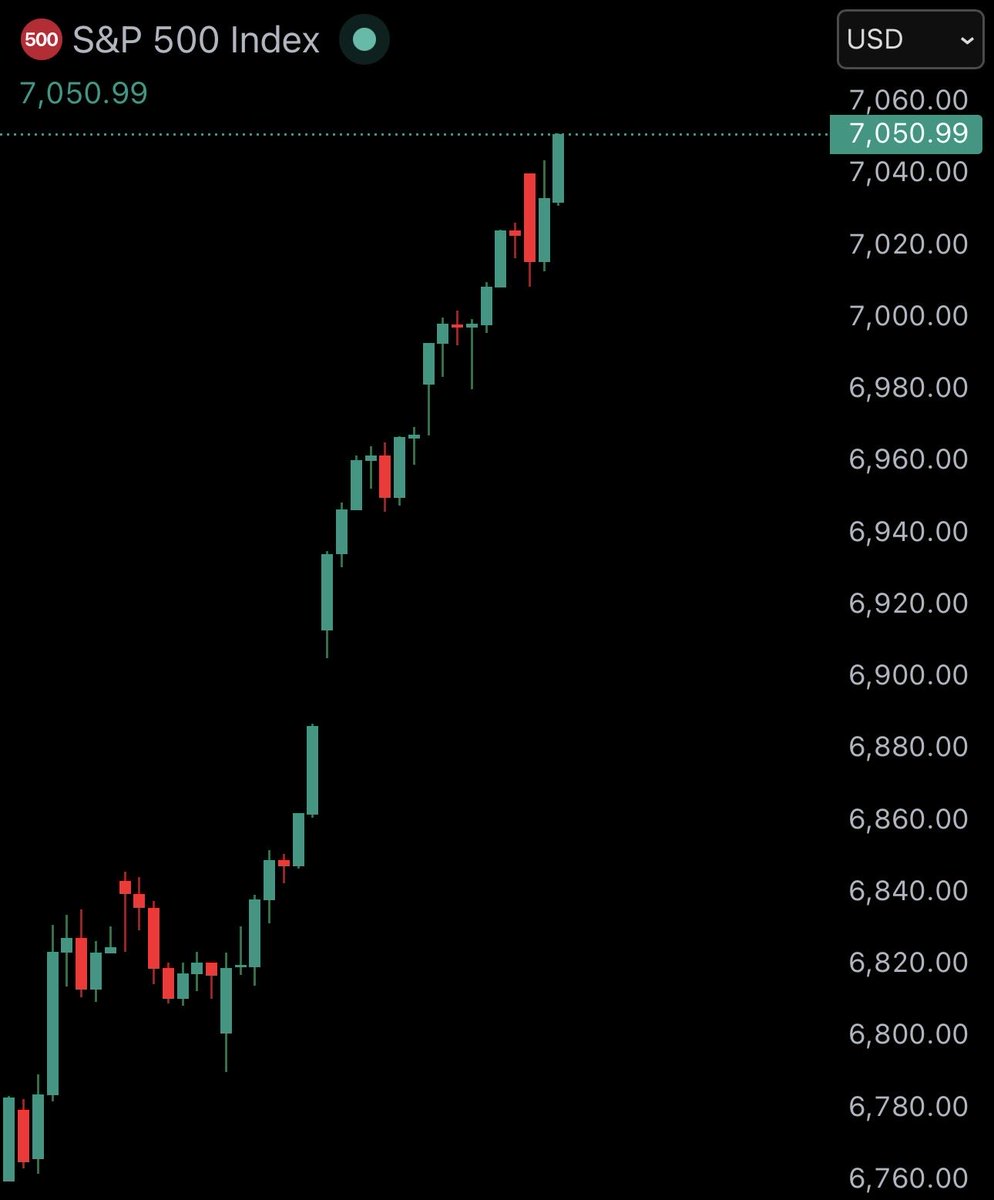
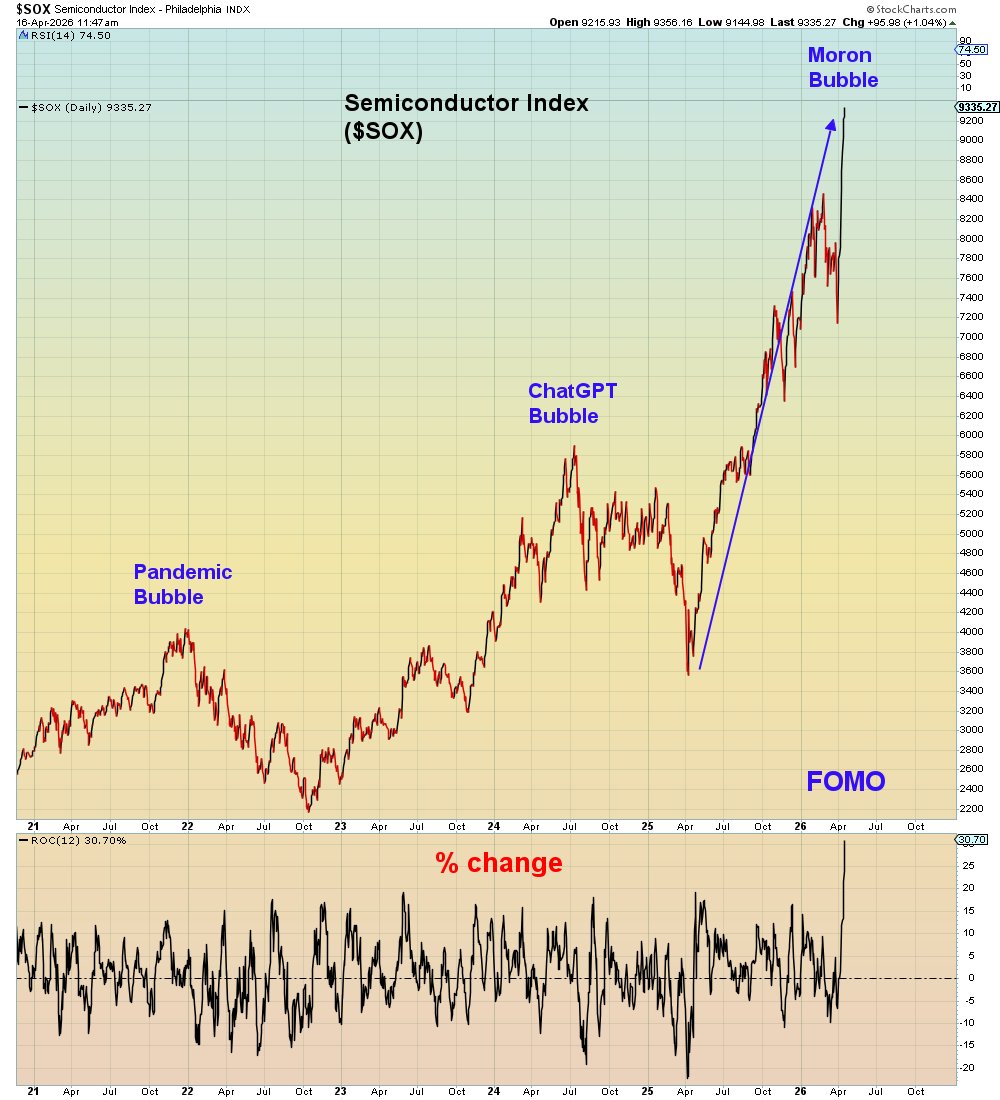
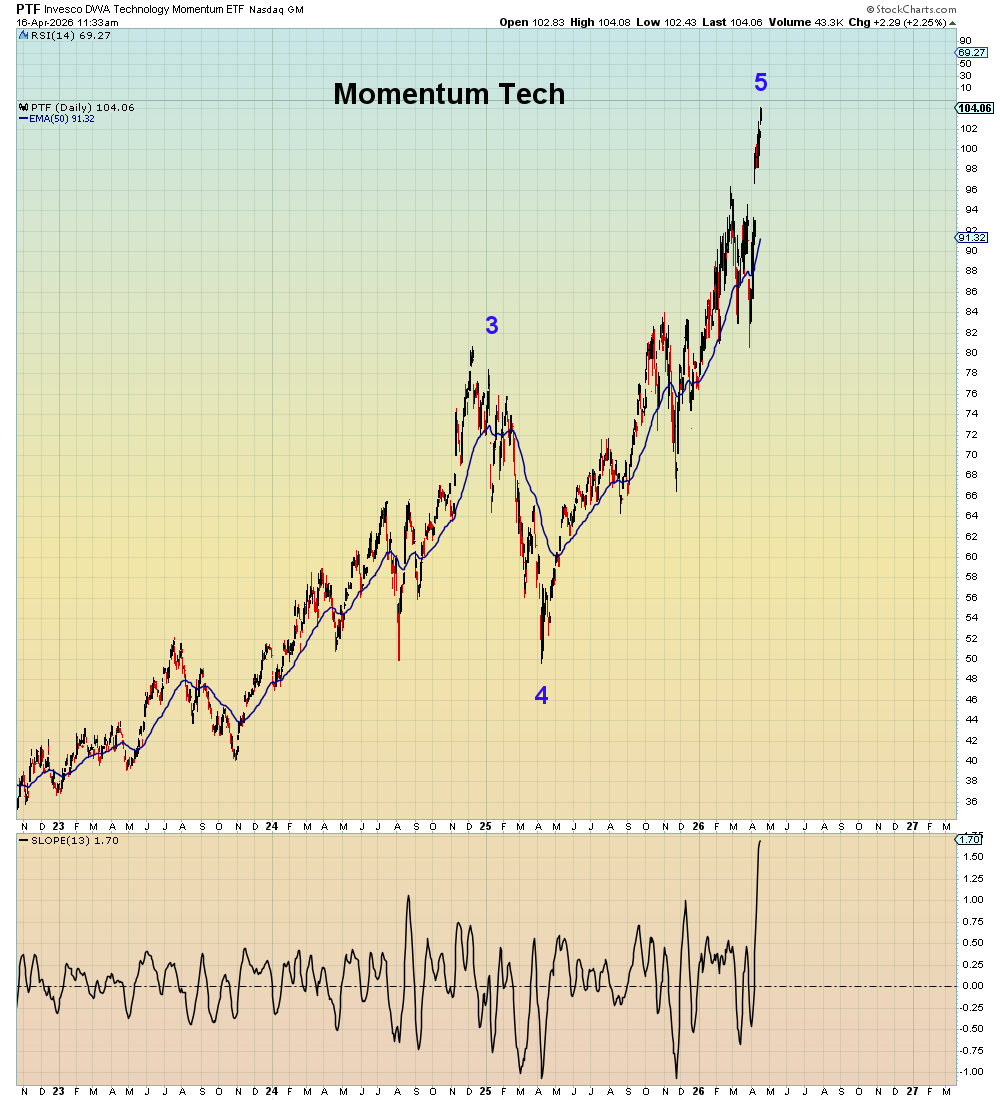
Biggest 12 day % gain to all time high since March 2000.
If you were not around back then or not trading, what happened is that Tech stocks spontaneously exploded. Semis took 18 years to regain the Y2K high.
You have to wonder, why is no one writing about this?
Because it's a moron bubble and they don't know it's ending.
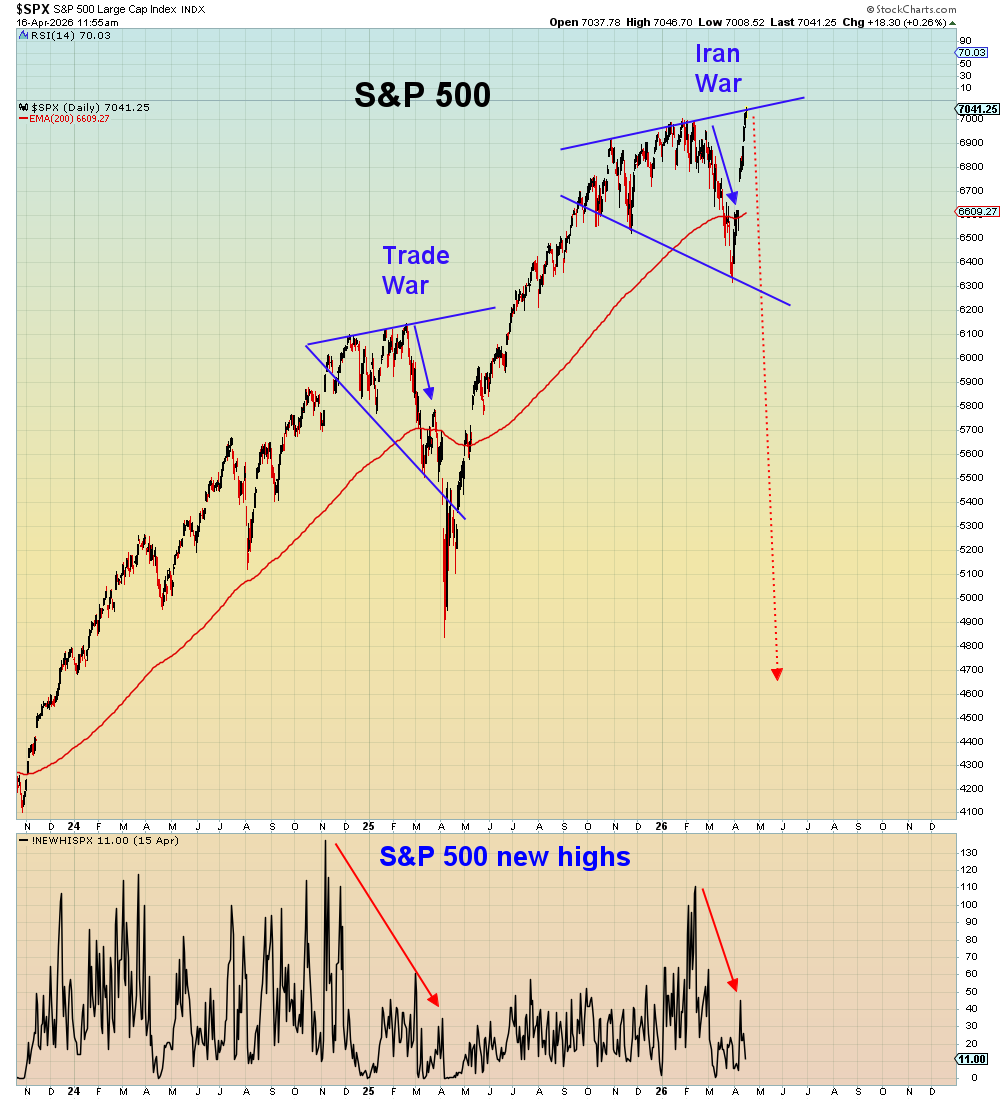
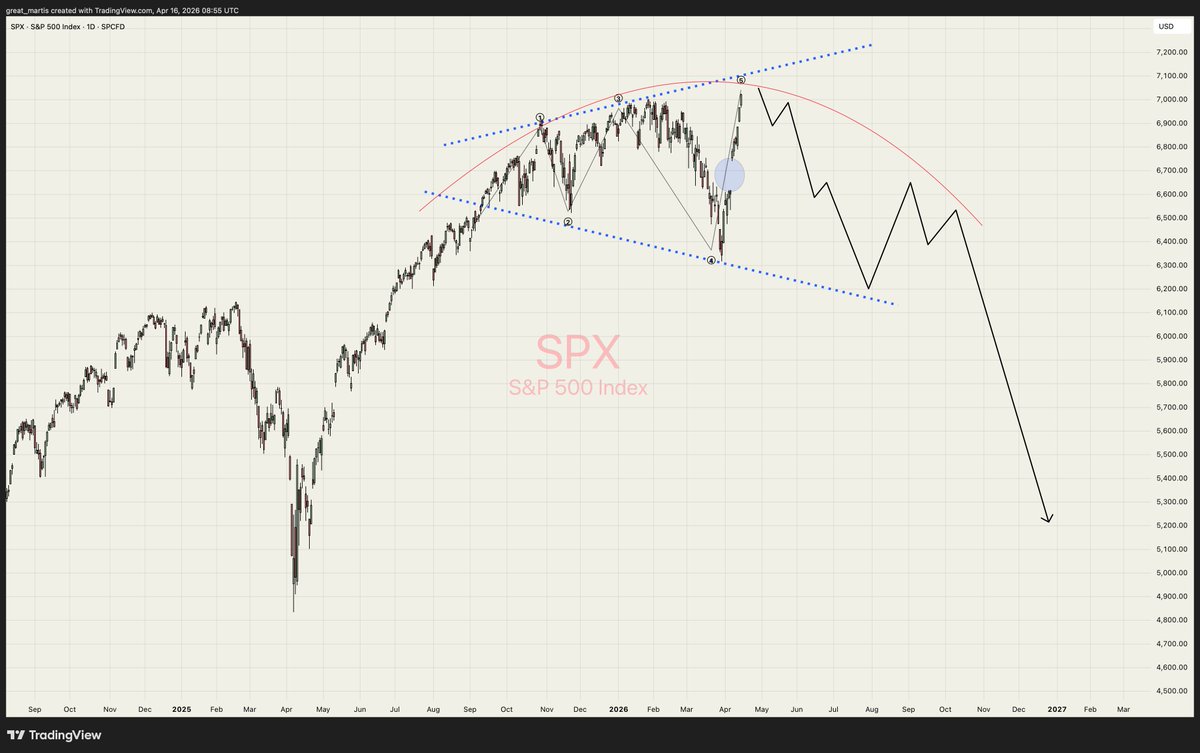
S&P500✨
Worst-case scenario shown .
Broadening pattern in play .
Whilst inflation rockets higher, bonds are coiling ready to implode, and the stock market is trading just below dot-com bubble valuations… while the Buffett Indicator is blasting into the exosphere in uncharted territory.
This looks like a market drowning in fairy dust luring the cattle to one last blowout party… where the venue is the abattoir.
Remain vigilant, stay diligent and most of all stay informed.
Yours truly,
The Great Martis✨
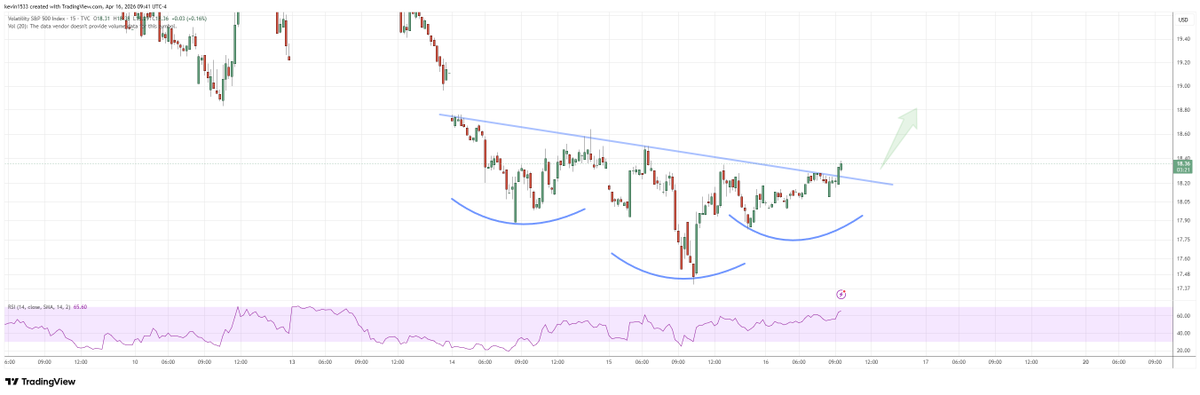
Apr. 16, 2026 Day Trade Plan:
--------------------------------
let me start this post by saying i am very sensitive and aware of moving goal posts - i despise it when i see people do it, and i don't use methodologies that encourage it. this is one of the reasons why i stopped using elliott wave analysis decades ago in the early part of my journey. so i am very careful about the words i am using in what i am about to share
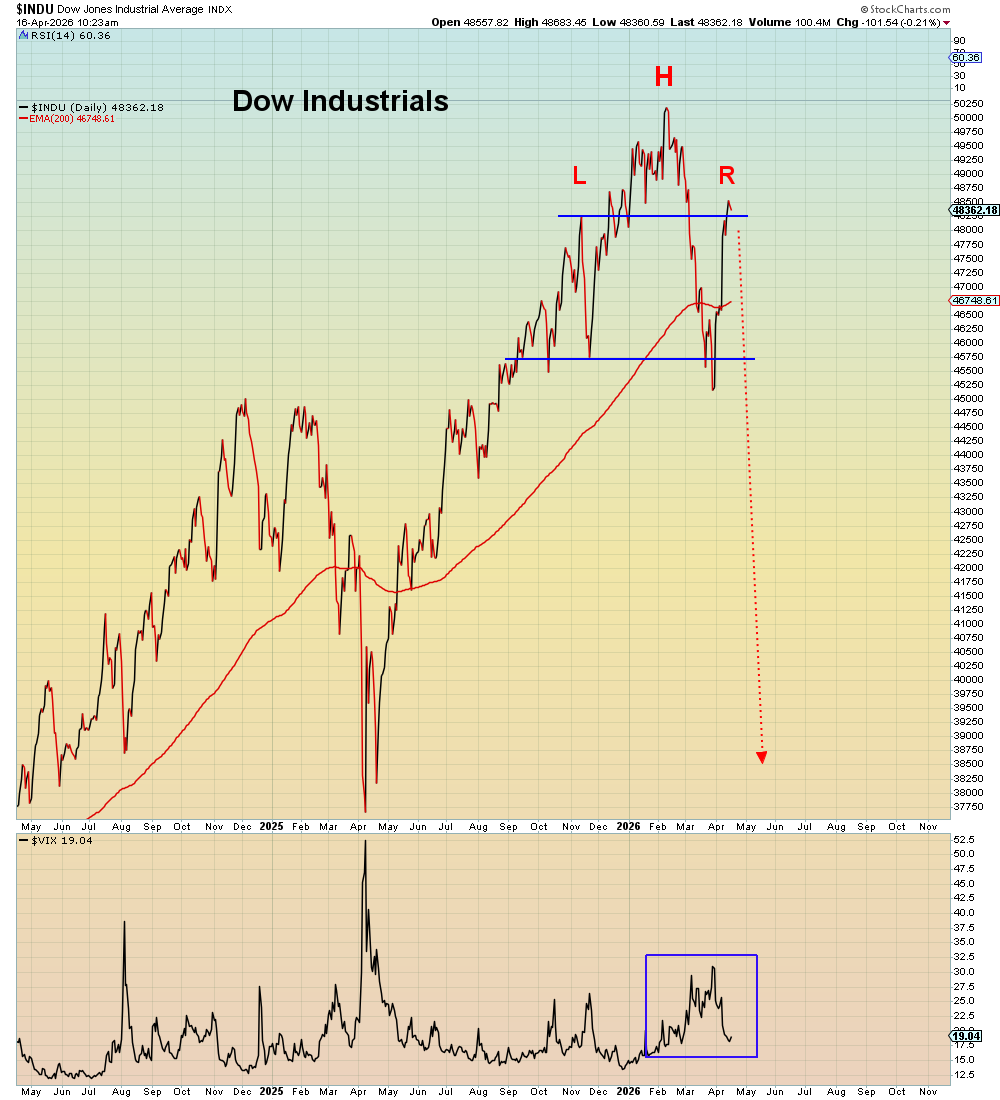
the wyckoff distribution pattern is very close to being invalidated after the massive rally that was detonated on the ceasefire news. as i described weeks ago, i was anticipating a countertrend rally bounce back up as the short positioning was excessively overcrowded. this is why i was not short the market and mostly in cash even as i was still scalping in and out of long uso positions. what i did not anticipate was the size of the rally to new all time highs without any pullbacks. but here we are
so, is the wyckoff distribution from last october invalidated? it will be, if this is not the final UTAD. the recent low we cranked out could have been an mSOW or a minor Sign of Weakness. this low would have punctured underneath the horizontal distribution box before rocketing back up to a new ATH to print the final UTAD. of course, the rally will have to fail for the UTAD to be printed, LPSY to set it, and the MSOW or Major Sign of Weakness to be locked in
the good news is that we don't have to wait much longer given where we are - any price movement much higher, especially if there is a drop and successful retest before moving back up will definitively invalidate the wyckoff. conversely, any major move back down - and it will have to be a swift move all the way back down once it starts - would keep the wyckoff alive
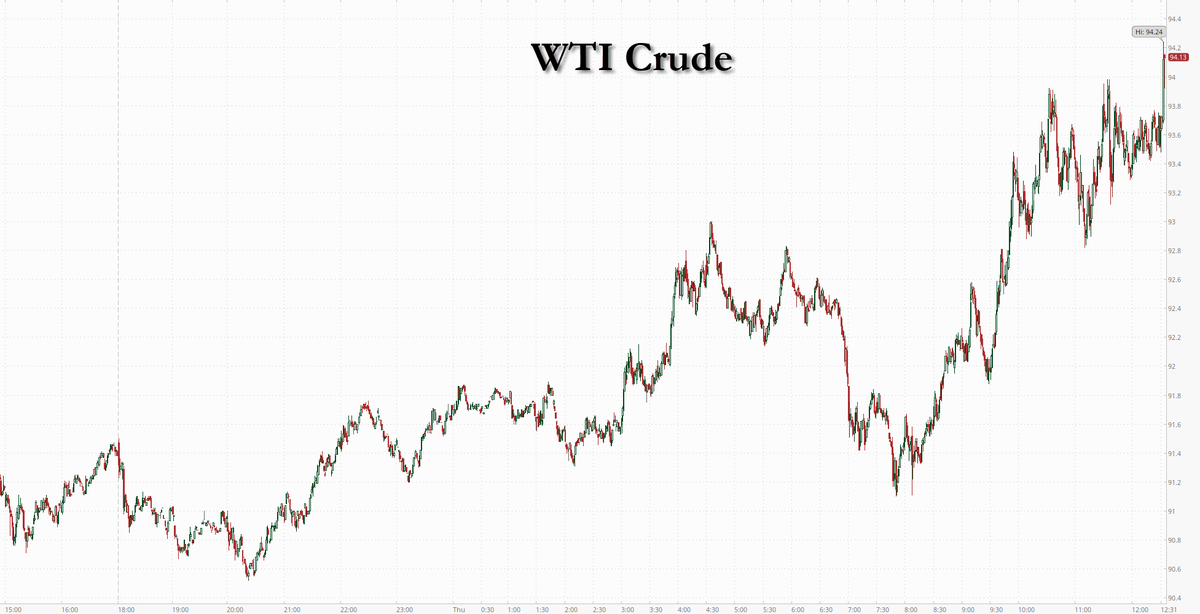
as always, patience is key and refraining from the impulse to front-run and jump the gun is the discipline. once the signals are clear, i will be ready to take action long or short. until then, i continue to remain mostly in cash and just deploy scalp positions for long uso trades