A platform for investors to discuss ideas, strategies & find latest finance news.
Manage your finances by simply copying the trades of professional investors.
We very strongly believe in the future of our economy and hope to see Nifty at 50000 in near future.
Its not a farfetched dream as we feel that we are taking all the right steps to achieve it
VANDE MATRAM
JAI HIND!!
#stocks#Nifty#finance#Rakeshjhunjhunwala#IndependenceDay
We at TradesAid wanted to wish you a Very Happy Independence Day & we thought what better way then showing you where our economy is headed
Here is the chart of Nifty50 breaking out of the Trendline and should move towards its all time high
#StockMarket#Nifty#IndependenceDay
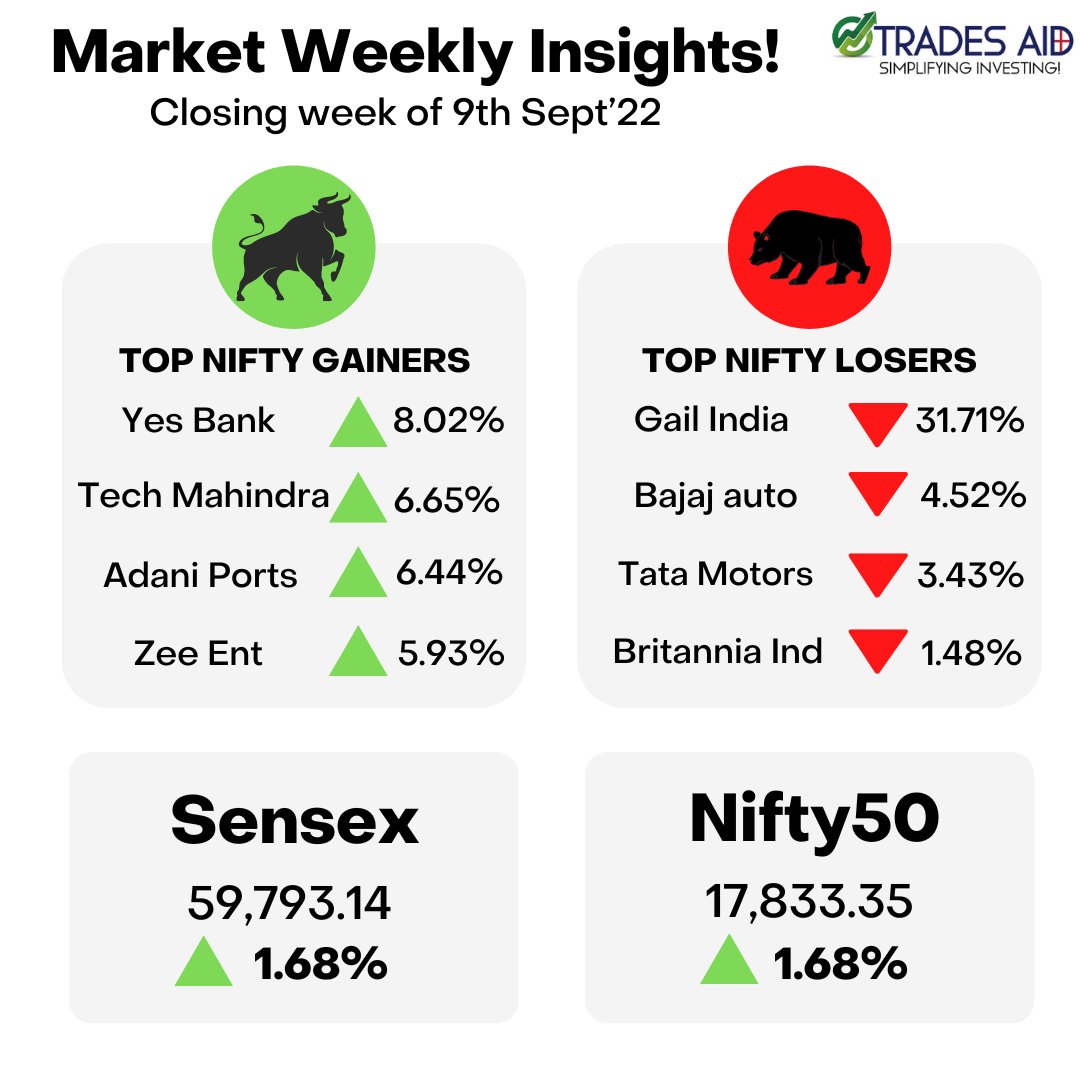
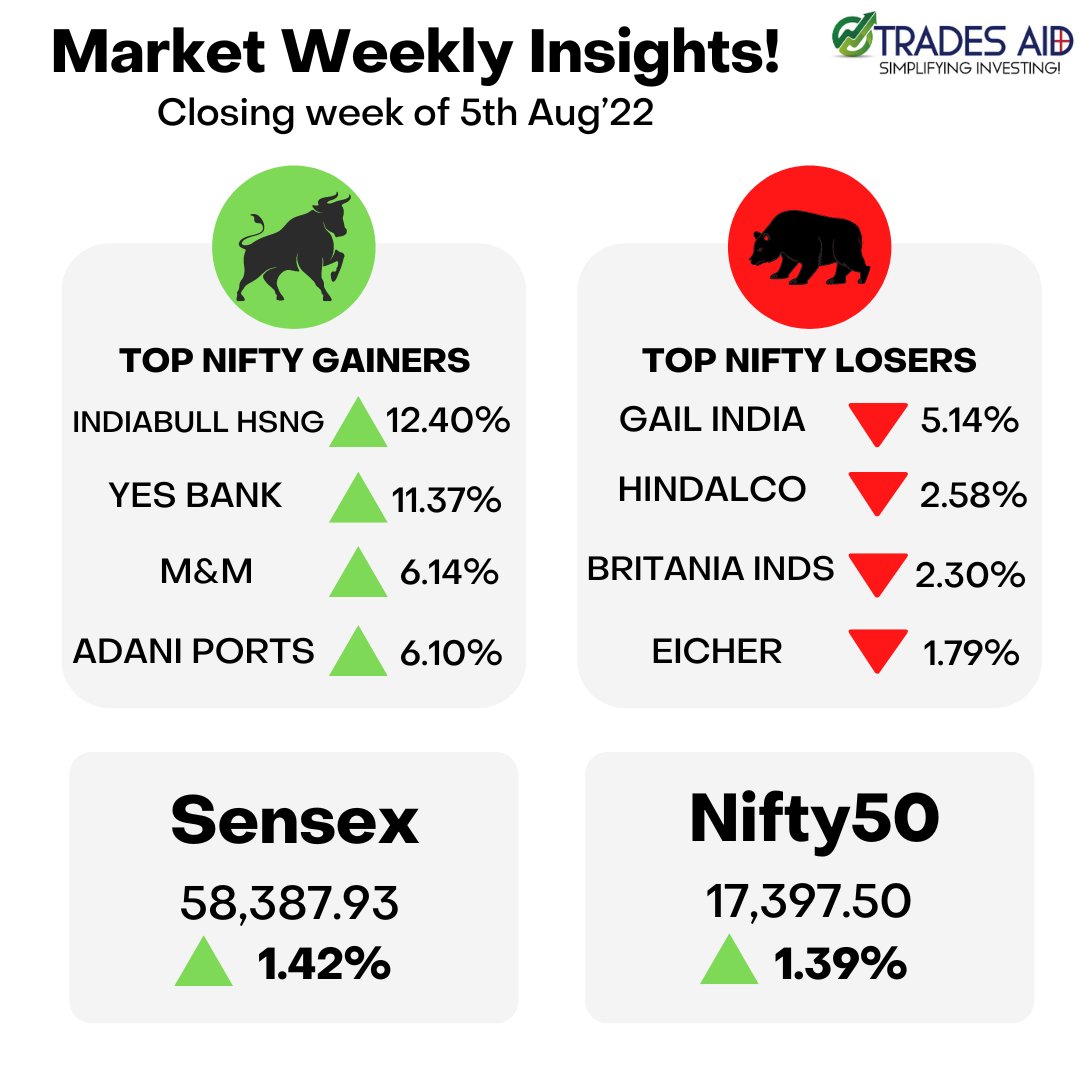
Market extended their uptrend as it ended in green🔺
Here is your weekly summary
Weekly charts show a trendline break in Nifty which should take it to its all time high levels.
We will be posting that chart soon
Stay Tuned!!!
#StockMarket#stocks#Nifty#sensex#Finance
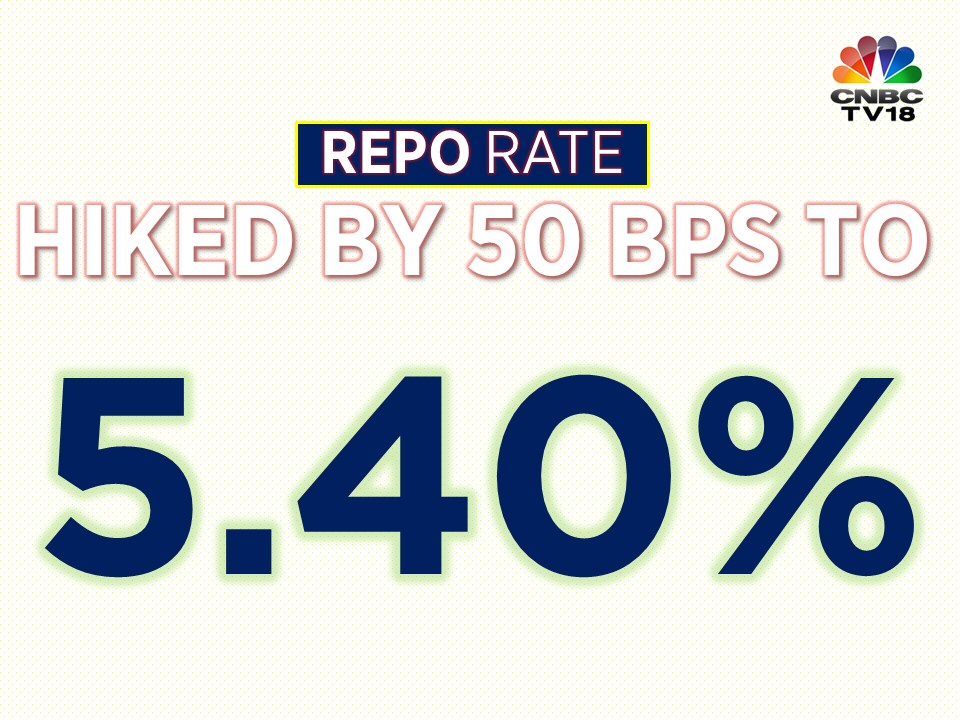
#RBIPolicy | @RBI’s Monetary Policy Committee hikes #RepoRate by by 50 bps to 5.40%. Repo rate is now back to pre-pandemic levels, highest since August 2019
The result is the MACD line. A nine day EMA of the MACD called the "signal line," is then plotted on top of the MACD line, which can function as a buy and sell signal. Traders may buy when the MACD crosses above its signal line and sell when the MACD crosses below the signal line
Moving average convergence divergence (MACD) is a trend-following momentum indicator that shows the relationship between two moving . The MACD is calculated by subtracting the 26-period exponential moving average (EMA) from the 12-period EMA. Read more👇
#StockMarket#education