Founder of the independent project "Trade Waves / Elliott Wave Analysis" dedicated to the analysis of financial markets based on the theory of #ElliottWaves.
Hey friends, I’ve published a comprehensive #ElliottWave analysis on #Tesla#TSLA stock in our Telegram channel (link in the profile description). The article features in-depth commentary in both English and Russian.
Feel free to check it out and explore!
.
#tradewaves
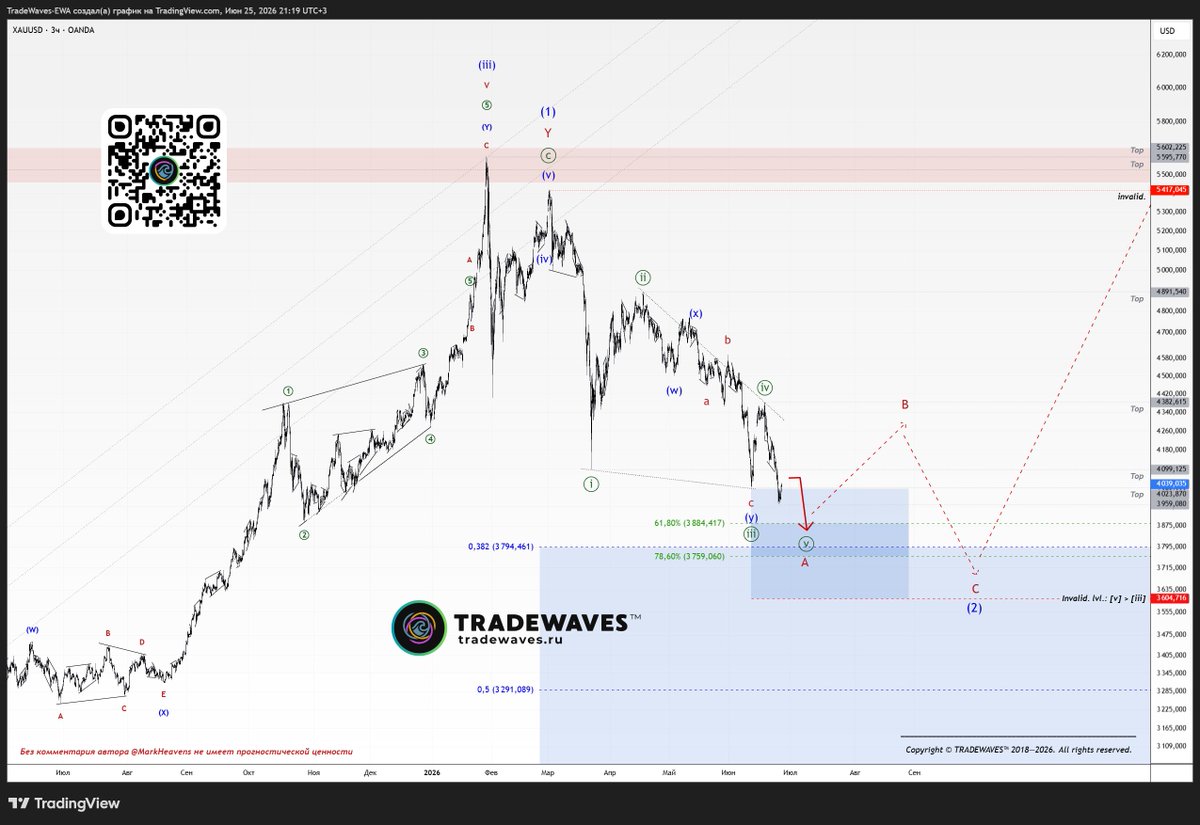
@freetradelife And here’s that very trading setup when we made our forecast for a gold price increase. Note the date — this forecast was published on July 28. At that time, the price was fluctuating around $4000.
Join us so you don’t miss out on trading opportunities!
https://t.co/foVHZBm6Ii
#Gold (#XAUUSD)
Wow, that’s impressive! While most #ElliottWave analysts were predicting further declines in the gold price, we were expecting a rise — specifically in wave B (Fig. 4), strictly following our own wave count.
https://t.co/gasFx2SvwM
.
#tradewaves
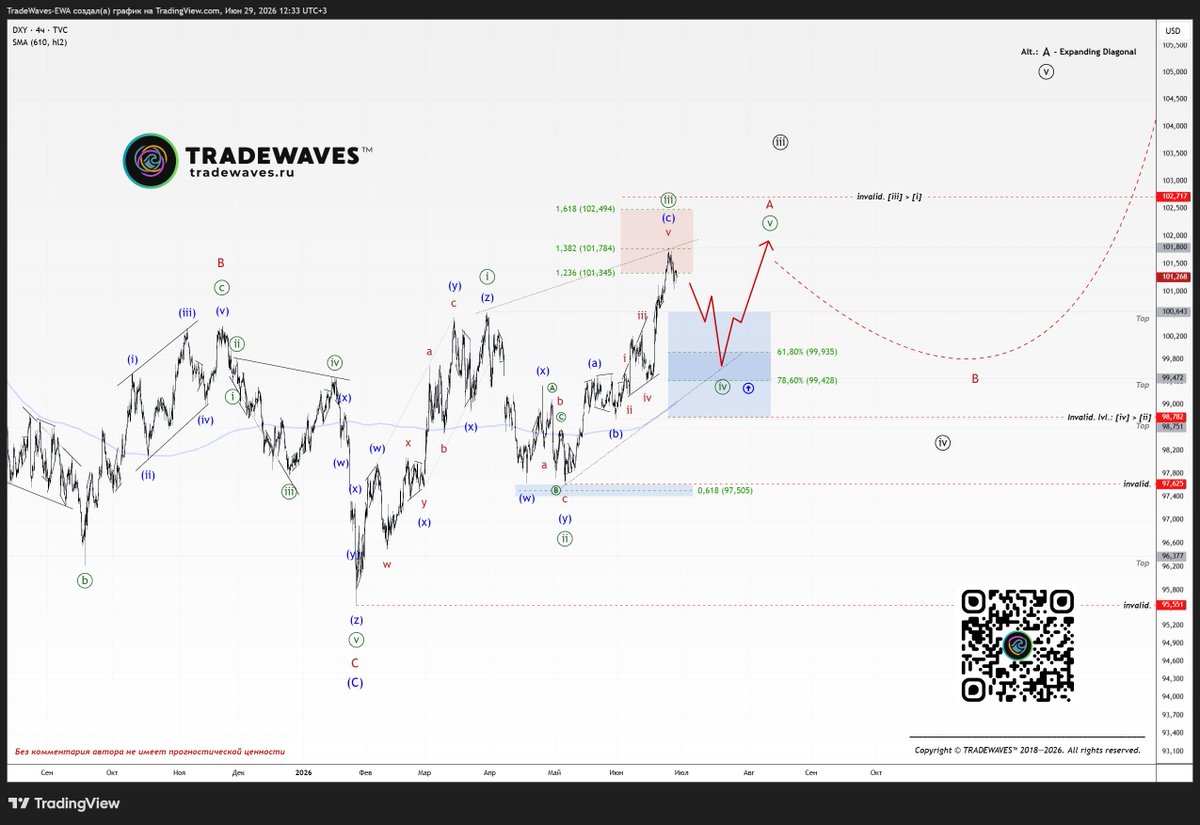
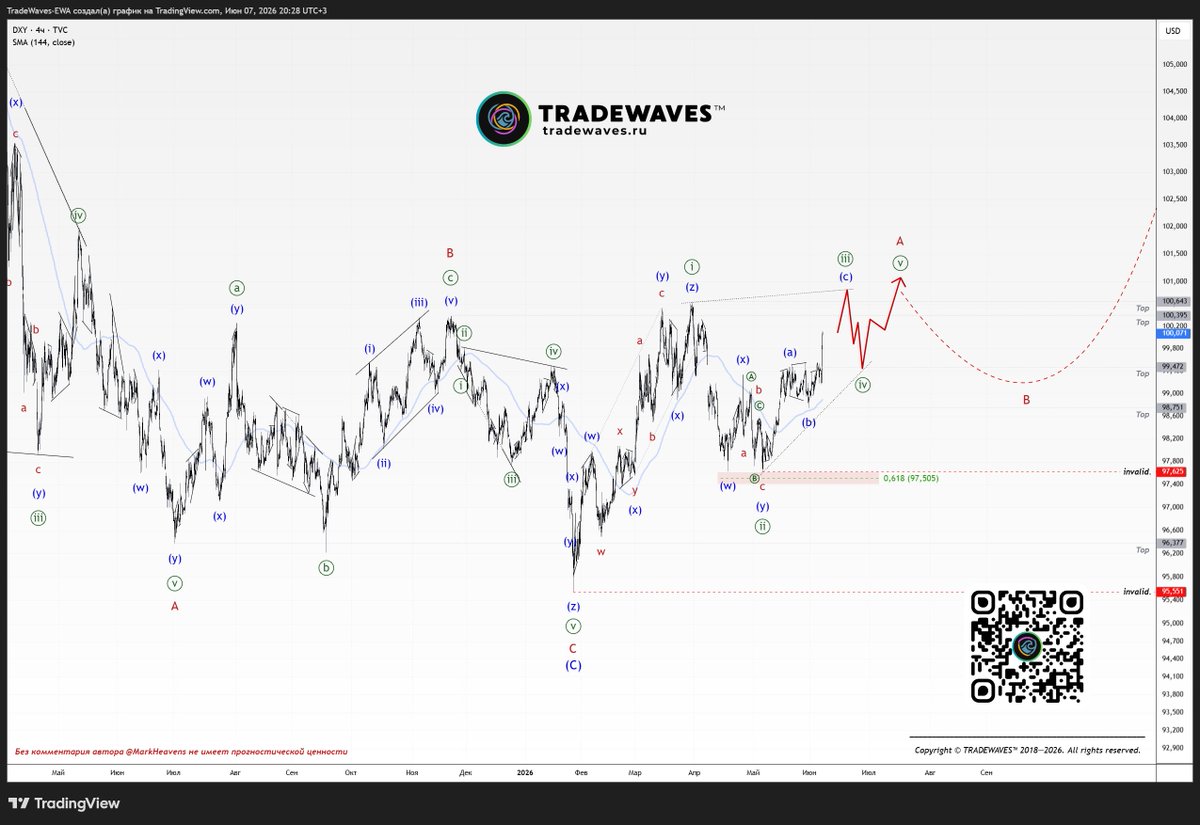
U.S. #DollarIndex (#DXY)
We weren't watching the Fed rate decision—we were focused exclusively on the Elliott Wave count!
Previous forecast: https://t.co/mc1elGzSNd
Join us! https://t.co/gasFx2SvwM
.
#tradewaves#elliottwave
#Brent Crude Oil
45% rally, then a quick 10% drop.
Pro Markets Service signaled oil’s upside just before the surge, and on July 23 flagged a top approaching.
Today: oil fell 10%. What’s next? Get the latest outlook:
https://t.co/gasFx2SvwM
.
#tradewaves#elliottwave
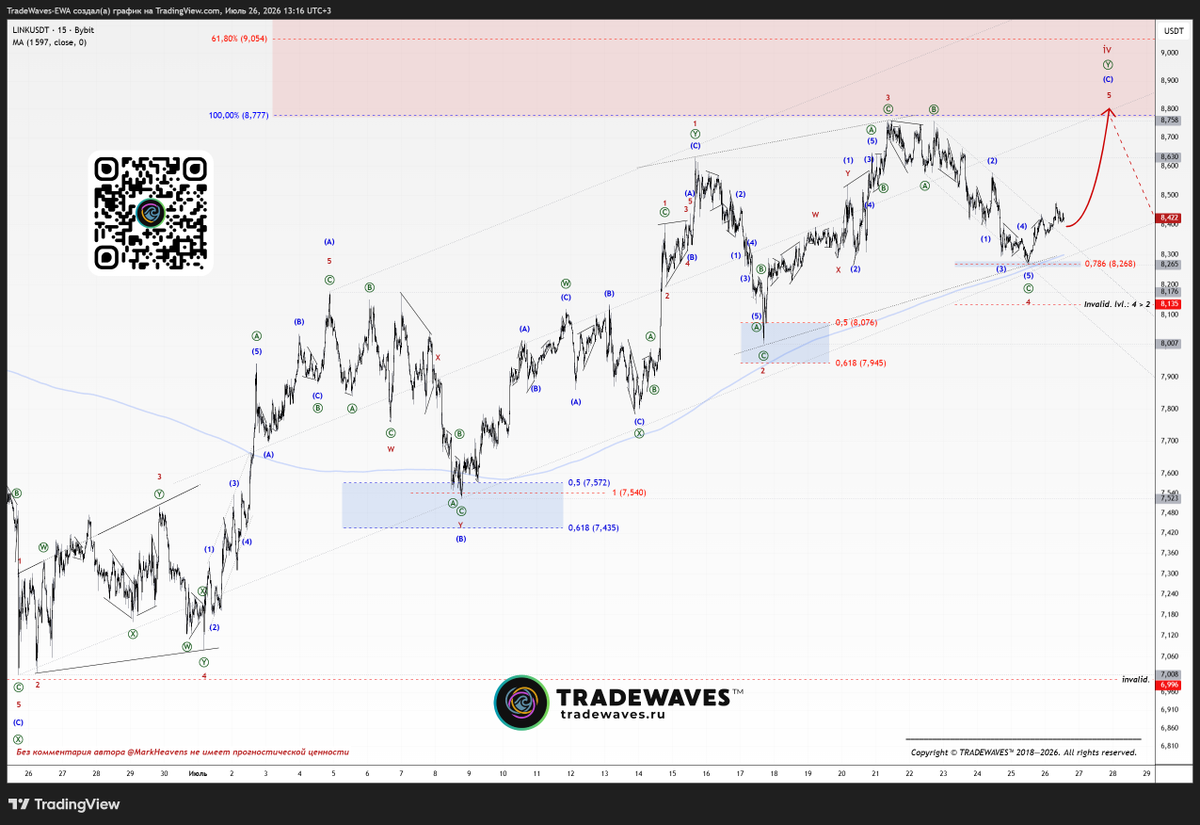
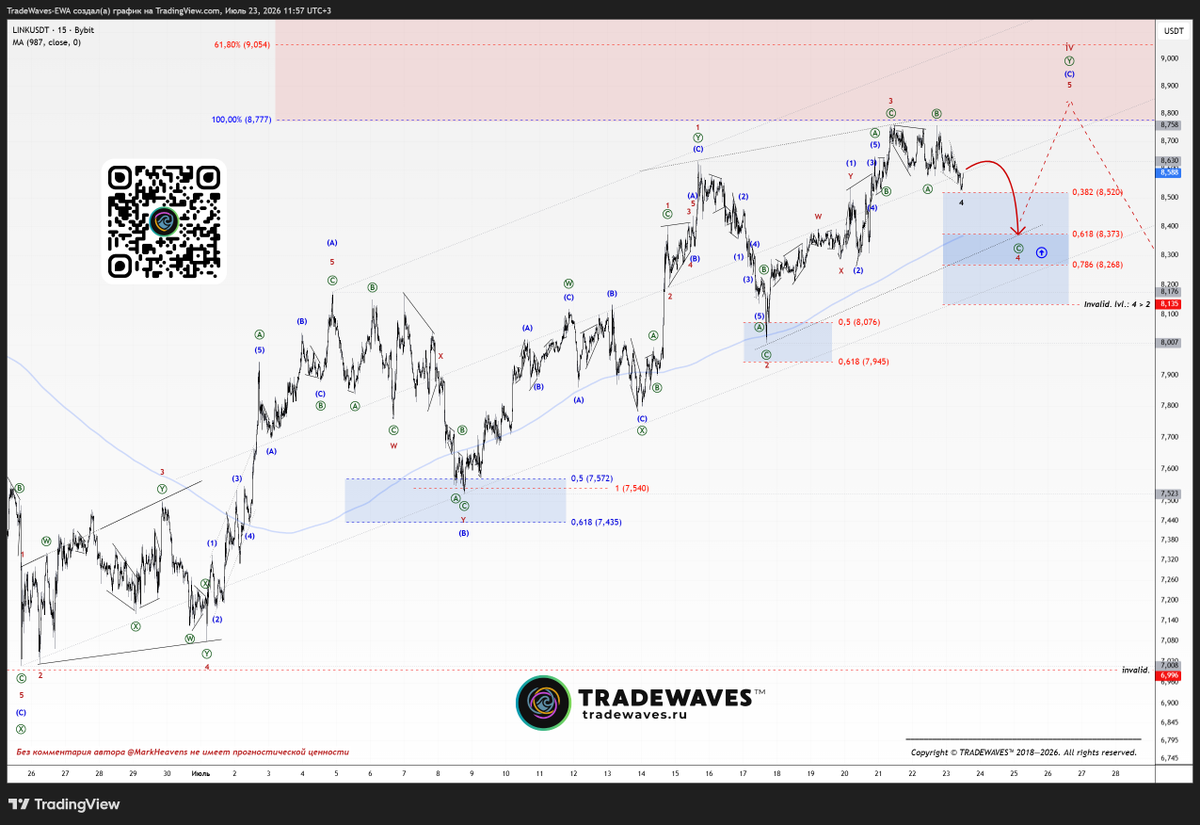
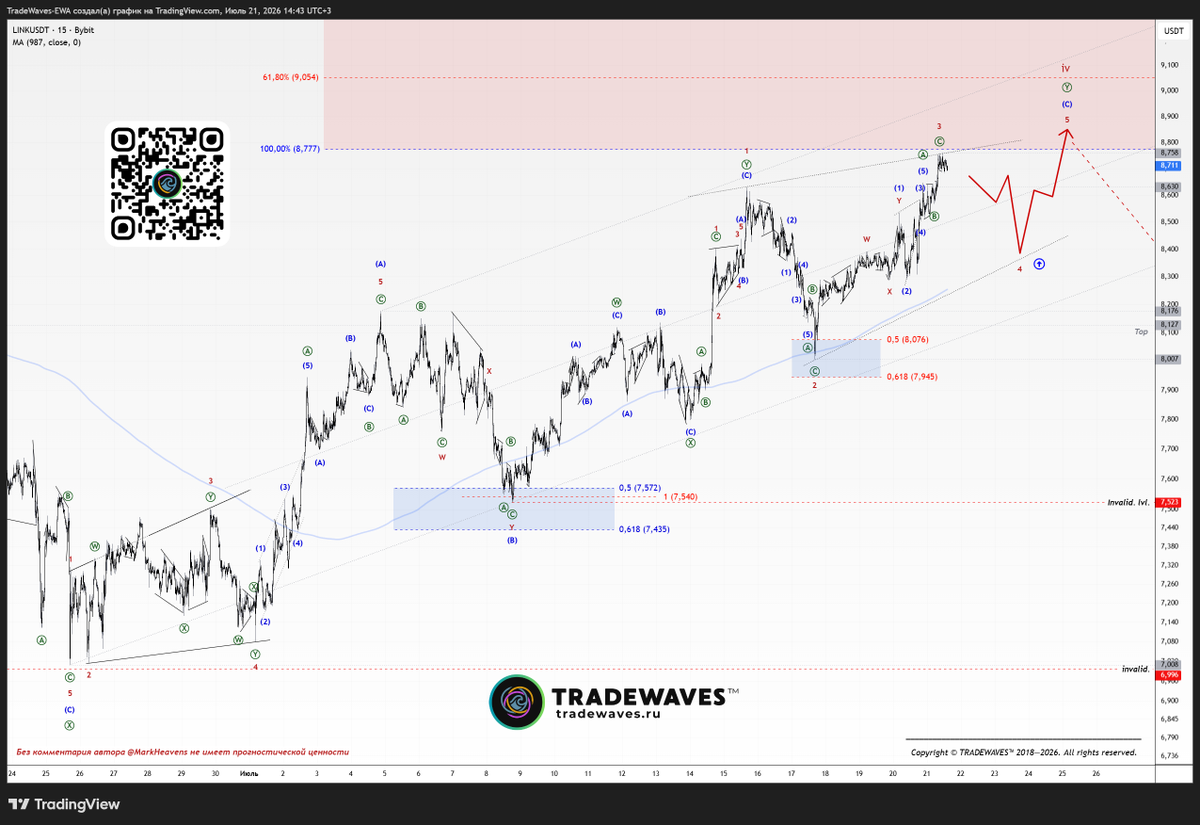
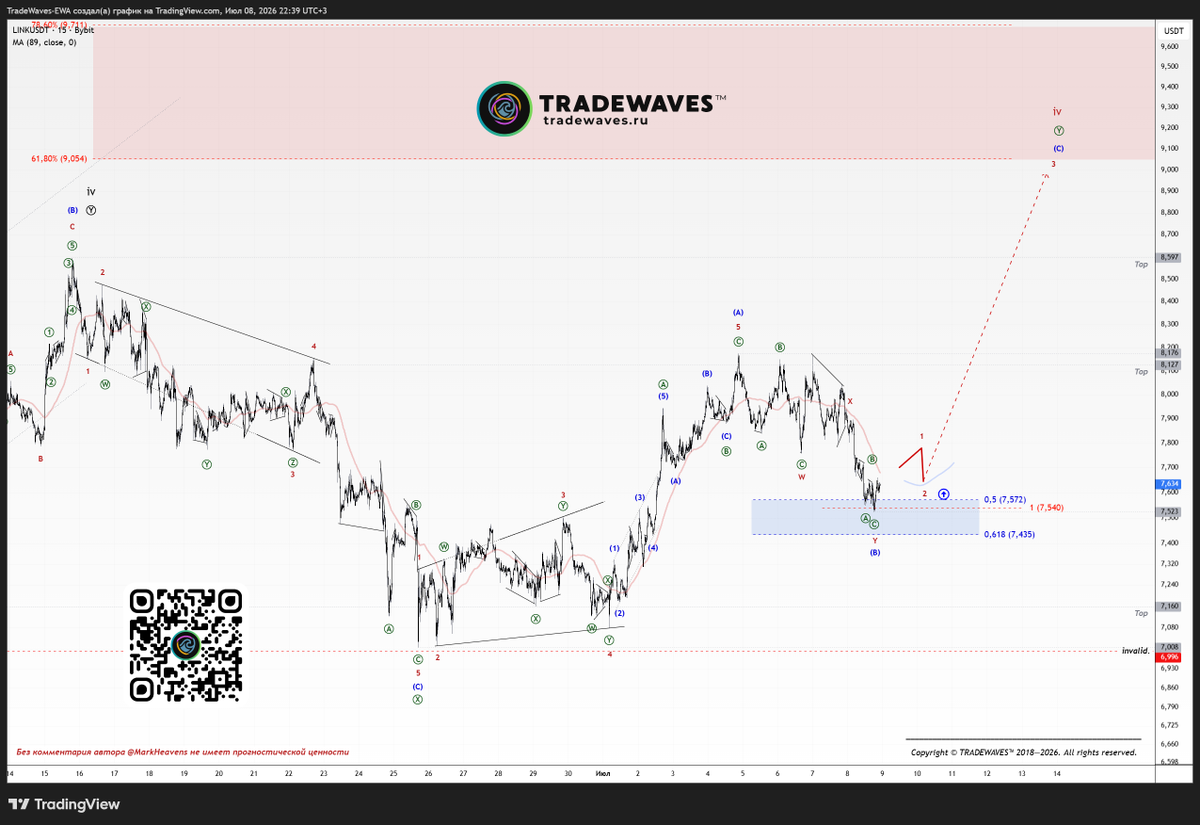
#ChainLink#LINK
Here is a clear example of our #Elliottwave analysis on the 15-minute chart of ChainLink (LINK).
In addition to LINK, the Pro Crypto service provides detailed wave counts for #BTC, #ETH, #LTC, #SOL, and #GRAM.
➡️Join us: https://t.co/gasFx2SvwM
.
#tradewaves
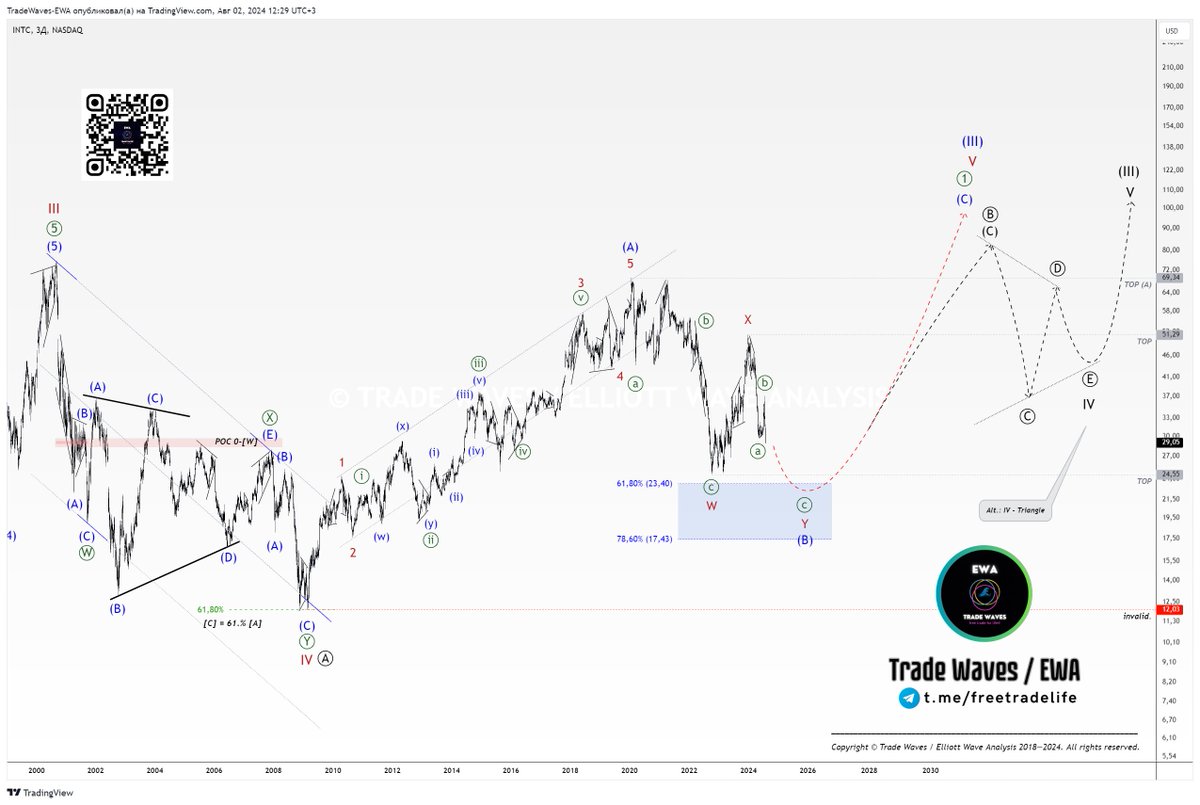
#Intel Corporation (#INTC) 1/4
📈Fig. 1: Two years ago, we were expecting the completion of a downward correction within wave (B). It was assumed that the correction would take the form of a double zigzag W-X-Y, ending in the 23.40–17.43 range.
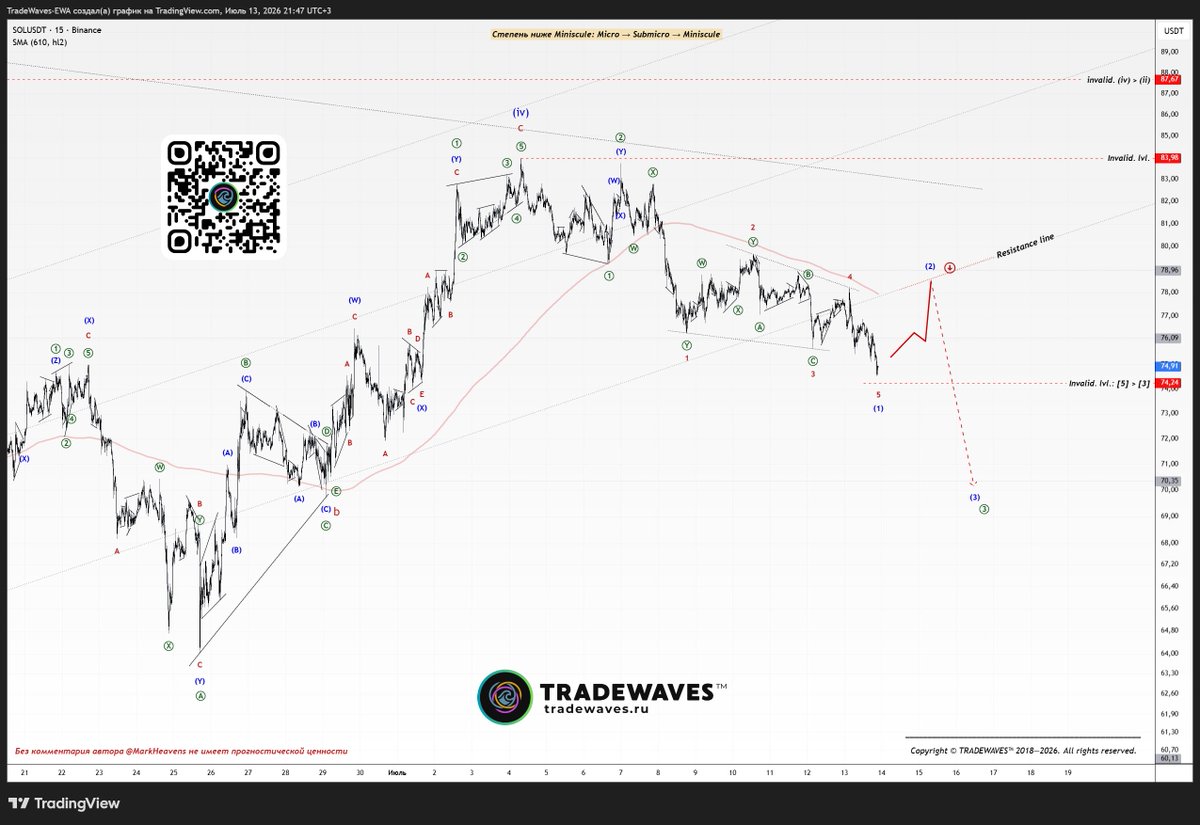
#Solana#SOL
I've noticed that I have less and less time to spend on social media, as I'm now devoting almost all of my time to #Elliottwave analysis within the closed part of the project: https://t.co/gasFx2SvwM
Tomorrow, I will publish my #wavecount for #INTC for you.
U.S. Dollar Index (#DXY)
📈 We update our wave counts on dozens of trading instruments almost daily:
Forex, commodities, stock indices and shares, cryptocurrencies.
Be sure to join us!
https://t.co/gasFx2SvwM
.
https://t.co/PVLg2qIPqy
💡 #Ethereum (#ETH): Partial Forecast Fulfillment. What’s Next?
👋 Hey friends! Missed me?
I've prepared an analytical review of Ethereum for you. The article has been translated into English and published in our Telegram channel (see BIO).
.
#Elliottwave ethereum:native
EUR / U.S. Dollar: Flat — Ⓧ — Triangle
📈 Fig. 1: We've been tracking the sideways movement in wave Ⓧ for over three years now—we predicted the start of the up move in subwave (C) of the triangle right from the 2022 lows.
At this point, most of the path within subwave (C) has already been covered; a zigzag decline in wave (D) is now on the horizon.
📈 Fig. 2: I also consider the implementation of our medium-term forecast to be highly successful. Having identified the upward structure as a double zigzag (wave ⓘ within A in the current wave count), and taking into account that a double zigzag already exists within the sideways move of Ⓧ (wave (B)), we predicted that the next upward structure would unfold as a diagonal - https://t.co/KR11fNpX1J.
The diagonal has now been completed. At present, it is assumed that this pattern is positioned as subwave A of the zigzag (C).
📈 Fig. 3: Subwave B is most likely forming a flat with an ending diagonal at its end.
Once the diagonal is complete, a trading setup for a long position will be formed.
We analyze the 15–30 minute charts three times a week in the Pro Markets subscription: https://t.co/6NJly7BAmk.
.
Pro Services: https://t.co/UeHbkSLoor | https://t.co/aeetZzlfYj
Telegram: https://t.co/AeoMho0dGR
.
#TRADEWAVES #Elliottwave #ВолновойАнализ $EUUSD #EURUSD #Forex
#Nvidia (#NVDA): Ending Diagonal or Leading Diagonal — That is the Question
I’ll show you several marking options, all based on the same wave structure.
I want to emphasize: I have no doubt that in this particular case, the already completed structure has been interpreted correctly and cannot be seen in two or more ways—for example, as either an impulse or a zigzag. What I’m actually doing is shifting wave degrees, so that the same impulsive pattern can be counted either as the first wave of a larger impulse, or as wave A of a zigzag, which in turn could serve as the first wave of a diagonal, and so on.
I hope I haven’t overloaded you with information right from the start! The key point is: with the same set of "puzzle pieces," Elliott Wave Theory can suggest only a limited number of possible scenario developments. However, most of the time, there are still several options to consider.
🟢Option 1
📈 Fig. 1: All three versions are not new and were proposed by me back in the summer of 2023 in the private part of the Pro Stocks project (https://t.co/6NJly7C8bS).
So, the first scenario shown in Fig. 1 suggests viewing the rally from the top of Primary ④ (3.68) as an A-B-C zigzag, which serves as wave (1) of the ending diagonal ⑤.
📈 Fig. 2: Wave C of zigzag (1) is unfolding as a diagonal, currently in the process of developing subwave [iv].
We know that in a diagonal, wave "4" must end within the territory of wave "1" (i.e., there must be an overlap), but it is not allowed to exceed the length of wave "2". By applying the technique for setting targets in diagonals, we can determine the potential range for the correction to complete. In this case, the range is 153.73–144.43.
☝️ If these conditions are not met, the current wave count will need to be revised—most likely in favor of complicating wave ⓘ within diagonal C into a double zigzag (w)-(x)-(y).
🟠Option 2
📈 Fig. 3: The second option, which is in some ways even more harmonious, suggests that the rally from the top of cycle wave IV (0.2163) is an (A)-(B)-(C) zigzag within the first wave of diagonal V.
As we can see, the difference from the first scenario is only that the diagonal is forming within a higher-degree wave. As a result, the ultimate range of the model can be significantly wider.
🔴Option 3
📈 Fig. 4: And finally, the last scenario for today is an aggressively bullish count, in which, apparently, two extended subdivisions—① and ③—are expected within impulse wave V.
Each of the presented wave counts offers trading opportunities under certain conditions, and each can also be ruled out—again, if specific conditions are met. Clues in favor of one scenario or another can be sought on the S&P 500 and NASDAQ 100 indices, where Nvidia holds leading positions.
☝️We monitor setups on the 40-minute chart every Wednesday in the private section of Pro Stocks (https://t.co/6NJly7C8bS), and update the long-term scenario as necessary.
.
Pro Services: https://t.co/UeHbkSLWdZ | https://t.co/aeetZzlNNR
Telegram: https://t.co/AeoMho0Lwp
.
#TRADEWAVES #Elliottwave #ВолновойАнализ $NVDA
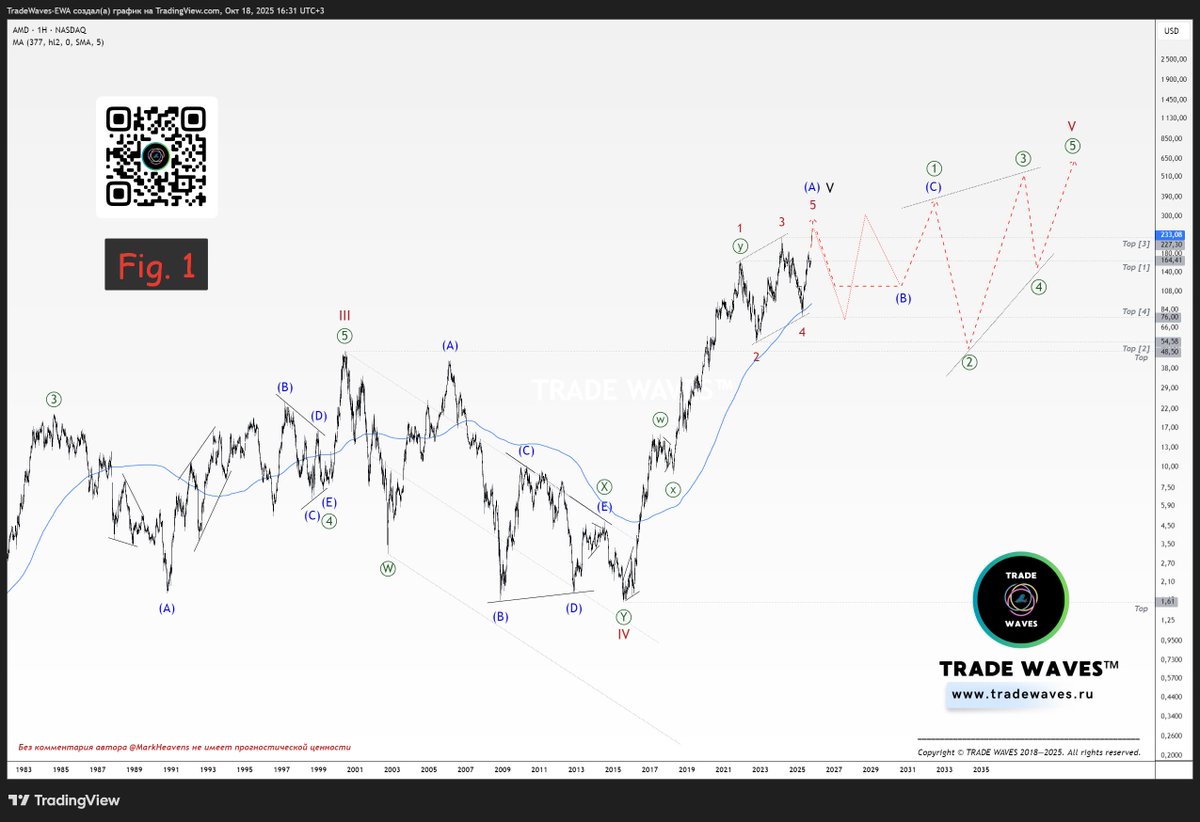
💻Advanced Micro Devices (#AMD)
📈 Fig. 1: The assumption that the upward structure is forming a diagonal was made back in 2023 as part of the closed premium analytics by Pro Stocks. Now, at the end of 2025, we can say with confidence that our forecast was correct — a clear diagonal pattern has indeed emerged, with the final subwave 5 now approaching completion within it.
📈 Fig. 2: Wave 5 of diagonal (A) must exceed the level of 248.27, but should not rise above 316.50. It is within this price range—248.27 to 316.50—that the completion of diagonal (A) is anticipated, followed by the start of a deep and prolonged correction as part of wave (B).
📈 Fig. 3: Let’s once again discuss the targets for the completion of diagonal (A), this time referring to a visual illustration of the diagonal on both logarithmic and linear scales.
📏 Logarithmic scale (left):
A contracting diagonal is forming. Wave 5 must not exceed wave 3 when measured in percentage terms. The critical level here is 316.50.
📏 Linear scale (right):
An expanding diagonal is in progress. In this case, wave 5 must exceed the length of wave 3 in absolute points. The minimum target is to break above the 248.72 level (note: this level is shown incorrectly on the chart).
.
Pro Services: https://t.co/UeHbkSLoor | https://t.co/aeetZzlfYj
Telegram: https://t.co/AeoMho0dGR
.
#TRADEWAVES #Elliottwave #ВолновойАнализ $AMD
#Bitcoin
🔄We are concluding the current cycle of Elliott Wave count updates for #BTC#cryptocurrency.
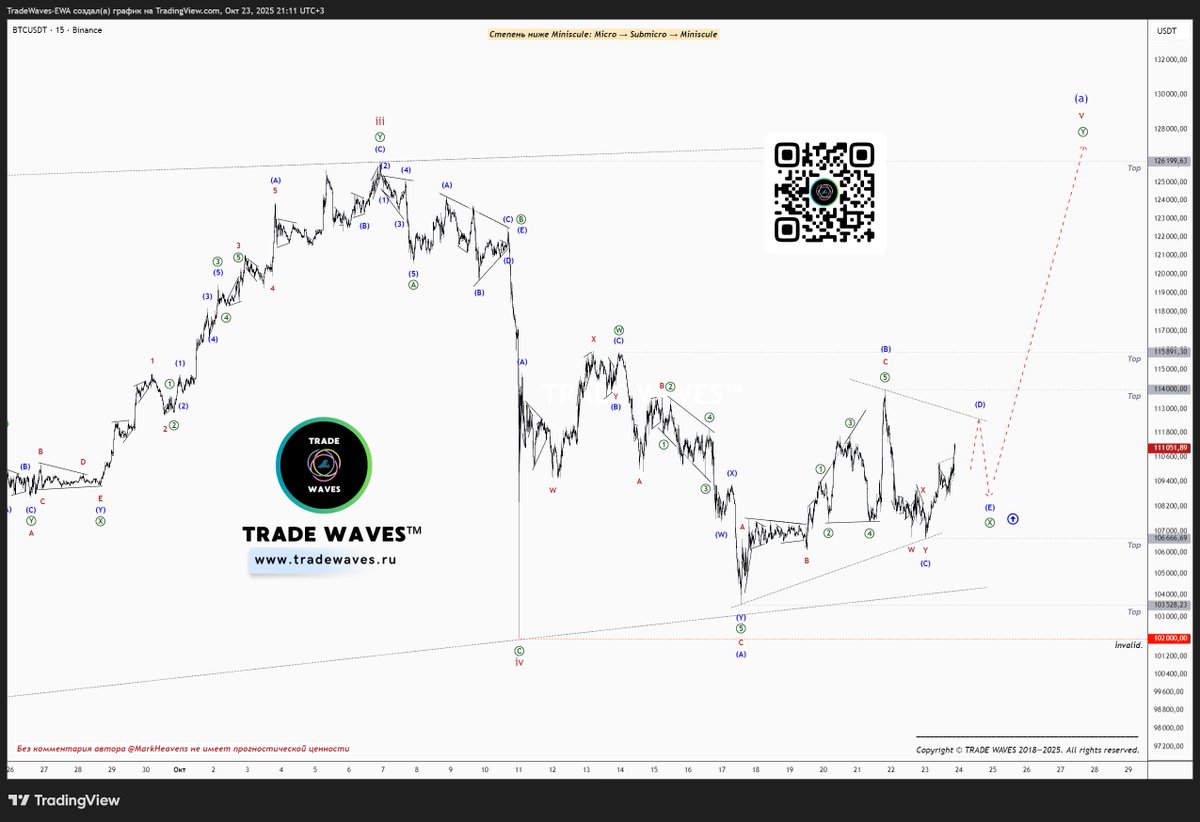
📈 Fig. 1: On October 23, Pro Crypto subscribers received an updated wave count stating that wave Ⓧ would most likely take the form of a triangle. We also indicated that a trading setup for a long position would be formed once the sideways pattern is complete.
📈 Fig. 2: Most likely, this is exactly how it played out: wave Ⓧ is a triangle with the orthodox bottoms at 109,700.01. Now, a zigzag Ⓨ is forming, targeting a new high above 126,199.63.
☝️You can continue receiving Elliott Wave count updates at least three times a week on 6–15 cryptocurrencies by subscribing to Pro Crypto:
https://t.co/pej6ZMcoWi
or https://t.co/n6mVBz7xPF
Telegram: https://t.co/vyJMuDuj3Z
.
#TRADEWAVES #Elliottwave #BTCUSD #Биткоин
#Bitcoin
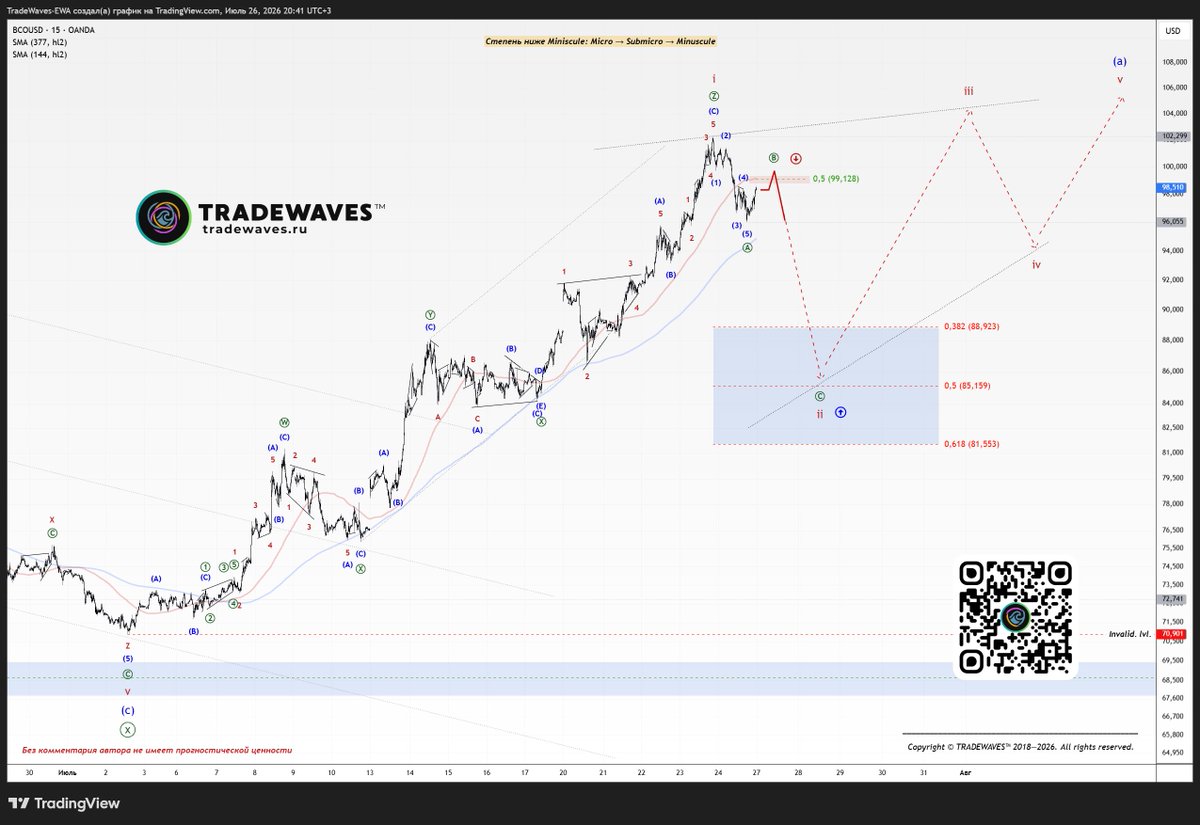
🔄 Currently, we are considering a scenario that suggests the development of a double zigzag within the final subwave v of the diagonal (a).
The double zigzag appears to have completed subwaves Ⓦ and Ⓧ, with the final subwave Ⓨ now emerging.
⚠️ We recommend waiting for confirmation of the bullish count, namely the formation of subwaves (A) and (B).
📉 If the price continues to decline and the 102,000.00 low is breached, there will remain a possibility that wave iv of the diagonal (a) is further complicating its structure into a Ⓦ-Ⓧ-Ⓨ double zigzag.
Pro Services: https://t.co/pej6ZMcWLQ
Telegram: https://t.co/vyJMuDuQTx
.
#TRADEWAVES #Elliottwave #BTCUSD #BTC #Биткоин
#Bitcoin
I don’t always manage to share forecasts on X, but as I have mentioned before, you can always subscribe to our free Elliott Wave report updates in our Telegram channel, or get a Pro subscription: https://t.co/6NJly7BAmk
📈 Fig. 1 and 2: Hope everyone is safe and well. Take care!
Let me start by saying that I see no viable way to complete the double zigzag ⓦ-ⓧ-ⓨ in wave 1 at the 126199.63 high. Therefore, my primary scenario assumes a continuation of the uptrend.
It is assumed that we are witnessing a continuation of the formation of the leading diagonal in wave (a) of ⓨ — the pattern now appears to be in the early phase of forming the final subwave v.
In this wave count scenario, the following wave (b) may well unfold as a sideways corrective structure, potentially finishing above the critical 0-ⓧ line.
"EWI: In a double zigzag, as a guideline, wave b of wave Y should be smaller than wave X. In addition, wave b of wave Y should not break the trendline that connects the beginning of wave W with the end of wave X."
The critical level for subwave iv of the (a) diagonal is at 90851.20. Should this level be broken, it would likely mean that — in a way still unclear to me — the double zigzag in wave 1 has already completed, and we should expect further downward correction in wave 2 towards the ~57000 area (Fig. 2).
📈 Fig. 3: If we consider the bullish alternative, which assumes a series of first and second waves developing in the upward direction, then a similar wave count suggests itself: a continuation of the formation of the leading diagonal.
📈 Fig. 4: Wave count option for the 15-minute chart.
Pro Services: https://t.co/6NJly7BAmk Telegram: https://t.co/AeoMho0dGR
.
#TRADEWAVES #Elliottwave #BTCUSD #BTC #Биткоин












![freetradelife's tweet photo. #Nvidia (#NVDA): Ending Diagonal or Leading Diagonal — That is the Question
I’ll show you several marking options, all based on the same wave structure.
I want to emphasize: I have no doubt that in this particular case, the already completed structure has been interpreted correctly and cannot be seen in two or more ways—for example, as either an impulse or a zigzag. What I’m actually doing is shifting wave degrees, so that the same impulsive pattern can be counted either as the first wave of a larger impulse, or as wave A of a zigzag, which in turn could serve as the first wave of a diagonal, and so on.
I hope I haven’t overloaded you with information right from the start! The key point is: with the same set of "puzzle pieces," Elliott Wave Theory can suggest only a limited number of possible scenario developments. However, most of the time, there are still several options to consider.
🟢Option 1
📈 Fig. 1: All three versions are not new and were proposed by me back in the summer of 2023 in the private part of the Pro Stocks project (https://t.co/6NJly7C8bS).
So, the first scenario shown in Fig. 1 suggests viewing the rally from the top of Primary ④ (3.68) as an A-B-C zigzag, which serves as wave (1) of the ending diagonal ⑤.
📈 Fig. 2: Wave C of zigzag (1) is unfolding as a diagonal, currently in the process of developing subwave [iv].
We know that in a diagonal, wave "4" must end within the territory of wave "1" (i.e., there must be an overlap), but it is not allowed to exceed the length of wave "2". By applying the technique for setting targets in diagonals, we can determine the potential range for the correction to complete. In this case, the range is 153.73–144.43.
☝️ If these conditions are not met, the current wave count will need to be revised—most likely in favor of complicating wave ⓘ within diagonal C into a double zigzag (w)-(x)-(y).
🟠Option 2
📈 Fig. 3: The second option, which is in some ways even more harmonious, suggests that the rally from the top of cycle wave IV (0.2163) is an (A)-(B)-(C) zigzag within the first wave of diagonal V.
As we can see, the difference from the first scenario is only that the diagonal is forming within a higher-degree wave. As a result, the ultimate range of the model can be significantly wider.
🔴Option 3
📈 Fig. 4: And finally, the last scenario for today is an aggressively bullish count, in which, apparently, two extended subdivisions—① and ③—are expected within impulse wave V.
Each of the presented wave counts offers trading opportunities under certain conditions, and each can also be ruled out—again, if specific conditions are met. Clues in favor of one scenario or another can be sought on the S&P 500 and NASDAQ 100 indices, where Nvidia holds leading positions.
☝️We monitor setups on the 40-minute chart every Wednesday in the private section of Pro Stocks (https://t.co/6NJly7C8bS), and update the long-term scenario as necessary.
.
Pro Services: https://t.co/UeHbkSLWdZ | https://t.co/aeetZzlNNR
Telegram: https://t.co/AeoMho0Lwp
.
#TRADEWAVES #Elliottwave #ВолновойАнализ $NVDA](https://pbs.twimg.com/media/G7l_BjTXYAAMy-7.jpg)
![freetradelife's tweet photo. #Nvidia (#NVDA): Ending Diagonal or Leading Diagonal — That is the Question
I’ll show you several marking options, all based on the same wave structure.
I want to emphasize: I have no doubt that in this particular case, the already completed structure has been interpreted correctly and cannot be seen in two or more ways—for example, as either an impulse or a zigzag. What I’m actually doing is shifting wave degrees, so that the same impulsive pattern can be counted either as the first wave of a larger impulse, or as wave A of a zigzag, which in turn could serve as the first wave of a diagonal, and so on.
I hope I haven’t overloaded you with information right from the start! The key point is: with the same set of "puzzle pieces," Elliott Wave Theory can suggest only a limited number of possible scenario developments. However, most of the time, there are still several options to consider.
🟢Option 1
📈 Fig. 1: All three versions are not new and were proposed by me back in the summer of 2023 in the private part of the Pro Stocks project (https://t.co/6NJly7C8bS).
So, the first scenario shown in Fig. 1 suggests viewing the rally from the top of Primary ④ (3.68) as an A-B-C zigzag, which serves as wave (1) of the ending diagonal ⑤.
📈 Fig. 2: Wave C of zigzag (1) is unfolding as a diagonal, currently in the process of developing subwave [iv].
We know that in a diagonal, wave "4" must end within the territory of wave "1" (i.e., there must be an overlap), but it is not allowed to exceed the length of wave "2". By applying the technique for setting targets in diagonals, we can determine the potential range for the correction to complete. In this case, the range is 153.73–144.43.
☝️ If these conditions are not met, the current wave count will need to be revised—most likely in favor of complicating wave ⓘ within diagonal C into a double zigzag (w)-(x)-(y).
🟠Option 2
📈 Fig. 3: The second option, which is in some ways even more harmonious, suggests that the rally from the top of cycle wave IV (0.2163) is an (A)-(B)-(C) zigzag within the first wave of diagonal V.
As we can see, the difference from the first scenario is only that the diagonal is forming within a higher-degree wave. As a result, the ultimate range of the model can be significantly wider.
🔴Option 3
📈 Fig. 4: And finally, the last scenario for today is an aggressively bullish count, in which, apparently, two extended subdivisions—① and ③—are expected within impulse wave V.
Each of the presented wave counts offers trading opportunities under certain conditions, and each can also be ruled out—again, if specific conditions are met. Clues in favor of one scenario or another can be sought on the S&P 500 and NASDAQ 100 indices, where Nvidia holds leading positions.
☝️We monitor setups on the 40-minute chart every Wednesday in the private section of Pro Stocks (https://t.co/6NJly7C8bS), and update the long-term scenario as necessary.
.
Pro Services: https://t.co/UeHbkSLWdZ | https://t.co/aeetZzlNNR
Telegram: https://t.co/AeoMho0Lwp
.
#TRADEWAVES #Elliottwave #ВолновойАнализ $NVDA](https://pbs.twimg.com/media/G7l_Ao6XcAEmEWl.jpg)
![freetradelife's tweet photo. #Nvidia (#NVDA): Ending Diagonal or Leading Diagonal — That is the Question
I’ll show you several marking options, all based on the same wave structure.
I want to emphasize: I have no doubt that in this particular case, the already completed structure has been interpreted correctly and cannot be seen in two or more ways—for example, as either an impulse or a zigzag. What I’m actually doing is shifting wave degrees, so that the same impulsive pattern can be counted either as the first wave of a larger impulse, or as wave A of a zigzag, which in turn could serve as the first wave of a diagonal, and so on.
I hope I haven’t overloaded you with information right from the start! The key point is: with the same set of "puzzle pieces," Elliott Wave Theory can suggest only a limited number of possible scenario developments. However, most of the time, there are still several options to consider.
🟢Option 1
📈 Fig. 1: All three versions are not new and were proposed by me back in the summer of 2023 in the private part of the Pro Stocks project (https://t.co/6NJly7C8bS).
So, the first scenario shown in Fig. 1 suggests viewing the rally from the top of Primary ④ (3.68) as an A-B-C zigzag, which serves as wave (1) of the ending diagonal ⑤.
📈 Fig. 2: Wave C of zigzag (1) is unfolding as a diagonal, currently in the process of developing subwave [iv].
We know that in a diagonal, wave "4" must end within the territory of wave "1" (i.e., there must be an overlap), but it is not allowed to exceed the length of wave "2". By applying the technique for setting targets in diagonals, we can determine the potential range for the correction to complete. In this case, the range is 153.73–144.43.
☝️ If these conditions are not met, the current wave count will need to be revised—most likely in favor of complicating wave ⓘ within diagonal C into a double zigzag (w)-(x)-(y).
🟠Option 2
📈 Fig. 3: The second option, which is in some ways even more harmonious, suggests that the rally from the top of cycle wave IV (0.2163) is an (A)-(B)-(C) zigzag within the first wave of diagonal V.
As we can see, the difference from the first scenario is only that the diagonal is forming within a higher-degree wave. As a result, the ultimate range of the model can be significantly wider.
🔴Option 3
📈 Fig. 4: And finally, the last scenario for today is an aggressively bullish count, in which, apparently, two extended subdivisions—① and ③—are expected within impulse wave V.
Each of the presented wave counts offers trading opportunities under certain conditions, and each can also be ruled out—again, if specific conditions are met. Clues in favor of one scenario or another can be sought on the S&P 500 and NASDAQ 100 indices, where Nvidia holds leading positions.
☝️We monitor setups on the 40-minute chart every Wednesday in the private section of Pro Stocks (https://t.co/6NJly7C8bS), and update the long-term scenario as necessary.
.
Pro Services: https://t.co/UeHbkSLWdZ | https://t.co/aeetZzlNNR
Telegram: https://t.co/AeoMho0Lwp
.
#TRADEWAVES #Elliottwave #ВолновойАнализ $NVDA](https://pbs.twimg.com/media/G7l-_lFWEAIzGnM.jpg)








![freetradelife's tweet photo. #Nvidia (#NVDA): Ending Diagonal or Leading Diagonal — That is the Question
I’ll show you several marking options, all based on the same wave structure.
I want to emphasize: I have no doubt that in this particular case, the already completed structure has been interpreted correctly and cannot be seen in two or more ways—for example, as either an impulse or a zigzag. What I’m actually doing is shifting wave degrees, so that the same impulsive pattern can be counted either as the first wave of a larger impulse, or as wave A of a zigzag, which in turn could serve as the first wave of a diagonal, and so on.
I hope I haven’t overloaded you with information right from the start! The key point is: with the same set of "puzzle pieces," Elliott Wave Theory can suggest only a limited number of possible scenario developments. However, most of the time, there are still several options to consider.
🟢Option 1
📈 Fig. 1: All three versions are not new and were proposed by me back in the summer of 2023 in the private part of the Pro Stocks project (https://t.co/6NJly7C8bS).
So, the first scenario shown in Fig. 1 suggests viewing the rally from the top of Primary ④ (3.68) as an A-B-C zigzag, which serves as wave (1) of the ending diagonal ⑤.
📈 Fig. 2: Wave C of zigzag (1) is unfolding as a diagonal, currently in the process of developing subwave [iv].
We know that in a diagonal, wave "4" must end within the territory of wave "1" (i.e., there must be an overlap), but it is not allowed to exceed the length of wave "2". By applying the technique for setting targets in diagonals, we can determine the potential range for the correction to complete. In this case, the range is 153.73–144.43.
☝️ If these conditions are not met, the current wave count will need to be revised—most likely in favor of complicating wave ⓘ within diagonal C into a double zigzag (w)-(x)-(y).
🟠Option 2
📈 Fig. 3: The second option, which is in some ways even more harmonious, suggests that the rally from the top of cycle wave IV (0.2163) is an (A)-(B)-(C) zigzag within the first wave of diagonal V.
As we can see, the difference from the first scenario is only that the diagonal is forming within a higher-degree wave. As a result, the ultimate range of the model can be significantly wider.
🔴Option 3
📈 Fig. 4: And finally, the last scenario for today is an aggressively bullish count, in which, apparently, two extended subdivisions—① and ③—are expected within impulse wave V.
Each of the presented wave counts offers trading opportunities under certain conditions, and each can also be ruled out—again, if specific conditions are met. Clues in favor of one scenario or another can be sought on the S&P 500 and NASDAQ 100 indices, where Nvidia holds leading positions.
☝️We monitor setups on the 40-minute chart every Wednesday in the private section of Pro Stocks (https://t.co/6NJly7C8bS), and update the long-term scenario as necessary.
.
Pro Services: https://t.co/UeHbkSLWdZ | https://t.co/aeetZzlNNR
Telegram: https://t.co/AeoMho0Lwp
.
#TRADEWAVES #Elliottwave #ВолновойАнализ $NVDA](https://pbs.twimg.com/media/G7l_CaeWsAElWoC.jpg)


